ALT Risk Strategy with Fear & Greed + ISM PMI📊 Overview
This advanced crypto trading strategy combines multiple macro indicators to identify optimal buy and sell zones for altcoins. It tracks the relationship between altcoin performance versus Bitcoin (ALT/BTC pairs) while incorporating broader market sentiment and economic data to generate risk-adjusted entry and exit signals.
🎯 Core Methodology
Base Risk Metric (65% weight):
MACD Momentum (5%): Normalized trend strength on weekly ALT/BTC pair
RSI (60%): Relative strength indicating overbought/oversold conditions
Price Deviation (35%): Distance from 150-period moving average
Fear & Greed Index (20% weight):
Analyzes market sentiment using multiple factors:
Price momentum and rate of return
Money flow and volume analysis
Volatility metrics (crypto: BVOL24H, traditional: VIX)
Dominance indicators (crypto: BTC.D, traditional: Gold)
Two modes: Crypto-focused or Traditional markets
Customizable smoothing and weighting
US ISM PMI Integration (15% weight):
Manufacturing economic indicator (contraction vs expansion)
PMI < 50 = Economic weakness = Better crypto buying opportunities
PMI > 50 = Economic strength = Risk-on environment
Configurable offset to lead/lag the signal
Daily data smoothed over customizable period
💰 Trading Logic
Tiered Buy System:
Level 1 (Risk < 70): Initial entry with conservative amount
Level 2 (Risk < 50): Double down as risk decreases
Level 3 (Risk < 30): Maximum accumulation at extreme lows
All purchases customizable by dollar amount
Tiered Sell System:
Level 1 (Risk > 70): Take partial profits (default 25%)
Level 2 (Risk > 85): Continue scaling out (default 35%)
Level 3 (Risk > 100): Final exit (default 40%)
Sells reset when new buys occur (can re-accumulate)
⚙️ Key Features
Multi-Asset Support: ETH, SOL, ADA, LINK, UNI, XRP, DOGE, AVAX, MATIC, RENDER, or custom
Exchange Selection: Works with Binance, Coinbase, Kraken, Bitfinex, Bybit
3Commas Integration: Optional webhook alerts for automated bot trading
Visual Risk Zones: Color-coded indicator (green/lime/yellow/orange/red/maroon)
Real-time Info Table: Displays current risk metric, F&G index, PMI value, weights, and position status
Flexible Weighting: Adjust influence of each component (Base/F&G/PMI)
Weekly Timeframe: Reduces noise and focuses on macro trends
📈 Use Cases
DCA Strategy: Dollar-cost averaging with intelligent timing
Swing Trading: Catching major market cycles (weeks to months)
Risk Management: Exit before major downturns, enter during fear
Macro Trading: Align crypto positions with economic conditions
Bot Automation: Connect to 3Commas for hands-free execution
🎓 Credits & Attribution
Original Concept & Base Risk Metric:
Inspired by community-developed ALT/BTC risk oscillators
Fear & Greed methodology adapted from crypto market sentiment research
Enhancements & Integration:
ISM PMI integration and weighting system
Multi-indicator combination framework
Tiered buy/sell logic with reset mechanism
3Commas webhook integration
Development:
Primary Development: Claude AI (Anthropic)
Collaboration & Testing: User feedback and iteration
Pine Script Implementation: TradingView v5
⚠️ Disclaimer
This strategy is for educational and informational purposes only. Past performance does not guarantee future results. Cryptocurrency trading involves substantial risk of loss. Always conduct your own research and consider your risk tolerance before trading. The strategy uses lagging indicators (weekly timeframe) which may not react quickly to sudden market changes.
🔧 Recommended Settings
For better performance than default conservative settings:
Increase buy amounts: Try $50/$75/$100 for more meaningful positions
Adjust thresholds: Consider 40/60/80 for more frequent entries
Test different weights: Experiment with F&G and PMI influence
Optimize for your asset: Different cryptos may require different parameters
Version: 1.0
Last Updated: December 2025
Compatible With: TradingView Pine Script v5
Greed

Candle Emotion Index (CEI) StrategyThe Candle Emotion Index (CEI) Strategy is an innovative sentiment-based trading approach designed to help traders identify and capitalize on market psychology. By analyzing candlestick patterns and combining them into a unified metric, the CEI Strategy provides clear entry and exit signals while dynamically managing risk. This strategy is ideal for traders looking to leverage market sentiment to identify high-probability trading opportunities.
How It Works
The CEI Strategy is built around three core oscillators that reflect key emotional states in the market:
Indecision Oscillator . Measures market uncertainty using patterns like Doji and Spinning Tops. High values indicate hesitation, signaling potential turning points.
Fear Oscillator . Tracks bearish sentiment through patterns like Shooting Star, Hanging Man, and Bearish Engulfing. Helps identify moments of intense selling pressure.
Greed Oscillator . Detects bullish sentiment using patterns like Marubozu, Hammer, Bullish Engulfing, and Three White Soldiers. Highlights periods of strong buying interest.
These oscillators are averaged into the Candle Emotion Index (CEI):
CEI = (Indecision + Fear + Greed) / 3
This single value quantifies overall market sentiment and drives the strategy’s trading decisions.
Key Features
Sentiment-Based Trading Signals . Long Entry: Triggered when the CEI crosses above a lower threshold (e.g., 0.1), indicating increasing bullish sentiment. Short Entry: Triggered when the CEI crosses above a higher threshold (e.g., 0.2), signaling rising bearish sentiment.
Volume Confirmation . Trades are validated only if volume exceeds a user-defined multiplier of the average volume over the lookback period. This ensures entries are backed by significant market activity.
Break-Even Recovery Mechanism . If a trade moves into a loss, the strategy attempts to recover to break-even instead of immediately exiting at a loss. This feature provides flexibility, allowing the market to recover while maintaining disciplined risk management.
Dynamic Risk Management . Maximum Holding Period: Trades are closed after a user-defined number of candles to avoid overexposure to prolonged uncertainty. Profit-Taking Conditions: Positions are exited when favorable price moves are confirmed by increased volume, locking in gains. Loss Threshold: Trades are exited early if the price moves unfavorably beyond a set percentage of the entry price, limiting potential losses.
Cooldown Period . After a trade is closed, a cooldown period prevents immediate re-entry, reducing overtrading and improving signal quality.
Why Use This Strategy?
The CEI Strategy combines advanced sentiment analysis with robust trade management, making it a powerful tool for traders seeking to understand market psychology and identify high-probability setups. Its unique features, such as the break-even recovery mechanism and volume confirmation, add an extra layer of discipline and reliability to trading decisions.
Best Practices
Combine with Other Indicators . Use trend-following tools (e.g., moving averages, ADX) and momentum oscillators (e.g., RSI, MACD) to confirm signals.
Align with Key Levels . Incorporate support and resistance levels for refined entries and exits.
Multi-Market Compatibility . Apply this strategy to forex, crypto, stocks, or any asset class with strong volume and price action.

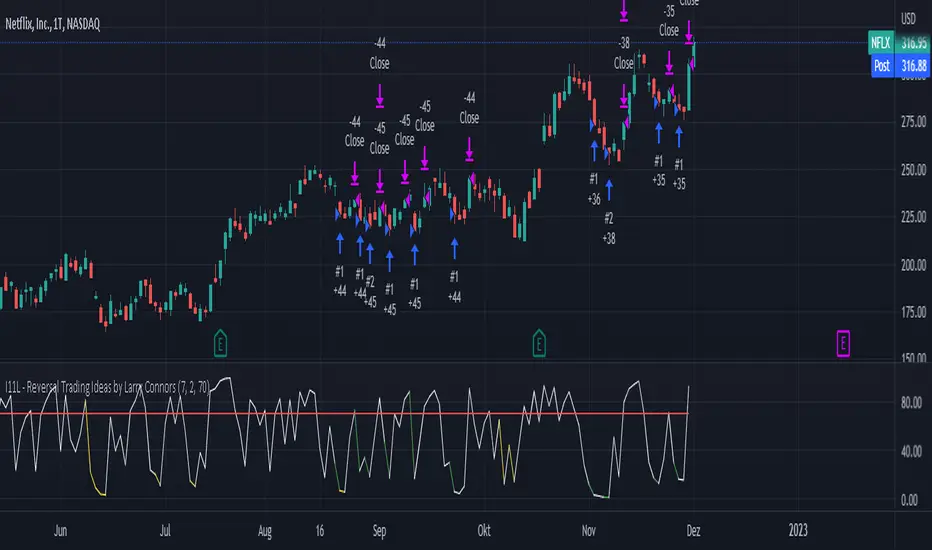
I11L - Reversal Trading Ideas by Larry ConnorsThis is my own Twist on Larry Connors Simple Tradingideas.
It Combines the RSI, Averaging In and the Lowest Bars in a Single System.
The current Configuration is designed for the Daily Timeframe.
Feel free to play with the Parameters and keep in mind that Larry Intended to buy fear and sell the greed!
The Rules are the following:
---Buy---
Buy, if the lowest Bar of your Configuration has been hit (default is set to 7).
---Average Down--
Buy, if the lowest Bar of your Configuration * Your open trades has been hit AND only if the buyin is atleast 1% cheaper.
---Close---
Close, if the RSI closes above a certain level (default is set to 70).
---TP---
There is no TP
---SL---
There is no SL, so be cautions of your tail Risk!
ST_greed_spot_exampleA simple grid long strategy. The first entry into the transaction is carried out according to the "double bottom" pattern, then when the average entry price decreases by a certain percentage, the position is completed. Dobor is always carried out for the same amount of funds. Take profit with an increase in the average entry price for a given volume
