Daily Opening GAPPlots the daily opening gap as a box. As price moves into the box the size of the box is reduced until the gap is closed and the box no longer extends forward.
There are options to include middle lines for the center of the gap, as well as quartile lines.
While there are plenty of opening gap scripts out there none that I found tracked the closing of the gap over time.
Gap
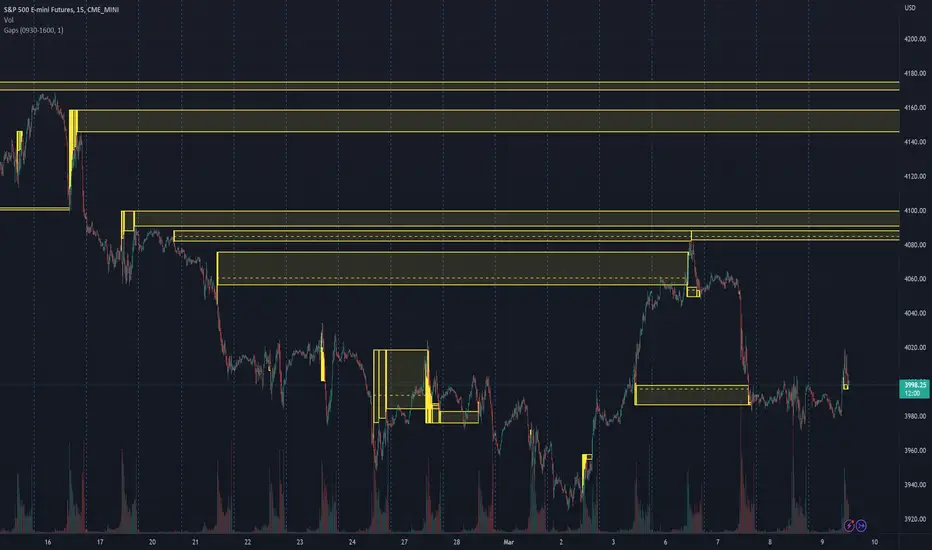
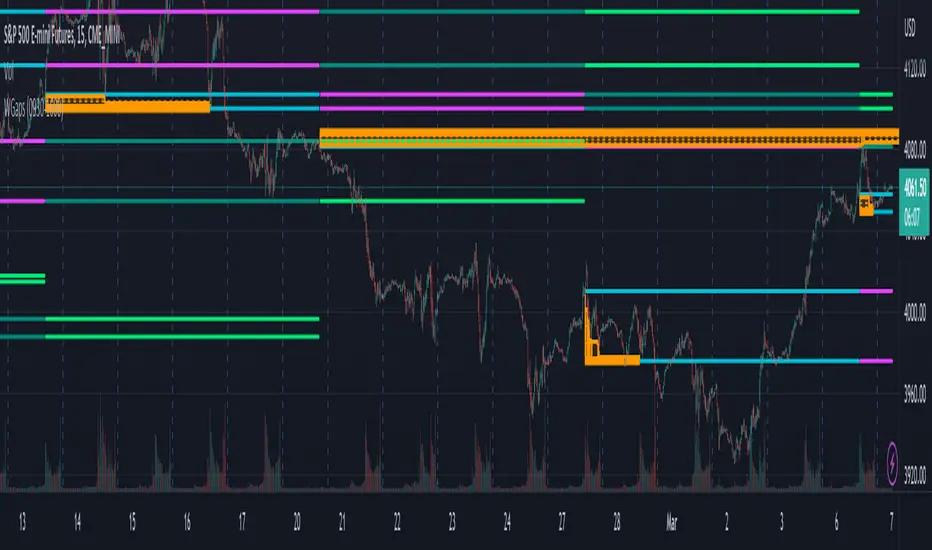
Weekly Opening GAPThis indicator will plot the weekly opening gap on the chart. The gap will be carried forward until it is closed or the max line count is reached. Additionally the 1/4 levels inside the gap are plotted on the chart as weekly gaps can be large.
The weekly opening gap levels can act as targets and rejection points.
Optionally the script can also carry forward the top and bottom lines of the weekly opening gap for up to the 10 prior gaps. These lines are not removed when the gap is closed.
Gaps + Imbalances + Wicks (MTF) - By LeviathanThis script will identify and draw price gaps, wicks and imbalances with customizable fill conditions, multi-timeframe function, zone size filtering, volume comparison, lookback filtering, as well as highly customizable appearance and settings.
I’ve made this indicator to combine the three similar but different elements that occur in price movements and serve as significant zones of interest or way of PA interpretation in various different strategies.
Imbalances (or Fair Value Gap/FVG/Inefficiency/whatever)
- The Imbalance “pattern” consists of 3 candles (1- candle before the sharp move, 2 - sharp move candle and 3- candle after the sharp move). When price makes a move downwards, the imbalance zone is defined as the area between the low of 1 and the high of 3 When price makes a move upwards, the imbalance zone is defined as the area between the high of 1 and the low of 3.
Gaps
A price gap is an area on a chart where no trading activity has taken place. A gap up means that the low of the current candle is higher than the high of the previous candle and a gap down means that the high of the current candle is lower than the low of the previous candle.
Wicks (or shadows/tails/whatever)
Wicks are used to indicate where the price has fluctuated relative to the opening and closing price of the candle. An upper wick is the zone between candle high and candle close/open (whichever is higher) and a lower wick is the zone between candle’s low and candle’s close/open (whichever is lower).
Settings Overview
“Zone Type” - This input lets you decide which zones should the script plot and on which timeframe. You should always pick a timeframe higher than your chat’s.
“Middle Line, Top Line, Bottom Line” - Show or hide the Middle Line (horizontal level in the middle of each zone), Show or hide Top Line (horizontal level at the top of the zone), Show or hide Bottom Line (horizontal level at the bottom of the zone)
“UP/DOWN Zones" - This input lets you show/hide UP Zones or DOWN Zones an pick their color, border color and label color.
”Fill Condition” - If turned ON, the zones will end drawing when your prefered Fill Condition is met (Full Filll = price mitigates the whole zone, Half Fill = zone is at least halfway mitigated and Touch = zone is touched by price). If turned OFF, the zones will only be plotted for the amount of bars defined it “Zone Length”.
”Lookback (D)” - This input lets you limit the amount of zones plotted on the chart by choosing how many days back in time should the script go to find and plot zones. For example, input 1 will only show you the zones of the past day, input 7 will only show you the zones of the past week.
”Hide Filled Zones” - If turned ON, the zones that have been filled will be removed from the chart.
”Show Boxes” - Show or hide the boxes that represent the zones. This is useful for those who want the zones to be visualized by just lines.
“Filter Type” - this input lets you create a filter that will make the script only show zones that are larger than ATR or larger than a certain percentage. You can choose the ATR Length and the multiplier (higher multiplier → larger zone required), as well as the Percentage (%) and its multiplier (higher percentage → larger zone required). If you choose “None”, the zones of all sizes will be plotted.
”Zone Labels” - this part of the settings lets you: show/hide labels, decide on the size of the labels and their positions, choose a custom name for each zone, choose the data that the labels present (Type of the zone/Timeframe/ Volume ).
”Other settings” - ‘Stop/Delete zone after X number of candles’ will force stop/delete the zone if it’s plotted for more than prefered number of bars. ‘Line Style’ lets you choose the style and the color of the lines, ‘Zone Length’ defines the length of the zone if Fill Condition is “None”.
More settings, modifications and improvements coming in future updates. This script is a bit old so I will clean up and optimize the code once I have more time.

Weekly Opening Gap (cryptonnnite)In the context of general equities, opening price that is substantially higher or lower than the previous day's closing price, usually because of some extraordinarily positive or negative news. Opening gap using as a potential target which market usually trades to.

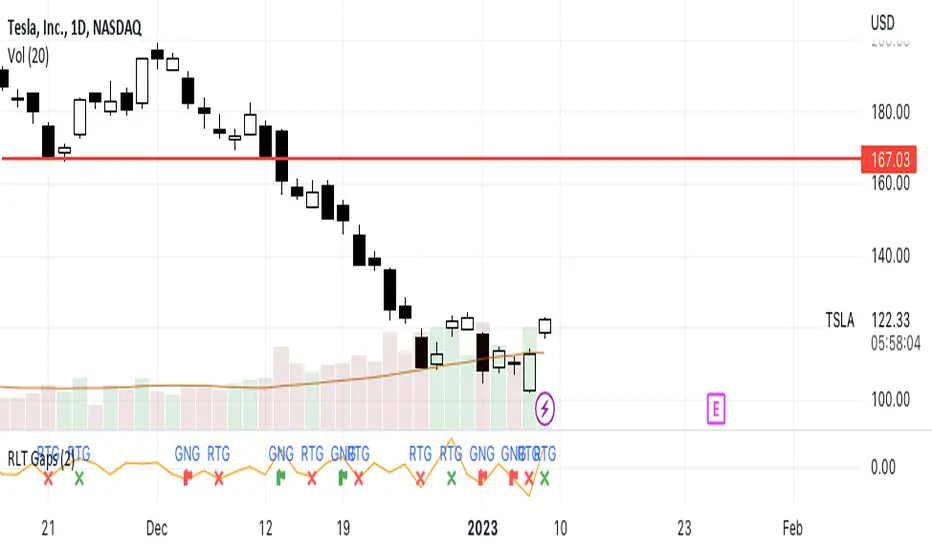
RLT GapsThis tool is meant to help you learn the different types of gaps:
GNG = Gap N Go (flag icon). This occurs
RTG = Retest Gap (x icon)
SETTINGS
Gap Size: Will display a green(bullish) or red(bearish) icon. The 2% (default) gap size will highlight gaps that are greater than the configured setting (2% up or 2% down).
NOTES
The gap size is measured from the previous day CLOSE to the current day OPEN and ignores the current days movement.
Extension %This is a tracking tool to measure two different kinds of distances:
- Gaps, from the open/close or the high/low value to the nearest open/close or high/low value.
- Price extensions of one or two candles from a preferred starting point (open, high, low or close) to a final point (open, high, low or close). The two-candles mode includes an optional rectangle to help you visualize the first and the last point of the measurement.
The script will plot a label with a percentage when the extension reaches the value you set. Unless you choose to track the one-candle price extension, the label will always be displayed on the high/low value of the second candle.

ICT - GAPs and Volume Imbalance
GAPs
Gaps are areas on chart where the price have moved sharply up or down, with no trading in between. Gaps often fill, but they don't have to.
Volume Imbalance
Volume imbalance - determined using 2 candles
Bullish Volume Imbalance - area between the close of 1st candle and the open of 2nd candle
Bearish Volume Imbalance - area between the close of 1st candle and the open of 2nd candle
How to use the indicator:-
When you find imbalance in volume or a GAP in the chart, you may expect price to rebalance it before continuation.
Importantly, GAPs/Imbalances do not always fill. Traders should never assume that a gap/imbalance will fill without understanding the reasons for the gap and monitoring trading activity around the gap.
Pair it with your current bias for better results.

Gap ZonesSharing a simple gap zone identifier, simply detects gap up/down areas and plots them for visual reference. Calculation uses new candle open compared to previous candle close and draws the zone, a mid point is plotted also as far too often it's significance is proven effective.
Works on any timeframe and market though I recommend utilizing timeframes such as weekly or daily for viewing at lower timeframes such as 5, 15 or 30 minutes.
Often price is observed reaching towards zone high/mid/low before rejection/bouncing. These gap zones can give quantitative basis for trade management.
Future features may include alerts based on price crossing up/down gap low, mid and highs. Feel free to message with any other suggestions.

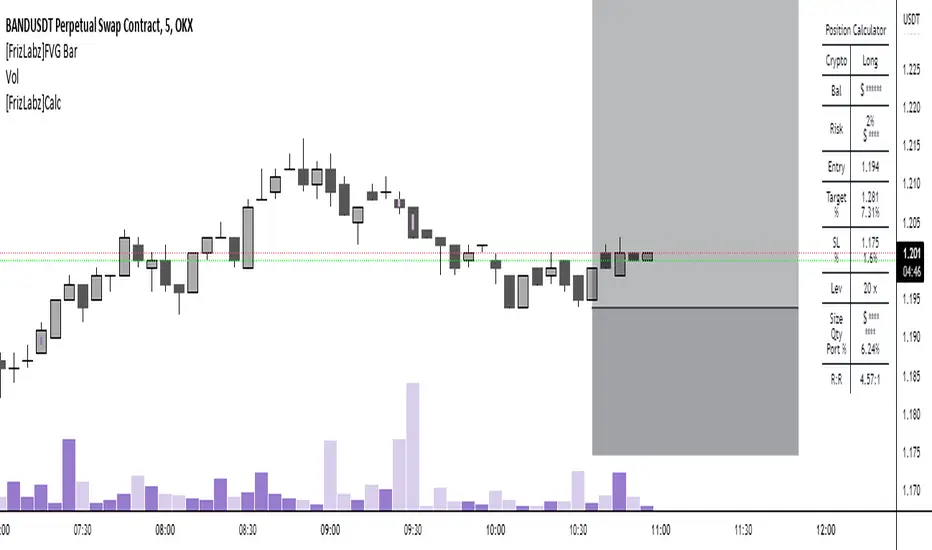
[FrizLabz]FVG Bar
For those of you that like to keep your charts nice and tidy for your Technical Analysis!
FVG = Fair Value Gap
Fair Value Gaps are when impulse movements create an imbalance in price leaving unfilled orders.. they are popular because after one is created we often observe price return to fill these unfilled orders
3 candles make a FVG
When the high/low of most recent candle is lower/high than the low/high of the bar before last
Similar to my other FVG indicator but this one allows you to delete Filled FVGs and have them adjust when filled
Uses a line whose x1 and x2 are on the FVG bar and adjust the size of the FVG with line width because line width on line.new()s doesnt have a cap on line width like plot()s do
Not much too it I made this because a few people were asking if they could delete the FVG after it was Mitigated and since my other uses plots it wasnt possible
so I hope this works for those who were asking about it
hope you enjoy please let me know if you have an idea or find a bug,
Thank You! -
GAP HunterThis indicator shows the GAPs that are formed according to whether the opening price is above or below the rate specified in the selection box. An alarm can be set on these conditions.

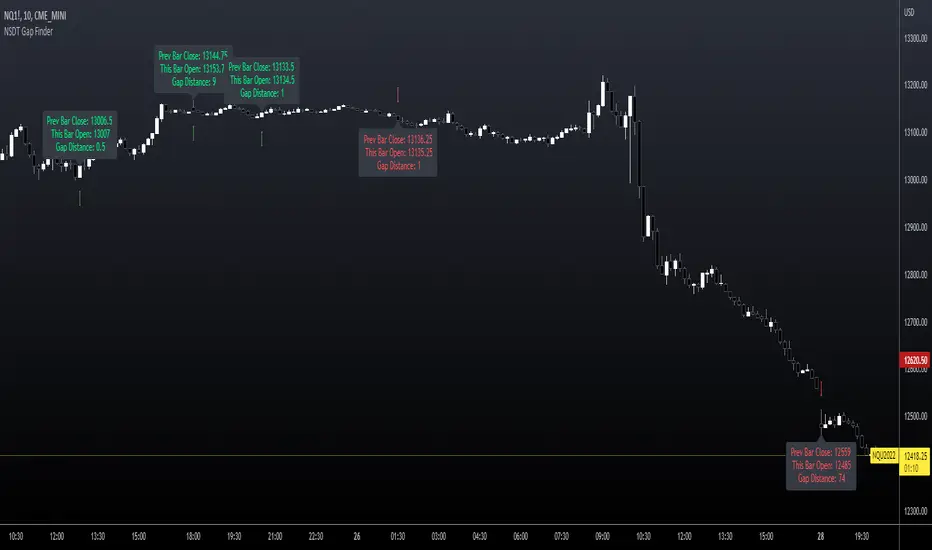
NSDT Gap FinderThis script plots gaps between candles.
It uses the "round_to_mintick" feature in the Pinescript code, so it works on any instrument out to 3 decimal places.
If there is a Gap Up (open of current candle is greater than the close of previous candle) it will plot a green arrow under the current candle and plot a label above the current candle to show the Gap Amount.
If there is a Gap Down (open of current candle is less than the close of previous candle) it will plot a red arrow over the current candle and plot a label below the current candle to show the Gap Amount.
You can turn the label and/or the arrow on and off.
I created this indicator to more easily identify gaps in the market. The probability of a gap being filled is extremely high. Some are right away (intraday candle to candle), some take a while (gap from previous day close to current day open), and some make take a long time (close at end of previous week to open at beginning of current week).
This is published free to use and open source code.
Please see my other similar Gap Indicators.
Daily Gap Range
USA Session - Previous Day Close Gap to Current Day Open
Range Gap/Open to Close/Close to CloseThis indicator shows the percentage variation of:
gap
close to close (day including gap)
open to close (without gap)
The green bars represent the days when the variation did not reach the selected range. The red bars show the days when the variation was higher than the selected range.
Best timeframe : DAY

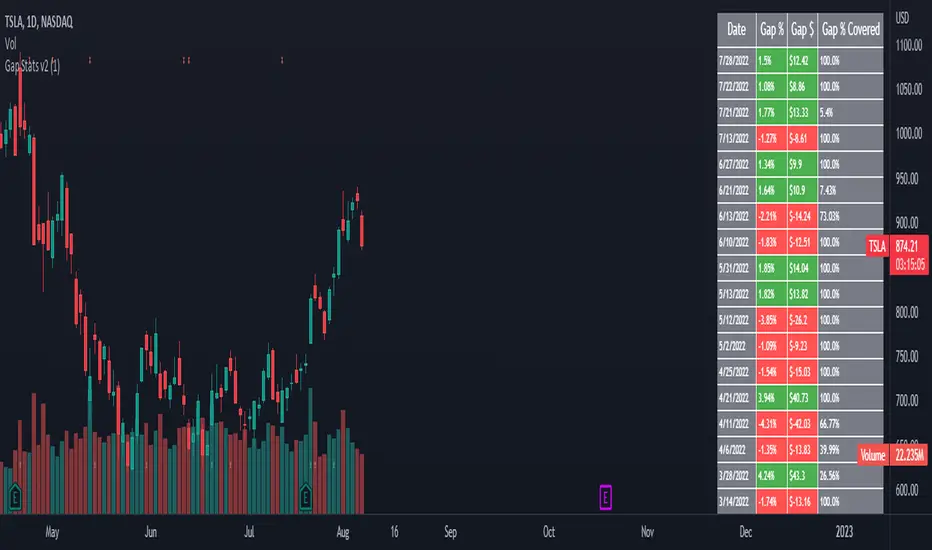
Gap Stats v2This helpful analysis tool displays a table of days a stock has gapped, how much it gapped by and what percentage of the gap was covered.
It is meant to be used on the daily timeframe and can help you distinguish if gaps are going to be filled or not. I like to use it mainly on medium + cap stocks
that have gapped overnight or pre-market and see what the tendency is with how it behaves after a major gap.
Gapgap indicator
True type:
The gap formed between the closing price of the last bar on Friday of the "current" chart period and the opening price of Monday of the "current" chart period
Fix type :
Displays the "daily" gap between Friday's close and Monday's open in "any" chart period
Intution type :
Any gaps are marked
(Not recommended to use in small cycles. There will be a lot of gaps due to the small transaction volume)
Oxy CandlestickOxymoronic (oxy) candlesticks often appear at significant levels in a chart and can indicate increased probabilities of directional moves.
Typically, green candles are hollow and red candles are filled. An oxymoronic candle is colored bullishly but filled bearishly (solid green) or vice versa (hollow red).
Oxy flags occur when:
1) Price gaps up and closes lower than the open but above the last close. A solid green (or black) candle is bearish.
2) Price gaps down and closes higher than the open but below the last close. A hollow red candle is bullish.
An oxy candle indicates one of three things:
1) Price is going up (bullish oxy)
2) Price is going down (bearish oxy)
3) Price will return to this level (either)
#1 and #2 are the default meaning. If those don't play out then look for #3.
As is the case with most indicators, it is best not to use this indicator in isolation, but to combine it with other forms of analysis to increase your probabilities and to identify significant levels.

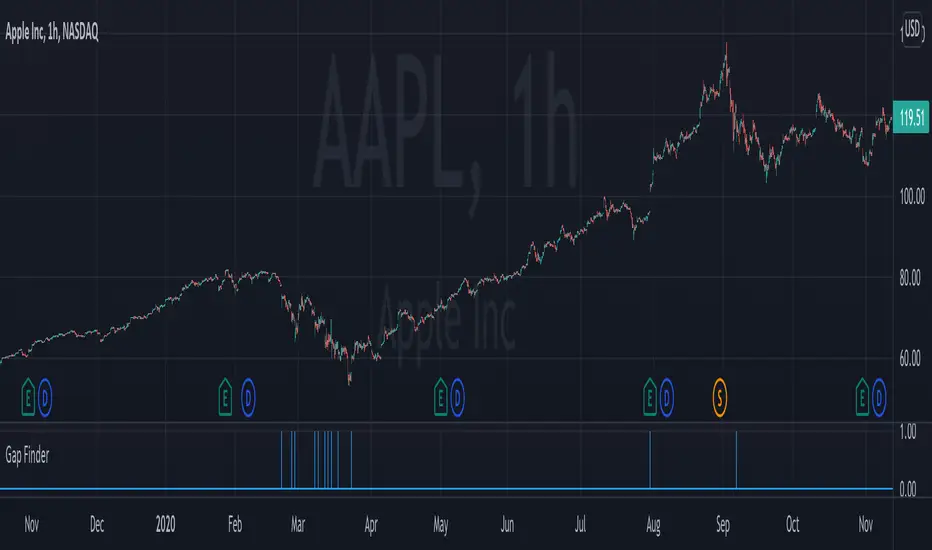
Gap FinderThis indicator finds gaps based on User specified input % threshold in the indicator settings. Histogram plot shows gaps as vertical lines for easy detection. Enjoy!
muh gap! [FAIR VALUE GAP FINDER]Change the colors of the indicator to contrast your chart! Make sure to also change the transparency for the colors.
---
This indicator finds fair value gaps which are inefficiencies in price delivery. Gaps can be used for entry or even bias.
I've included midpoints, lines, and boxes. Boxes have the greatest range with respect to historic PA so keep that in mind.
I will be updating this script in the future, potentially adding an MTF function, mitigation of gaps and alarms.
Let me know if you guys have any additional ideas.
Best,
P

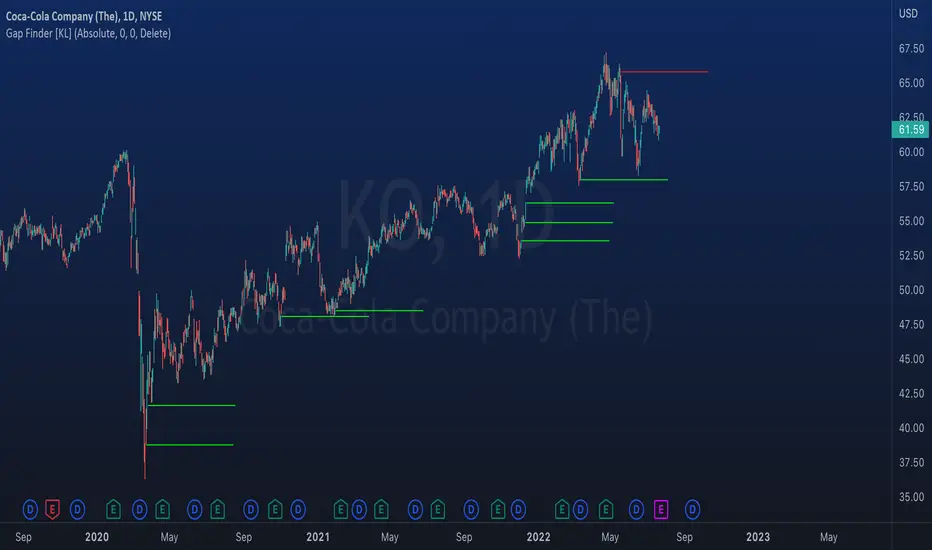
Indicator: Gap Finder [KL]
About gaps:
A gap is a “jump” in a security’s price between the Open and the Prior Close . Gaps are very common in stocks during opening hours, especially when accompanied by catalysts.
What this indicator does:
This script will identify gaps that remained unfilled for at least one candle.
It is very common for gaps to be filled on the first candle, these gaps are arguably less meaningful, so they are ignored by the indicator to reduce the number of lines drawn.
Applications:
Since most gaps eventually get filled, the question is a matter of when . If going with the trend, a trader will open a long/short position when seeing an up/down gap. When going against the trend, then short/long the stock on up/down gaps and consider taking profits when price returns to where the gap originally occurred.
Originally intended for 1D timeframes, but gaps can occur in all timeframes. Applications are limitless.
Gap Absorption StrategyLike the nature, markets don't like the void, and this is something we can take advantage of by trading gaps on some markets.
This technique is well known, so I wanted to write a tiny script based on this strategy to get a bit more comfortable with it.
IMPORTANT: Default parameters wont give you good trades on every markets, you need to modify these parameters to see which proportions correspond to the stock you're trading.
This script triggers signals on predefined variation of a stock price after a gap, and allows its user to configure TP and SL prices corresponding to a specific percentage of this gap movement.
Note: We can observe that opening gaps are often the most interesting.
Options
Trigger: the price variation you want to trigger on (in % of the price)
Stop Loss : in % of the gap
Take profit : in % of the gap
A small table is displayed in the top right corner of the chart to give you TP/SL/Signal prices for each opportunity
SL (red line) and TP (green line) are also displayed on the chart when a signal is triggered
Information concerning the current opportunity is given at the bottom of the chart
Note: This script is based on the Gap-Size-Indicator that I published a few weeks ago.

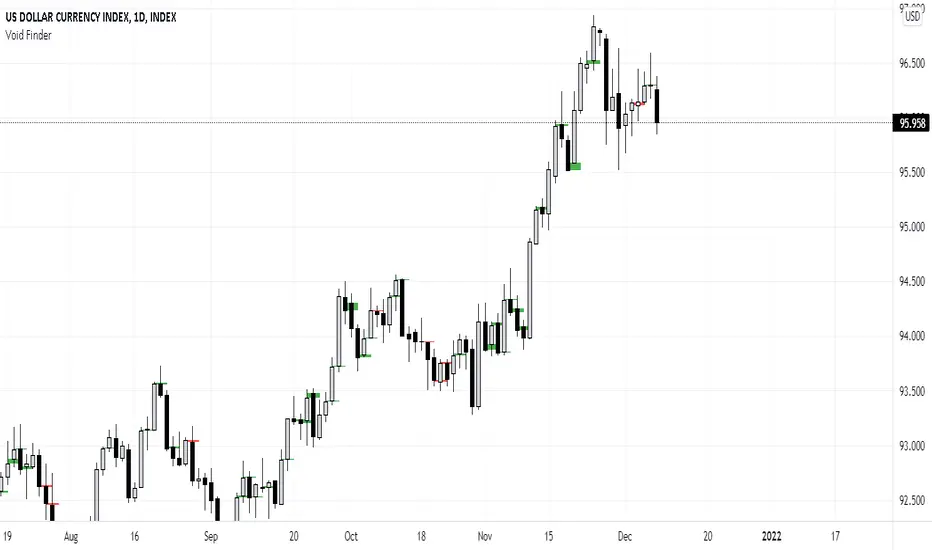
Void FinderWith the Indicator one can find the voids in price in candles.
Void as in when the close and open of candles are not at the same price
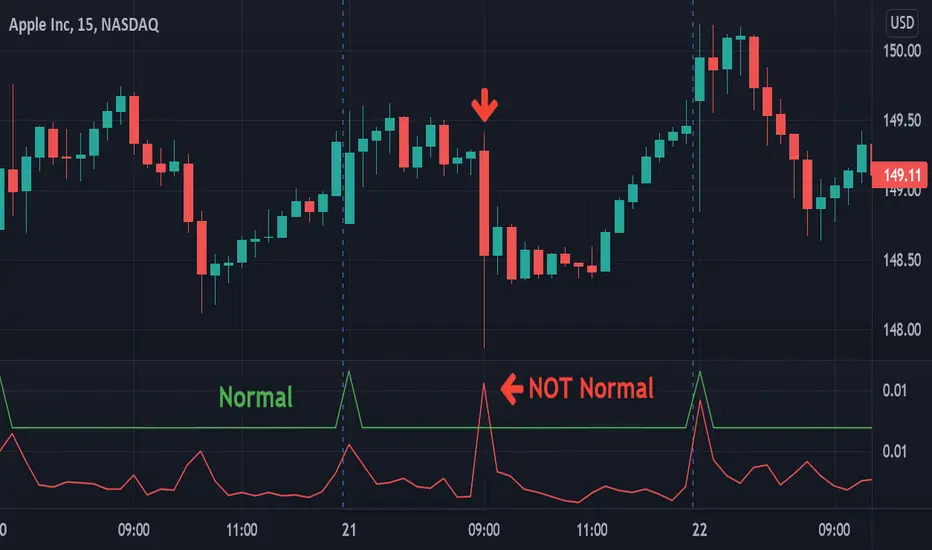
VolatilityLibrary "Volatility"
Functions for determining if volatility (true range) is within or exceeds normal.
The "True Range" (ta.tr) is used for measuring volatility.
Values are normalized by the volume adjusted weighted moving average (VAWMA) to be more like percent moves than price.
current(len) Returns the current price adjusted volatitlity ratio.
Parameters:
len : Number of bars to get a volume adjusted weighted average price.
normal(len, maxDeviation, level, gapDays, spec, res) Returns the normal upper range of volatility. Compensates for overnight gaps within a regular session.
Parameters:
len : Number of bars to measure volatility.
maxDeviation : The limit of volatility before considered an outlier.
level : The amount of standard deviation after cleaning outliers to be considered within normal.
gapDays : The number of days in the past to measure overnight gap volaility.
spec : session.regular (default), session.extended or other time spec.
res : The resolution (default = '1440').
isNormal(len, maxDeviation, level, gapDays, spec, res) Returns true if the volatility (true range) is within normal levels. Compensates for overnight gaps within a regular session.
Parameters:
len : Number of bars to measure volatility.
maxDeviation : The limit of volatility before considered an outlier.
level : The amount of standard deviation after cleaning outliers to be considered within normal.
gapDays : The number of days in the past to measure overnight gap volaility.
spec : session.regular (default), session.extended or other time spec.
res : The resolution (default = '1440').
severity(len, maxDeviation, level, gapDays, spec, res) Returns ratio of the current value to the normal value. Compensates for overnight gaps within a regular session.
Parameters:
len : Number of bars to measure volatility.
maxDeviation : The limit of volatility before considered an outlier.
level : The amount of standard deviation after cleaning outliers to be considered within normal.
gapDays : The number of days in the past to measure overnight gap volaility.
spec : session.regular (default), session.extended or other time spec.
res : The resolution (default = '1440').
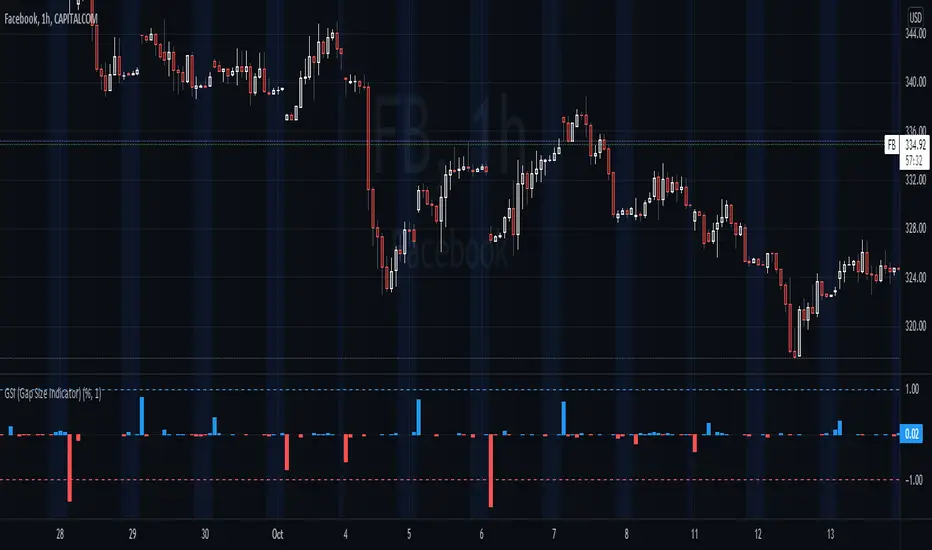
GSI (Gap Size Indicator)The purpose of this indicator is to give a quick view of a gap size between two candles, and to detect any gap bigger than the trigger setting.
Options
Mode: Select the display mode (% or Value)
Variation Trigger: Defines the minimum gap size to give a signal, for both positive and negative sides. This option depends on the Mode setting
Show trigger lines: Enable/Disable the display of the Variation Trigger setting lines
Color signals only: When enabled, bars crossing the trigger value are still colored, but other are gray
Show signals only: When enabled, will only show bars corresponding to gaps crossing the trigger value
Notes
Basic alerts on Bullish , Bearish and All gaps are available.
Feel free to suggest any improvement.
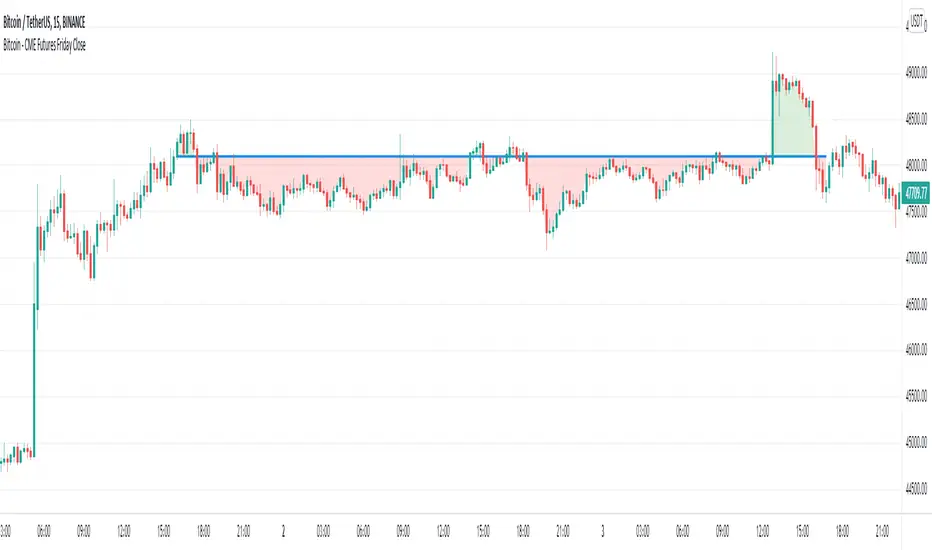
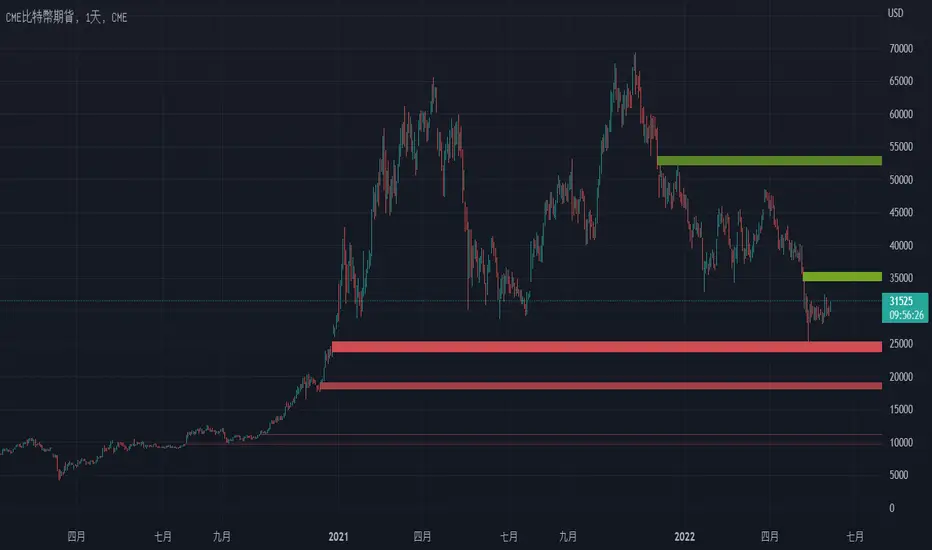
Bitcoin - CME Futures Friday Close
This indicator displays the weekly Friday closing price according to the CME trading hours (Friday 4pm CT).
A horizontal line is displayed until the CME opens again on Sunday 5pm CT.
This indicator is based on the thesis, that during the weekend the Bitcoin price tends to mean reverse to the CME closing price of the prior Friday. The level can also act as support/resistance. This indicator gives a visualization of this key level for the relevant time window.
Furthermore the indicator helps to easily identify, if there is an up or down gap in the CME Bitcoin contract.