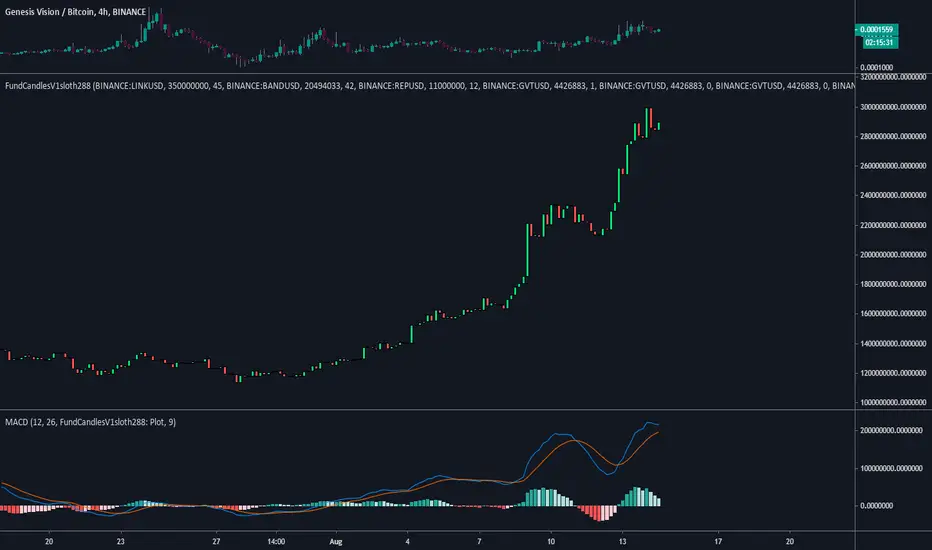
FundCandlesV1sloth288FundCandlesV1sloth288 is an indicator I decided to put together so I can track how funds are doing on $GVT Genesis Vision.
Using a standard MACD or RSI indicator you can change source to use the FundsCandles values to determine if its a good time to enter or exit different funds on the platform.
What you need to know...
Currently all securities need to pair the same, (USD / BTC ).
Security 01, 02, 03 etc etc to maximum of 10 need to be in "BINANCE:LINKUSD" format.
Manually need to input circulating supply from CMC to get the proper ratios for index.
Allocation is the % of the funds exposure to said security.
Inputting the values does not track previous reallocation's, the whole chart will be if the history of the fund was using up to date settings.
Values on the right is the Marketcap of the fund.
Standard settings is of Oracle Basket on the platform made by Somnium Funds as of Aug 13 2020.
Next update will be after GV includes traditional stocks onto the platform for managers to diversify their current allocations into them.
FUND
Best Rabbit StrategyGenesis strategy. Trading strategies can't be so perfect, they can't scrape the bottom and escape the top, and they can't capture all the examples in the market. Trading system only processes the past data, divides the market and classifies it completely.
Don't try to predict how the market will go. It will cost a lot. We should follow the market and make friends with the trend. What will the market do next?
This strategy is mainly the CTA trend tracking concept. Our strategy does not try to capture every kind of market (shock or trend), profit and loss are the same. What trading concept should be adopted to dare to lose the corresponding corner, so that we can make profits in the market with the appropriate concept.
The perfect strategy should be to take four steps and three steps backwards. In the long run, trading is definitely a small profit industry, not a one-night fortune. If anyone can make a fortune, it must be a gambler or so-called analyst or cheater.
Stick to the idea, stick to the operation, don't be afraid of losing money, and make a big profit when the market comes.
Above, good wishes.

Flow of Fund Divergence with alertThe Flow of fund(FOF) divergence signal indicator consists of the following parts: The Flow of fund histogram, FOF trend line and divergence signal. The signal is instantly drawn on current bar and will not repaint.
HISTOGRAM shows an approximate amount of money get in or out of the market within 1 bar. If selling pressure is stronger than buying pressure, it will be a red histogram, otherwise, it will be a green histogram.
Flow of fund trend line indicates the short or long term movement of the flow, determined by the "Length of FOF" input you set.
Divergence
The divergence signal has two types, bearish and bullish.
A bullish divergence occurs when the price hit a lower low and the FOF line is in uptrend. A down arrow will be drawn above the current FOF line when there is a bearish divergence between FOF and price trend.
A bearish divergence occurs when the price hit a higher high and the FOF line is in downtrend. A up arrow will be drawn below price candle bar when there is a bullish divergence between FOF and price trend.

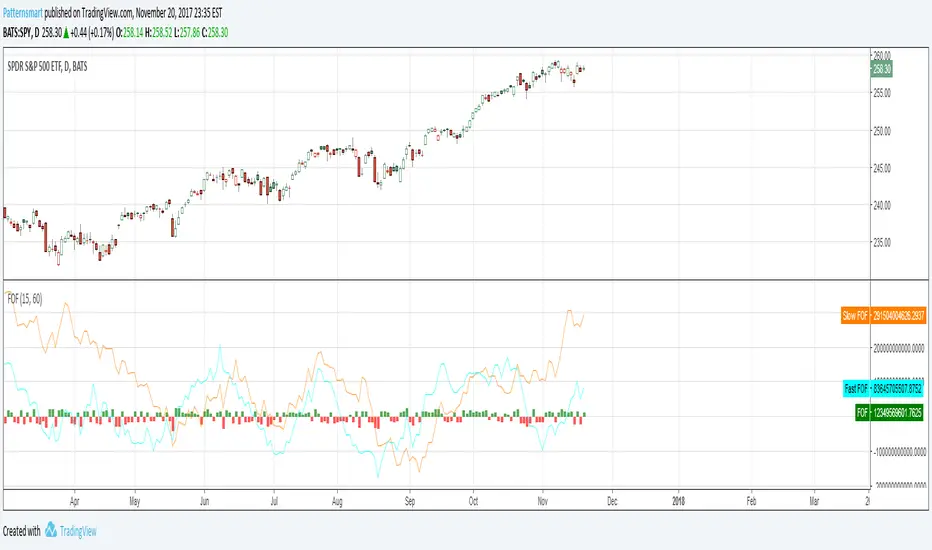
Flow of fund (FOF) indicator
Flow of fund (FOF) simply refers to the direction of money in the market. FOF indicator shows how the flow of funds impacts market price.
The idea of this indicator is very intuitive, prices raise when cash flowing into the market and drop when cash flowing out of market.
The calculation of FOF involves three basic but the most important elements of the financial market: TIME, PRICE and VOLUME.
Flow of fund indicator consists of two parts:
HISTOGRAM shows the total amount of money get in or out of the market within 1 bar.
If selling pressure is stronger than buying pressure, it will be a red bar,
otherwise, it will be a green bar.
Two Flow of fund trend lines, indicating the short and long term movement of money flow.
Fast trend line uses a shorter period of time.
Slow trend line uses a longer period of time.
The length of period of both trend line is adjustable by user.
The orange line in the images is slow FOF, the blue line is fast FOF.
It works within all time period (Tick, Minutes, Daily, Weekly, Monthly) with VOLUME.