Dolphin 3penggunaan FCPO
DISCLAIMER:
This script is provided for **educational and informational purposes only**.
It is **not intended as financial advice** or a recommendation to buy or sell any asset.
Use at your own risk. Past performance does not guarantee future results.
Always do your own research or consult a licensed financial advisor before making trading decisions.
Fcpo!

MYX Future Market Watchlist Generator█ OVERVIEW
This indicator listed all Future market in Malaysia and categorize them into Contract Month, Spread, Current Contract and Continuous Contract.
The indicator was developed to make user easier to make watchlist, suitable for beginners and experts in Malaysia Future Market.
This cover all Malaysia Future Markets as follows :
1. Commodity - FCPO, FPKO, FGLD, FTIN, FPOL and FUPO
2. Equity - FKLI and FM70
3. SSF - FCIM, FDRB, FGAM, FHAR, FINA, FMEG, FGEM, FGEN, FTEL and FTOP
4. Financial - FKB3, FMG3, FMG5 and FMGA
█ INSPIRATIONS
This indicator got inspirations from the previous indicators which I developed :
MYX Malaysia Bursa Futures Derivatives Auto Detect
FCPO Contract Month Table
█ CREDITS
I dedicated to known members in this industry especially who actively involved in Malaysia Future Market.
BURSATRENDBANDCHART
zhafrihandsome
XMODEUS
HAIDOJO_trading
datuksri
wrtech2020
FaizHebat
█ FEATURES
1. As mentioned in overview, main ability to categorize and export into watchlist.
2. Dark or light theme table including table position.
█ IMPORTANT NOTES
1. This indicator is one time usage only to generate watchlist through alert.
2. Use live chart to generate alert.
3. Set Alert Frequency to All.
4. Remove Alert once watchlist is done.
5. Usage method is similar to this video . (Sorry no audio provided)
█ EXAMPLE OF USAGE
FCPO IntradayThis script is specially developed for the reference of Crude Palm Oil Futures ( CPO ) market traders.
Before using this script, traders need to know a few important things, namely:
1. Use of this script is limited to the Crude Palm Oil Futures ( CPO ) market only;
2. The appropriate time-frame for the purpose of using this script is 30 minutes.
Procedures for using indicators.
1. The line on the trading day will only be known after the first candle is completed, i.e. at 10:59:59 am;
2. Then, key in order.
Entry.
The recommended max Entry is once Long and once Short only on the same day.
Long.
1. Traders can only make a purchase when the market price hits the green line;
2. If traders hold a long position, traders can make a sale to close the long position when the price hits the blue line.
Short.
1. Traders can only make a sale when the market price hits the red line;
2. If traders hold a short position, traders can make a purchase to close the short position when the price hits the orange line.

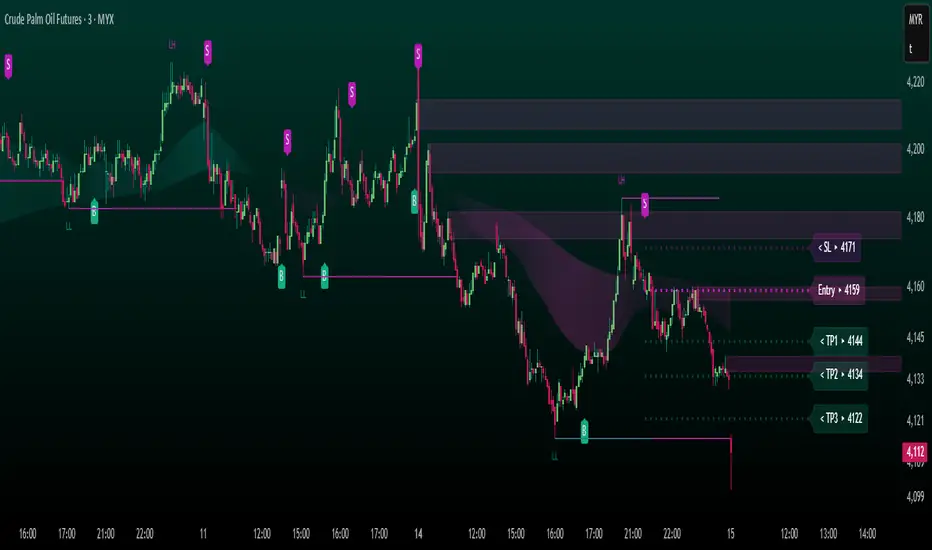
FUTURES ScalpV2 PROTECHFUTURES ScalpV2 PROTECH system
This indicator is built specifically for fast trading i.e. scalping/intraday in the commodity market or futures market. It uses an indicator instrument consisting of ATR TRAILING STOP (ATR), EXPONENTIAL MOVING AVERAGE, PIVOT POINT, and FIBONACCI.
Rebuild of Instrument & Parameter
This indicator is also an upgraded instrument that is sourced from the previous indicator, the COMPLETELY FCPO INDICATOR.
This R&D of course to make trading activities more effective, dynamic and to increase the confidence of traders in current trading activities. The indicator has been upgraded in terms of parameters as well as additional instruments. Among them are;
1. ATR Trailing Stop
2. Exponential Moving Average – fastMA/slowMA Length
3. Label@Entry Price/Stoploss/Takeprofit line
>The best timeframe is 3 minutes
>The take profit and stop loss rates are based on percentages. However
traders can change the percentage rate according to their respective
trading plans.
>existing percentage rates have been set(build-in) specifically for the FCPO
market. So you have to reset for other markets.
>The candle/bars have been colored to make it easier for traders to see price
trends whether in bullish or bearish conditions.
The original instrument has been retained but changed in terms of display & facelift features.
The original indicator (COMPLETELY FCPO INDICATOR) still remains in use and can used together. Hopefully with the combination of these indicators will make traders more successful in trading activities, especially in the futures market.
DISCLAIMER;
ALL NOTES AND INDICATING TOOLS ARE FOR EDUCATIONAL ONLY AND AS A FACILITATOR AND PREPARATION IN TRADING ACTIVITIES. ADMIN IS NOT RESPONSIBLE FOR ANY RISKS IN YOUR TRADING ACTIVITIES. TAKE AT YOUR OWN RISK.
FunTrader/Aieyee @2022
TENKAN BOLTTENKAN BOLT
7 major point in this indicator are as follows :-
•Tenkan-sen
•Ichimoku Cloud
•Exponential Moving Average
•Change of Volume Analysis (calculated in background)
•Modified Keltner Channel (calculated in background)
•RSI Divergence (calculated in background)
•Entry and Exit Point
www.tradingview.com
There will be 2 types of Long entry alert and 2 types of Short entry alert.
•The first one is marked as "Long" or "Short" only which indicates the signal calculated by Keltner Channel, Tenkan-sen and change of volume in sudden time.
•The second one is marked as "Long Divergence" and "Short Divergence" which indicates signal by RSI Divergence in my own way (not aggressive).
The idea of this script is only trade the highest probability setup and I shall call it the "High Probability, Probability Trading". This is definitely not a buy or sell call as the idea of the script is to give a good direction for trader and to learn the high probability trading setup which includes the volatility of the market.
This script specifically created for Futures Crude Palm OIL (FCPO) market and may works differently in different market. It works great in 1 minute time-frame and 3 minute time-frame
(with slight adjustment).
Kindly contact me for usage. Thanks!

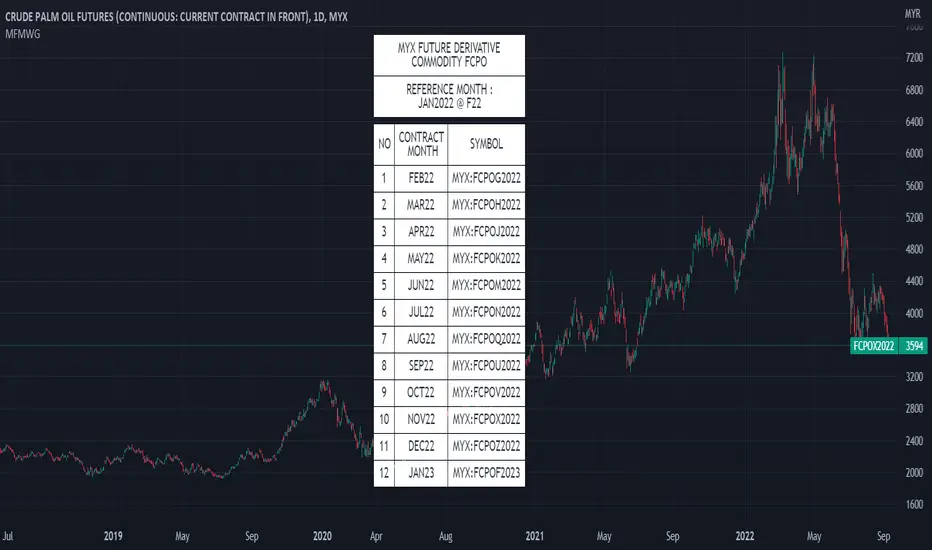
FCPO Contract Month Table█ OVERVIEW
This indicator displays recommended active Contract Month Codes for MYX:FCPO1! based on Crude Palm Oil Futures (FCPO).
█ FEATURES
Display table by changing table position, font size and color.
Show / Hide necessary symbol info.
Font size small for mobile app and font size normal for desktop.
█ HOW TO USE IT
Select starting Year and Month from input.
█ LIMITATIONS
For FCPO market only.
█ CREDITS
Credits to wrtech2020 provide recommended active months for FCPO.

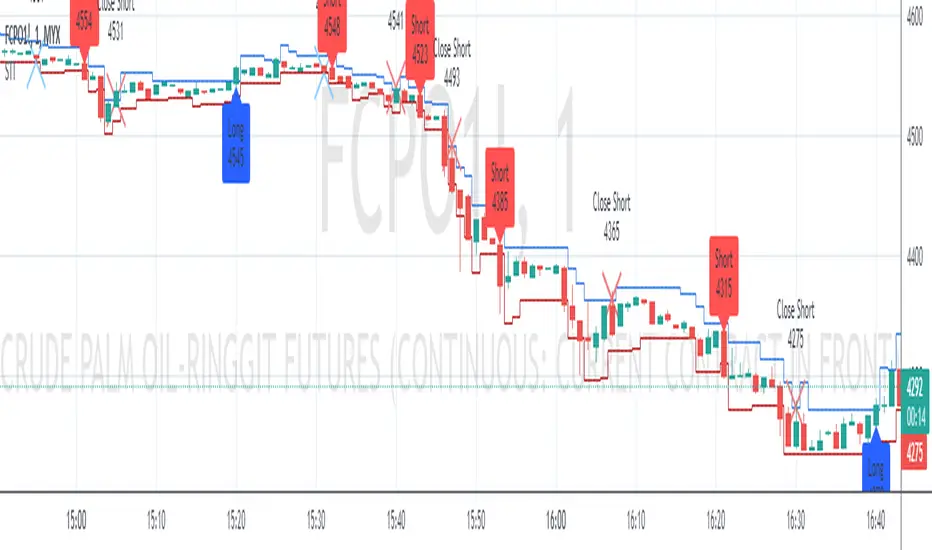
Swing Indicator (Tune for FCPO)Special indicator for FCPO (Crude Palm Oil Futures - Bursa Malaysia Derivative) traders but you can try another instrument.
Trend determination and buy/sell signals are using the Alligator system from Bill Williams.
To get maximum profit, the system uses the trailing stop technique using Average True Range (ATR) with 4 moving average options (RMA, SMA, EMA, WMA).
Please leave comments if any opinions.
Disclaimer
The content is in any event provided with the intention of being for general circulation and availability only. As such it is not intended to and does not form part of any offer or recommendation directed at you specifically, or have any regard to your investment objectives, financial situation, or needs of yourself or any other specific person. Before committing to a trade or investment, please seek advice from financial or other professional advisers regarding the suitability of the trade for you. If you do not wish to seek such financial advice, please consider carefully whether the product is suitable for you as you alone remain responsible for your trading gains and losses.
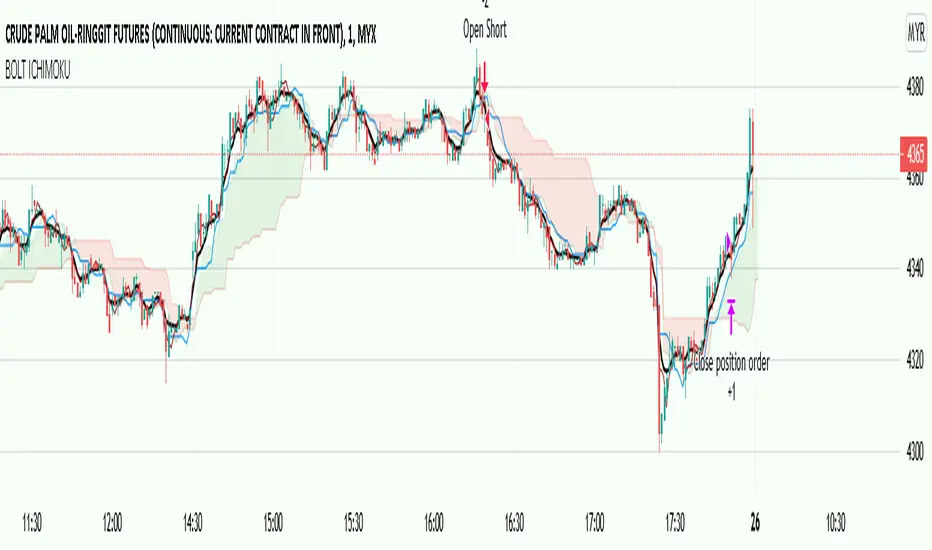
BOLT ICHIMOKUThis strategy is based on custom ichimoku cloud to be used best in 1 minute time-frame. The buy and sell condition must met 3 conditions before it is legit. The strategy backed by ichimoku cloud for initial trend identification, RSI for momentum bias and EMA for major trend bias.
Currently, only tested in Futures Crude Palm Oil (FCPO) market. Maybe can be used in other different markets, user have to test it by themselves.
User can toggle/enable the stop-loss and take-profit value at the bottom of the settings.
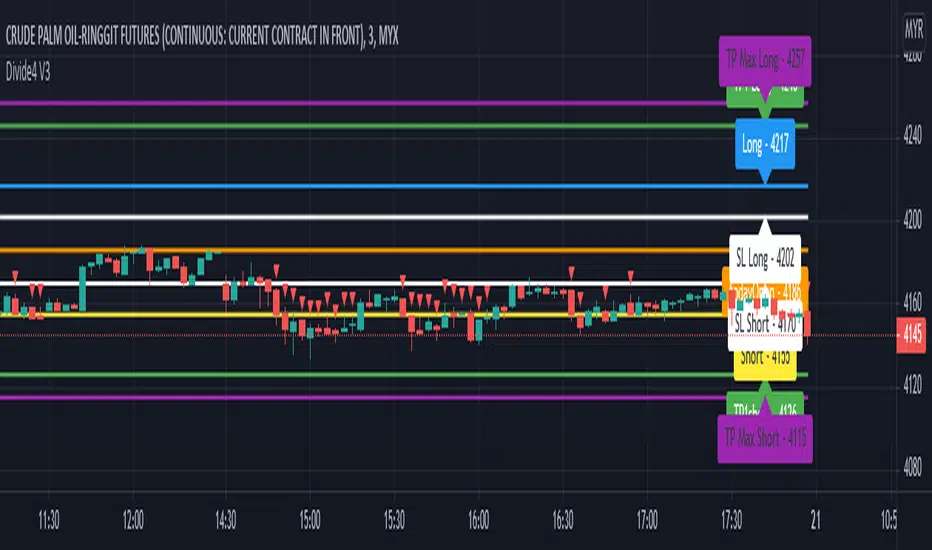
Divide4 V3This script is specially developed for the reference of Crude Palm Oil Futures (CPO) market traders.
Before using this script, traders need to know a few important things, namely:
1. Use of this script is limited to the Crude Palm Oil Futures (CPO) market only;
2. The appropriate time-frame for the purpose of using this script is a small time-frame, i.e. 1 minute to 5 minutes;
Procedures for using indicators.
1. Once the market opens, change the time-frame to 1 minute;
2. The line on the trading day will only be known after the first candle is completed, i.e. at 10.31 am;
3. Then, you can key in order if you want;
4. Let the 1 minute time-frame remain until 11 a.m. Then, you can change a larger time-frame such as 3 minutes or 5 minutes if desired.
Entry.
1. The recommended Max Entry is once Long and once Short only on the same day;
2. If the first Entry reaches Profit Target, it is not recommended to make an Entry for the second time;
3. If the first Entry is about Stop Loss, the second Entry is recommended as opposed to the first Entry.
For example, if the first Entry is Long, but does not reach Profit Target, otherwise it is about Stop Loss, then the recommended second Entry is Short, even though the price is about Entry for Long.
Long.
1. Traders can only make a purchase when the market price hits the blue line;
2. If traders hold a long position, traders can make a sale to close the long position when the price hits the green or purple line closest to the blue line;
3. On the other hand, if the price goes down again after a buy is made, traders need to make a sale to close the buy position when the price goes down to hit the white line closest to the blue line.
Short.
1. Traders can only make a sale when the market price hits the yellow line;
2. If traders hold a short position, traders can make a purchase to close the short position when the price hits the green or purple line closest to the yellow line;
3. On the other hand, if the price rises again after the sale is made, then traders need to make a purchase to close the selling position when the rising price hits the white line closest to the yellow line.
[KG] Intraday Key LevelsKey Level indicator is design to calculate potential Key Level which may act as Intraday Support or Resistance
Price is expected to bounce from these levels before break (or may not break at all)
There's 2 options in the indicator's setting:-
OPTION 1) Show Key Levels - Use this option for planning purposes.. Only use this before market open. Turn off this option when price is in motion.
-There are few lines.. GREEN, YELLOW and RED. Manually draw horizontal lines based on these lines and turn it off once done with planning.
-GREEN Line is intraday support, RED line is intraday resistance.
-YELLOW line will determine intraday BULLISH or BEARISH Bias.
-If price above and stay above YELLOW line, intraday bias will be BULLISH and it price stay below YELLOW line, intraday bias will be BEARISH.
Example of use case:-
1) If price open between YELLOW and RED, we will GO LONG if price bounce from YELLOW line and GO SHORT if price bounce from RED line.
2) We can also Short from RED line if price open near and below the RED (Resistance) line and Take profit when price bounce from YELLOW line.
3) If price open between YELLOW and GREEN, we will GO SHORT if price bounce from YELLOW line and GO LONG if price bounce from GREEN line.
4) We can also LONG from GREEN line if price open near and above the GREEN line (support) and Take profit when price bounce from YELLOW line.
OPTION 2) Show Trend - Use this option when to manage your trade.
- This option will draw all Key EMA and Trend Lines. Use trendline or EMA line as an indicator to hold onto your position until trend change.
Note: Best use with FiFT indicator during active session.

FCPO - NSawit V10.1 Delayed GraphNSawit V10
There are 6 key point in this indicator which are :-
•Lines
•Ticks Status
•Volume Strength
•ACV+ & Arrows
•Gap Remover
•Entry Point
Lines
There are 5 lines that represent Support and Resistant as the guidance in determining market direction.
Purple line, Blue line, Green line, Yellow line and Bollinger band line.
•Purple line represent volume base SnR.
•Blue line represent short term SnR.
•Green line represent long term SnR.
•Yellow line represent current market movement.
•Bollinger Band is to identify sideway market.
Ticks status
Ticks status is a status label that shows todays movement from the lowest and movement from the highest
•Going Up - total movement from the lowest of the day to current price.
•Going Down - total movement from the highest of the day to current price.
Volume Strength
Strong Volume Strength is shown as Purple or Blue candle.
•Purple Candle - shows strong volume pushing the price down.
•Blue Candle - shows strong volume pushing the price up.
ACV+ & Arrows
Accumulated Volume + is a tools that combine Relative Strength of volume and price together to evaluate Overbought and Oversold conditions.
•Purple Arrow - Displayed when Purple candle appeared and Relative Strength of volume changes in ACV+ move above Overbought value.
•Blue Arrow - Displayed when Blue candle appeared and Relative Strength of volume changes in ACV+ move below Oversold value.
Gap Remover
This function will remove the gap that occurred at market open (1030AM or 230PM) in the sense of continuing the lines from last position.
Without Gap Remover
With Gap Remover
Gap Remover can be apply to previous date and opening time at indicator setting. The full version of NSawit V10 will features live automatic Gap remover.
click the link below for setting screenshot.
sc.com.ly
sc.com.ly
Market Open Assist Lines
• At market open at 1030AM / 230PM assist lines will appear for few minutes.
• Target entry at Green Line and reverse entry near the Green Line.
• View Buy if candle stay above Green Line.
• View Sell if candle stay below Green Line.
Entry SOP
• at market open 1030AM & 230PM target entry at Green line.
23 Mac 2021 1030AM
26 Mac 2021 1030AM
Key Entry point
•Green Line at market open.
•Blue Line and Purple line as Pull back target.
•Candle Open above / below lines as confirmation.
•Purple / Blue arrow as indication for direction.
•Divergence in ACV+ purple line and candles position as confirmation.
•Rejection in TF3min as confirmation entry
Recommended Timeframe
TF 30second (Confirmation TF)
TF 1min (Primary TF)
TF 3min (Confirmation TF)

FCPO - NSawit ACV+ V4.2 Delayed OscillatorACV+
Accumulated Volume + (ACV+) is a tools that combine Relative Strength of volume and price together to evaluate Overbought and Oversold conditions.
•Yellow line - represent the Relative Strength of price movement.
•Purple line - represent the Relative Strength of volume changes.
Market Evaluation
ACV+ is displayed as an oscillator and can have a reading between 0 - 100. The size and color contribute to the analysis.
Size
•Big size - price movement and volume changes move away from each other which shows uncertainty of the direction.
•Small size - price movement and volume changes move along together which shows unity in term of direction.
Color
Red = Downtrend
•Dark Red - purple line ( Volume changes) moving down above yellow line (Price movement)
•Light Red - yellow line (Price movement) moving down above purple line ( Volume changes)
Green = Uptrend
•Dark Green - yellow line (Price movement) moving up above purple line ( Volume changes)
•Light Green - purple line ( Volume changes) moving up above yellow line (Price movement)
Recommended Timeframe
TF 30second (Confirmation TF)
TF 1min (Primary TF)
TF 3min (Confirmation TF)

Info Panel : Crude Palm Oil FuturesThis info panel will give a brief overview of the market that is closely related to the price of Crude Palm Oil Futures (FCPO) that traded on Bursa Malaysia Derivatives (BMD).
Among the markets that are closely related to the FCPO price movement are:
1. USDMYR
2. Crude Oil
3. Soy Oil
4. Export and Production data of palm oil from Malaysian Palm Oil Board (MPOB)
The percentage change and the value on the info panel are the difference from the current price minus the closing price yesterday.
You can get the export and production of palm oil from Malaysian Palm Oil Board (MPOB) website. The data will be released on 10th. of every month by 12.30 noon

Nsawit V2.1This indicator is built specifically for FCPO market and it is still in rapid developing phase. It uses Volume as its primary gauge. Basically, it would measure the current and the previous Volume and subsequently weigh the strength of the current Volume. The main objective of this indicator is to spot the swing point. Since the FCPO market is also influenced by the human psychology, this indicator could not determine the top most or bottom most price points accurately; instead it would highlight the potential swing spots.
Dynamically, the indicator would measure the Volume strength and marked it with colored bar - purple for the ‘swing down’ and blue for the ‘swing up’. The indicator would provide the entry at High Strength point which is half of the size of the respective colored bar, if the bar size is big. However, if the bar size is just 1 pip, the entry point would be at the Open or Close position. Stop loss is marked at 1 pip above or below the colored bar.
The developer is currently working on filtering out the false positive points. The indicator is best used in TF3min and MA 10.
