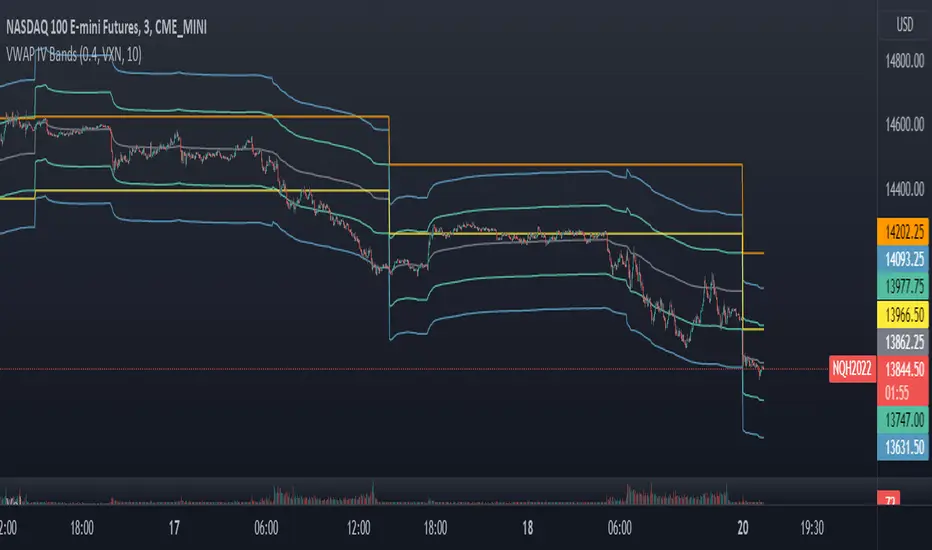
VWAP Implied Volatility BandsThis script takes the built in VWAP function and creates bands using various Volatility Indexes from the CBOE. The script plots the bands at desired multiples, as well as the closing value of the prior day's first set of bands. Users can choose from the following:
VIX(ES), VXN(NQ), RVX(RTY), OVX(CL), GVX(GC), SIV(ZS), CIV(ZC), TYVIX(ZN), EUVIX(EURUSD), BPVIX(GBPUSD)
Upon selecting the desired volatility index, users must change the multiplier to fit the underlying product since the indexes are all calculated differently.
The goal with this script was to use market generated information (IV) to highlight potential trade locations.
S&P 500 E-Mini Futures
VIX Implied Move Bands for ES/Emini futuresThis script uses the close of the VIX on a daily resolution to provide the 'implied move' for the E-mini SP500 futures. While it can be applied to any equity index, it's crucial to know that the VIX is calculated using SPX options, and may not reflect the implied volatility of other indices. The user can adjust the length of the moving average used to calculate the bands, the window of days used to calculate the implied move, and the multiplier that effects the width of the bands.

Equity Index Extended HoursHighlights the extended hours/Globex session for US Equity Index Futures.

Overnight Bollinger Band ExtremesThis script is a combination of my overnight fakeout script and bollinger band color bars. It's designed to be used on CME/CBOT Equity Indexes during their GLOBEX session. It uses the built in Bollinger Band script and highlights bars that exceed the upper/lower bands during the overnight session.

Keltner Channels Color BarsAnother tweak to a classic built-in script. Simply replacing the Keltner Channels overlay plot with color bars.

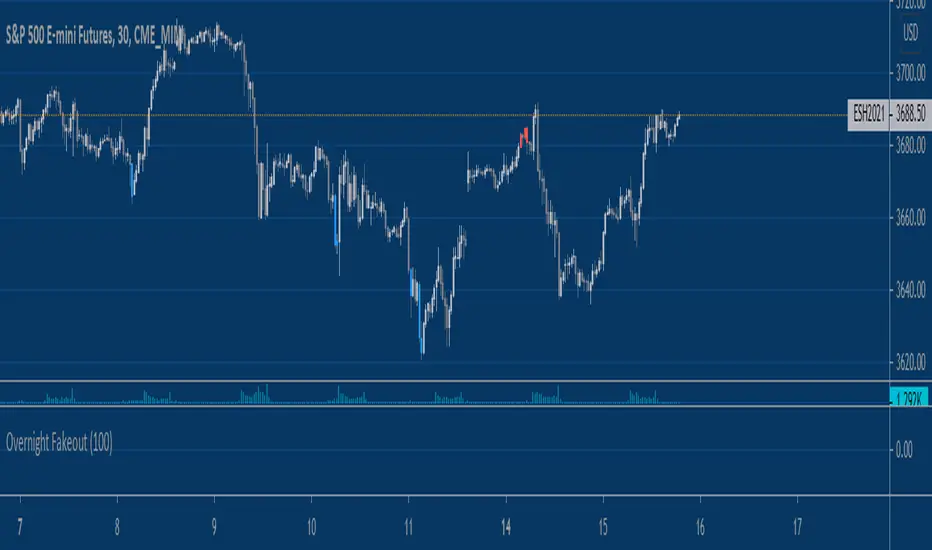
Equity Index Overnight FakeoutThis script highlights when price violates the highest high or lowest low within the user's selected lookback period, with the caveat that it occurs during the GLOBEX session. The script is designed to work exclusively with the trading hours for CME and CBOT Equity Index futures. I'm planning to make a more customizable version down the line.
My reasoning behind this very simple script is that the low liquidity and participation of the overnight session creates a tendency for moves at extremes to mean revert. Let me know what you think.
@WACC Volatility Weighted PUT/CALL Positions [SPX]This indicator is based on Volatility and Market Sentiment. When volatility is high, and market sentiment is positive, the indicator is in a low or 'buy state'. When volatility is low and market sentiment is poor, the indicator is high.
The indicator uses the VIX as it's volatility input.
The indicator uses the spread between the Call Volume on SPX/SPY and the Put Volume.
This is pulled from CVSPX and PVSPX.
When volatility and put/call reaches a critical level, such as the levels present in a crisis or a sell off, the line will be green. See Sept 2015, 2008, and Feb 2018.
This level can be edited in the source code.
As the indicator is based on Put/Call, the indicator works best on larger time frames as the put/call ratio becomes a more discernible measure of sentiment over time.

(JS) S&P 500 Volatility Oscillator For OptionsThe idea for this started here: www.tradingview.com with the user @dime
This should only be used on SPX or SPY (though you could use it on other things for correlation I suppose) given that the instrument used to create this calculation is derived from the S&P 500 (thank you VIX). There's a lot of moving parts here though, so allow me to explain...
First: The main signal is when Implied Volatility (from VIX) drops beneath Historical Volatility - which is what you want to see so you aren't purchasing a ton of premium on long options. Green and above 0 means that IV% has dropped lower than Historical Volatility. (this signal, for example, would suggest using a Long Call or Put depending on your sentiment)
Second: The green line running underneath zero is the bottom portion of the "Average True Range" derived from the values used to create the oscillator. the closer the bottom histogram is to the green line, the more "normal" IV% is. Obviously, if this gets far away from the line then it could be setting up nicely to short options and sell the IV premium to someone else. (this signal, for example, would suggest using something like a Bull Put Spread)
Third: The red background along with the white line that drops down below zero signals when (and how far) the IV% from 3 months out (from VIX3M) is less than the current IV%. This would signal the current environment has IV way too high, a signal to short options once again (and don't take any long option positions!).
Tried to make this simple, yet effective. If you trade options on SPX, SPY, even ES1! futures - this is a tool tailored specifically for you! As I said before, if you want you can use it for correlation on other securities. Any other ideas or suggestions surrounding this, please let me know! Enjoy!

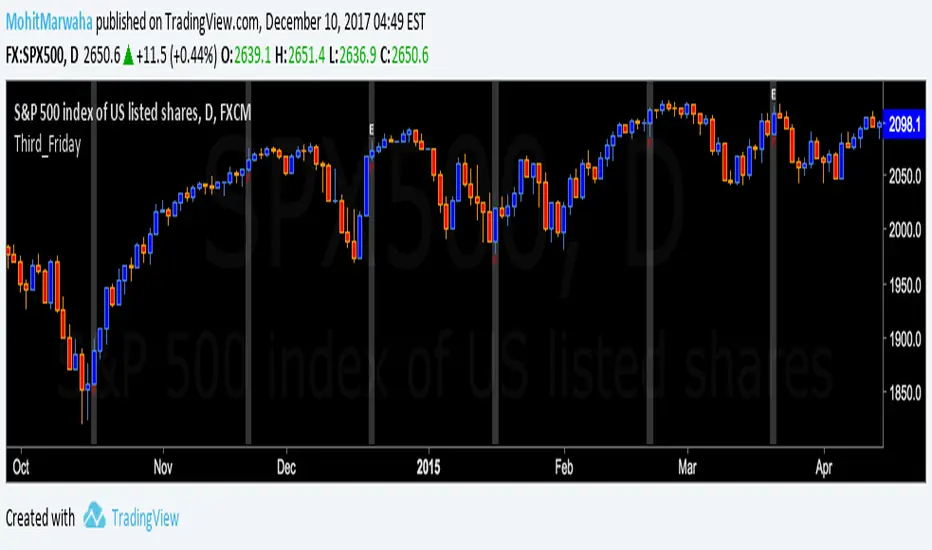
Third_Friday_with_ES1!_ExpiryThe Script Plots a background color on each third friday and also plots the letter E above the fridays on which the ES1! Futures expire.