Fibonacci Retracements & Trend Following Strategy V2This Pine Script strategy generates trading signals using Fibonacci levels and trend-following indicators.
1. Strategy Summary
This strategy analyzes price movements using a combination of Fibonacci levels and trend-following indicators, providing potential trading signals. The strategy includes Fibonacci levels as well as EMA (Exponential Moving Average) and ADX (Average Directional Index) indicators.
2. Indicators and Parameters
Fibonacci Levels
Fibonacci Level 1, Level 2, Level 3, Level 4: Used as Fibonacci retracement levels. These levels are typically set at 0.236, 0.382, 0.618, and 0.786. Users can adjust these values according to their preferences.
Trend-Following Indicator
Trend Length: The period for calculating the EMA used as the trend-following indicator. For example, if set to 20, the EMA will be calculated over 20 periods.
ADX (Average Directional Index)
ADX Length: The period for calculating the ADX. ADX measures the strength of the price trend and is usually set to 14 periods.
ADX Threshold: A threshold value for the ADX. This value determines when trading signals will be activated.
3. Usage Steps
Displaying the Indicator on the Chart:
On the TradingView platform, paste the code into the Pine Editor and click the "Add to Chart" button to add it to the chart.
Analyzing the Indicators:
Fibonacci Levels: Show retracement levels of price movements. When the price reaches one of these levels, potential reversals may occur.
Trend-Following Indicator: EMAs determine the direction of the trend. Green EMA represents an uptrend, while red EMA represents a downtrend.
ADX: Measures the strength of the trend. When ADX surpasses the threshold value, it indicates a strong trend.
Trading Signals:
Long Signal: Generated when the price is above the second Fibonacci level and the trend is upward. Additionally, the ADX value must be above the set threshold.
Short Signal: Generated when the price is below the second Fibonacci level and the trend is downward. Additionally, the ADX value must be above the set threshold.
Target Prices:
Long Targets: Determines upward targets based on Fibonacci levels. These targets indicate expected prices if the price reverses from Fibonacci levels.
Short Targets: Determines downward targets based on Fibonacci levels. These targets indicate expected prices if the price reverses from Fibonacci levels.
4. Chart Displays
Trend Up (Green Line): Shows the rising EMA.
Trend Down (Red Line): Shows the falling EMA.
Fibonacci Levels (Blue Lines): Shows Fibonacci retracement levels.
Long Targets (Green Circles): Shows targets for long positions.
Short Targets (Red Circles): Shows targets for short positions.
Long Signal (Green Label): Buy signal.
Short Signal (Red Label): Sell signal.
5. Important Notes
Retracement and Target Levels: Fibonacci levels can act as potential retracement or support/resistance levels. However, they should always be used in conjunction with other technical analysis tools.
Trend and ADX: ADX is used to determine the strength of the trend. Be aware that when ADX is low, trends may be weak.
6. Example Scenarios
Example 1: If the trend is upward (green EMA) and the price is above the second Fibonacci level, you may receive a long position signal. If the ADX value is above the threshold, the signal may be stronger.
Example 2: If the trend is downward (red EMA) and the price is below the second Fibonacci level, you may receive a short position signal. If the ADX value is above the threshold, the signal may be stronger.
This updated version contains significant improvements in both technical aspects and user experience. Innovations such as ADX calculations and dynamic Fibonacci levels make the strategy more robust and flexible. The code's readability and comprehensibility have been enhanced, and errors have been corrected.
This guide will help you understand the basic operation of the strategy. It is always recommended to conduct your own research and test the strategy before using it.
GOOD LUCK. // halilvarol
EMAS

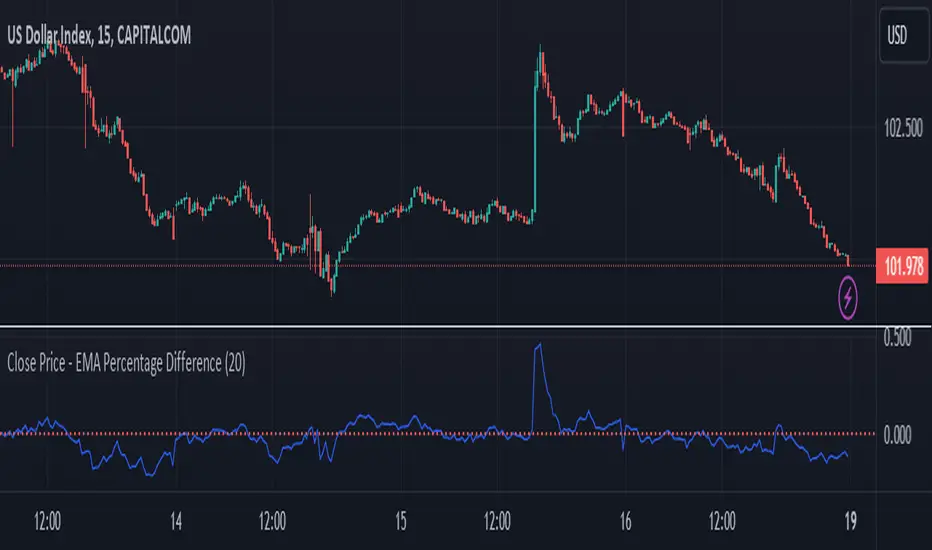
Close Price - EMA Percentage Difference
Title: Close Price - EMA Percentage Difference Indicator
Description:
The Close Price - EMA Percentage Difference Indicator is an essential tool designed to calculate and display the percentage difference between the closing price of a security and its Exponential Moving Average (EMA). This indicator is particularly useful for traders and analysts who want to understand how far the current price is from its EMA, providing insights into potential price trends and reversals.
Key Features:
Customizable EMA Period: Easily adjust the EMA period to match your trading strategy. Whether you're focusing on short-term trends with a 20-period EMA or analyzing long-term trends with a 200-period EMA, this indicator is flexible to suit your needs.
Percentage Difference Calculation: The indicator computes the percentage difference between the closing price and the selected EMA, allowing you to see how much the current price deviates from its moving average in percentage terms. This calculation helps in identifying potential buying or selling opportunities based on price movements relative to the EMA.
Zero Line Reference: A dotted red line at the zero level is included for quick visual reference. This line helps you instantly identify when the closing price is equal to the EMA, and whether the price is above or below the EMA.
Visual Representation: The percentage difference is plotted on a separate panel below the price chart, providing a clear and intuitive visualization that aids in decision-making.
How to Use:
Adjust the EMA period to fit your analysis or trading strategy.
Observe the percentage difference to understand the strength of the current price in relation to the EMA.
Use the zero line as a reference point to determine whether the price is above (positive values) or below (negative values) the EMA, which can help in identifying overbought or oversold conditions.
This indicator is suitable for all types of traders, from day traders to long-term investors, offering valuable insights into the price dynamics relative to the EMA.
Custom EMA Multi-Timeframe Indicator [Pineify]
This innovative indicator combines Exponential Moving Averages (EMAs) across multiple timeframes to provide traders with a comprehensive view of market trends and potential trading opportunities. By analyzing short, medium, and long-term EMAs simultaneously, this indicator offers valuable insights into market dynamics and helps identify high-probability entry and exit points.
Key Features
Multi-timeframe analysis using customizable EMAs
Visual representation of trend alignment across different timeframes
Customizable EMA lengths and sources for each timeframe
Buy and sell signals based on EMA crossovers
Alert functionality for real-time trade notifications
How It Works
The Custom EMA Multi-Timeframe Indicator calculates three separate EMAs:
1. Short-term EMA: Represents immediate market sentiment
2. Medium-term EMA: Captures intermediate trend direction
3. Long-term EMA: Reflects the overall market trend
These EMAs are plotted on the chart using different colors for easy identification. The indicator generates buy and sell signals based on the relative positions of these EMAs, providing traders with clear visual cues for potential trade entries and exits.
Trading Ideas and Insights
This indicator offers several powerful trading concepts:
Trend Alignment: When all three EMAs are aligned (short above medium above long), it indicates a strong trend. Traders can look for pullbacks to enter in the direction of the trend.
Trend Reversal: When the short-term EMA crosses above or below both the medium and long-term EMAs, it may signal a potential trend reversal. This can be used to exit existing positions or enter new trades in the opposite direction.
Range-bound Markets: When the EMAs are tightly grouped together, it suggests a consolidation phase. Traders can wait for a breakout or use range-trading strategies.
Momentum Confirmation: The speed at which the short-term EMA diverges from or converges with the longer-term EMAs can indicate the strength of the current move.
Unique Aspects
What sets this indicator apart is its ability to synthesize information from multiple timeframes into a single, easy-to-interpret visual display. Unlike traditional single-timeframe EMAs, this indicator provides a more holistic view of market trends, reducing false signals and improving trade timing.
The customizable nature of the indicator allows traders to adapt it to various trading styles and market conditions. By adjusting the EMA lengths and sources, traders can fine-tune the indicator to their specific needs and preferences.
How to Use
1. Apply the indicator to your chart
2. Customize the timeframes and EMA settings as desired
3. Look for buy signals when the short and medium EMAs cross above the long EMA
4. Look for sell signals when the short and medium EMAs cross below the long EMA
5. Use the relative positions of the EMAs to gauge overall trend strength and direction
6. Combine with other technical analysis tools for confirmation
Customization
The indicator offers extensive customization options:
Short, medium, and long timeframes can be adjusted
EMA lengths for each timeframe are customizable
EMA source (close, open, high, low, etc.) can be selected for each timeframe
Colors and line styles can be modified to suit personal preferences
Alert settings can be configured for automated trade notifications
Conclusion
The Custom EMA Multi-Timeframe Indicator is a powerful tool for traders seeking to gain a comprehensive understanding of market trends across different time horizons. By combining multiple EMAs and timeframes, it provides a unique perspective on market dynamics, helping traders make more informed decisions and potentially improve their trading results.
Whether you're a day trader looking for short-term opportunities or a swing trader focusing on longer-term trends, this indicator offers valuable insights that can enhance your trading strategy. Its flexibility and customization options make it suitable for a wide range of trading styles and market conditions.
Remember: While this indicator can be a valuable tool in your trading arsenal, it should not be used in isolation. Always combine it with other forms

Multiple EMA Indicator [Pineify]TradingView Multiple EMA Indicator: A Comprehensive Trend Analysis Tool
The TradingView Multiple EMA Indicator is a powerful and versatile tool designed to provide traders with a comprehensive view of market trends across multiple timeframes. By incorporating five Exponential Moving Averages (EMAs) with customizable lengths and sources, this indicator offers a nuanced approach to trend analysis, suitable for both novice and experienced traders.
Key Features:
Five customizable EMAs for multi-timeframe analysis
Flexible source inputs for each EMA
Color-coded plots for easy visual interpretation
Overlay functionality for direct price action comparison
How It Works:
This indicator calculates and displays five separate EMAs on your chart, each with its own customizable length and source. The EMAs are color-coded for easy identification:
EMA-1: Red
EMA-2: Light Green
EMA-3: Light Blue
EMA-4: Purple
EMA-5: Yellow
By default, the indicator uses the following settings:
EMA-1: 10-period EMA of close price
EMA-2: 20-period EMA of close price
EMA-3: 50-period EMA of close price
EMA-4: 100-period EMA of close price
EMA-5: 200-period EMA of close price
However, users can easily adjust these settings to suit their specific trading strategies and preferences.
Trading Ideas and Insights:
The Multiple EMA Indicator offers several ways to analyze market trends and generate trading signals:
Trend Identification: The alignment of the EMAs can help identify the overall trend. When shorter-term EMAs are above longer-term EMAs, it suggests an uptrend, and vice versa for a downtrend.
Dynamic Support and Resistance: Each EMA can act as a dynamic support or resistance level. Price bouncing off these levels can indicate potential entry or exit points.
Crossovers: When a shorter-term EMA crosses above a longer-term EMA, it may signal a bullish trend change. Conversely, a bearish signal may occur when a shorter-term EMA crosses below a longer-term EMA.
Trend Strength: The spacing between the EMAs can indicate trend strength. Wide spacing suggests a strong trend, while narrow spacing or intertwining EMAs may indicate consolidation or a weakening trend.
Multi-Timeframe Analysis: By using different EMA lengths, traders can gain insights into short-term, medium-term, and long-term trends simultaneously.
How to Use the Indicator:
Add the indicator to your chart and adjust the input parameters as needed.
Observe the relative positions of the EMAs to identify the overall trend direction.
Look for potential entry signals when price or shorter-term EMAs cross above or below longer-term EMAs.
Use the EMAs as dynamic support and resistance levels for setting stop-loss and take-profit orders.
Combine the Multiple EMA Indicator with other technical analysis tools, such as oscillators or volume indicators, for more comprehensive trading decisions.
Customization Options:
The indicator offers extensive customization options, allowing traders to tailor it to their specific needs:
Adjust the length of each EMA to focus on different timeframes
Change the source of each EMA (e.g., close, open, high, low, HL2, HLC3, OHLC4)
Modify the color and line thickness of each EMA for better visibility
Conclusion:
The TradingView Multiple EMA Indicator is a versatile and powerful tool for trend analysis and trade decision-making. By providing a multi-faceted view of market trends, it enables traders to make more informed decisions based on a comprehensive understanding of price action across various timeframes.
Remember that while this indicator can be a valuable tool in your trading arsenal, it should not be used in isolation. Always combine it with other forms of analysis and proper risk management techniques for the best results.
We hope this indicator enhances your trading experience and contributes to your success in the markets. Happy trading!

Multi-Timeframe EMA Distance & % Change TableDescription of Multi-Timeframe EMA Distance & % Change Table
The Multi-Timeframe EMA Distance & % Change Table indicator is designed to display the distance and percentage change between the current price and the Exponential Moving Averages (EMAs) on multiple timeframes. It creates a table to show these values, with customizable options for decimal precision .
Key Features:
Inputs:
- Timeframes (tf1, tf2, tf3, tf4): User-defined timeframes for EMA calculations (e.g., 1 minute, 15 minutes, daily, etc.).
- EMA Levels (emaLevel, emaLevel2, emaLevel3): User-defined periods for three different EMAs.
EMA Calculations:
- Computes EMAs for the specified levels (50, 100, 200) on each of the user-selected timeframes.
Plotting:
- Plots the EMAs on the chart with distinct colors: Orange, Teal, and Green for different EMAs.
Display Options:
- Checkbox (displayAsPercentage): Allows the user to toggle between displaying distances or percentage changes.
- Decimal Precision:
- decimalPlacesDistance: Specifies the number of decimal places for rounded distance values.
- decimalPlacesPercentage: Specifies the number of decimal places for rounded percentage values.
Table Creation:
- Location: Table is placed in the top-right corner of the chart.
- Headers: Includes columns for each timeframe and EMA distance/percentage.
Distance and Percentage Calculations:
- Distances: Calculated as the difference between the current price and the EMA values for each timeframe.
- Percentages: Calculated as the distance divided by the EMA value, converted to a percentage.
Decimal Rounding:
- Custom Rounding Function: Ensures that distance and percentage values are displayed with the user-specified number of decimal places.
Color Coding:
- Distance Values: Colored green if positive, red if negative.
- Table Entries: Display either the rounded distance or percentage, based on user selection.
Table Update:
- The table is dynamically updated with either distance or percentage values based on the user's choice and rounded to the specified number of decimal places.
This indicator provides a comprehensive overview of EMA distances and percentage changes across multiple timeframes, with detailed control over the precision of the displayed values.

Dysmen signalsDysmen Signals Indicator
The "Dysmen Signals" indicator is designed to provide clear buy and sell signals based on the crossover of various Exponential Moving Averages (EMAs). This indicator employs a combination of short-term and long-term EMA crossovers to identify potential trading opportunities, while also highlighting significant market movements through specific signals such as the Golden Cross and Death Cross.
Indicator Components
1. Exponential Moving Averages (EMAs)
- EMA 14: A short-term EMA calculated over 14 periods.
- EMA 20: Another short-term EMA calculated over 20 periods.
- EMA 50: A mid-term EMA used as a trend filter.
- EMA 200: A long-term EMA representing the overall trend.
2. Buy and Sell Signals
- Buy Signal: This is triggered when the EMA 14 crosses above the EMA 20 and the closing price is above the EMA 50. This suggests a bullish trend in the market.
- Sell Signal: This is triggered when the EMA 14 crosses below the EMA 20 and the closing price is below the EMA 50. This indicates a bearish trend in the market.
3. Golden Cross and Death Cross
- Golden Cross (GC): Occurs when the EMA 50 crosses above the EMA 200. This is a strong bullish signal indicating a potential long-term upward trend.
- Death Cross (DC): Occurs when the EMA 50 crosses below the EMA 200. This is a strong bearish signal suggesting a potential long-term downward trend.
4. Signal Visualization
- Buy and Sell signals are marked on the chart with green and red triangles respectively. These signals help traders identify potential entry and exit points.
- Golden Cross and Death Cross signals are indicated with yellow and purple diamonds respectively, providing insight into major market trend shifts.
5. Candle Coloring
- Candles are colored green if a buy signal is active and red if a sell signal is active. This visual aid helps in quickly identifying the prevailing market sentiment.
6. EMA 200 Plotting
- The EMA 200 is plotted as a white, semi-thick line on the chart. This line serves as a reference for the overall long-term trend.
Detailed Code Explanation
- EMA Calculations: The script calculates the EMA for 14, 20, 50, and 200 periods using the ta.ema function.
- Crossover Conditions: It uses the ta.crossover and ta.crossunder functions to detect when the EMAs cross each other, triggering buy and sell signals.
- Plotting Signals: The plotshape function is utilized to display BUY and SELL signals as well as Golden Cross and Death Cross signals on the chart.
- Candle Coloring Logic: A variable direction is used to store the current market direction based on the latest signal, which then determines the candle colors using the barcolor function.
- EMA 200 Display: The plot function is used to draw the EMA 200 line on the chart with the specified color and thickness.
By employing this indicator, traders can gain valuable insights into potential market trends and make more informed trading decisions based on the crossover of key EMAs.

MTF-Colored EMA Difference and Stochastic indicatorThis indicator combines two popular technical analysis tools: the Exponential Moving Average (EMA) and the Stochastic Oscillator, with the added flexibility of analyzing them across multiple time frames. It visually represents the difference between two EMAs and the crossover signals from the Stochastic Oscillator, providing a comprehensive view of the market conditions.
Components:
EMA Difference Histogram :
EMA Calculation : The indicator calculates two EMAs (EMA1 and EMA2) for the selected time frame.
EMA Difference : The difference between EMA1 and EMA2 is plotted as a 4 coloured histogram.
Stochastic Oscillato r:
Calculation : The %K and %D lines of the Stochastic Oscillator are calculated for the selected time frame.
Additional Confirmation via Colors :
Green: %K is above %D, indicating a bullish signal.
Red: %K is below %D, indicating a bearish signal.
Entry and Exit Strategies
Entry Strategy :
Bullish Entry :
Condition 1: The histogram is Dark green (indicating a strong upward trend).
Condition 2: The Stochastic colour is green (%K is above %D).
Bearish Entry :
Condition 1: The histogram is Dark Red (indicating a strong downward trend).
Condition 2: The Stochastic colour is red (%K is below %D).
Exit Strategy:
Bullish Exit:
Condition: The Stochastic colour turns red (%K crosses below %D).
Bearish Exit:
Condition: The Stochastic colour turns green (%K crosses above %D).
Additional Considerations:
Time Frame Selection : The chosen time frame for both the EMA and Stochastic calculations should align with the trader’s strategy (e.g., daily for swing trading, hourly for intraday trading).
Risk Management : Implement stop-loss orders to manage risk effectively. The stop-loss can be placed below the recent swing low for long positions and above the recent swing high for short positions.
Confirmation : Consider using this indicator in conjunction with other technical analysis tools to confirm signals and reduce the likelihood of false entries and exits.

Pivot Points with MID LevelsThis indicator shows the Standard Pivot Points level based on daily values that can act as support and resistance. It is used by a variety of traders around the world. You can select which time frame Pivot Point Levels you'd like. Daily, weekly etc... Perfect for swing trading or day trading.
Pivot Points- Shows 3 levels of resistance, the Pivot Point and 3 levels of support
(R3, R2, R1, PIVOT POINT, S1, S2, S3
MID Levels- The MID levels are 50% retracement from the pivot point level above it and below
Example- R3, MID, R2, MID, R1, MID, PIVOT POINT, MID, S1, MID, S2, MID, S3
With this indicator you will also have the option to show the Previous days High and Low that are also important levels. On gap up/down days it is always interesting to see if price will close the gap, hence the important level to note.
PDH= Previous Days High
PDL= Previous Days Low
I have added a feature that you can now select specific color to each level and the line style for each level to help understand which levels are being show by personal needs.
Happy Trading

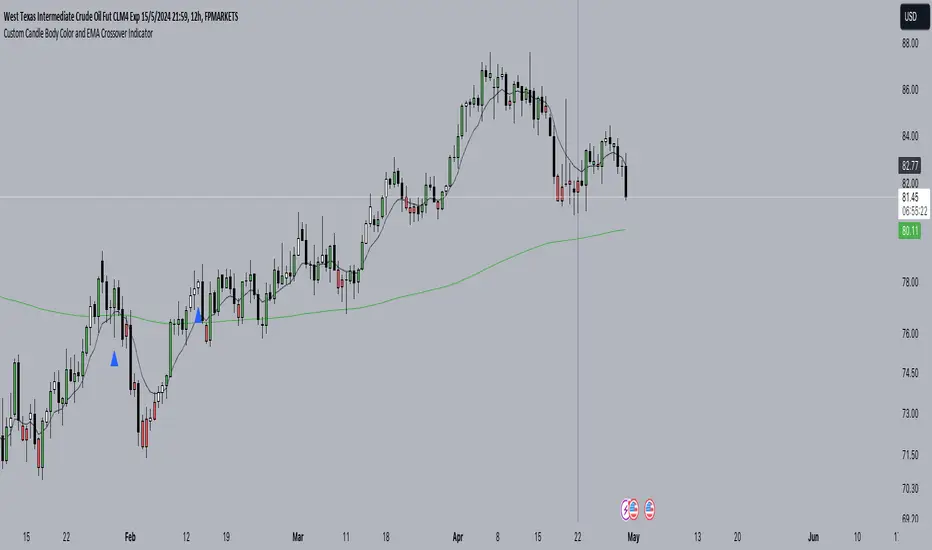
Custom Candle Body Color and EMA Crossover IndicatorWe determine if the price is below EMA 9 by comparing the close price with EMA 9.
We determine if the current candle body is huge compared to the previous candle's body.
We plot EMA 9 in black color and EMA 200 in green color.
We plot blue triangles below the bars for EMA crossover above and red triangles above the bars for EMA crossover below.
We set the color of the candle body to red if the price is below EMA 9 and to green if the price is above EMA 9, only when the current candle body is huge compared to the previous candle's body.
MTF_Super_Uzun_v5_AlarmThis Pine Script code is an indicator named "MTF_Super" (Multi-Timeframe Super) designed for TradingView. It plots exponential moving averages (EMAs) of different lengths on multiple timeframes (MTF). Users can select various time resolutions for the EMAs, such as 4 hours, 12 hours, 1 day, 1 week, 1 month, 6 months, and 3 months.
The indicator calculates EMAs based on the chosen length parameter (`ma_len`) and source data (`src`). It then requests the corresponding security data for each selected timeframe (`ferit`, `eser1`, `eser2`, etc.) and plots the EMAs with different colors for each timeframe.
By using this indicator, traders can analyze the trend of a security on multiple timeframes simultaneously, helping them make more informed trading decisions.
---
Bu Pine Script kodu, TradingView için tasarlanmış "MTF_Super" (Çok Zaman Dilimli Süper) adlı bir göstergeyi oluşturur. Birden fazla zaman diliminde (MTF) farklı uzunluklardaki üssel hareketli ortalamaları (EMA) çizer. Kullanıcılar 4 saatlik, 12 saatlik, 1 günlük, 1 haftalık, 1 aylık, 6 aylık ve 3 aylık gibi çeşitli zaman çözünürlükleri için EMA'ları seçebilirler.
Göstergenin hesaplamaları seçilen uzunluk parametresi (`ma_len`) ve kaynak veri (`src`) üzerinden yapılır. Daha sonra her seçilen zaman dilimi için karşılık gelen güvenlik verisi (`ferit`, `eser1`, `eser2` vb.) istenir ve EMA'lar farklı renklerle her zaman dilimi için çizilir.
Bu göstergeyi kullanarak, tüccarlar bir güvenliğin trendini aynı anda birden fazla zaman diliminde analiz edebilir ve daha bilinçli ticaret kararları alabilirler.

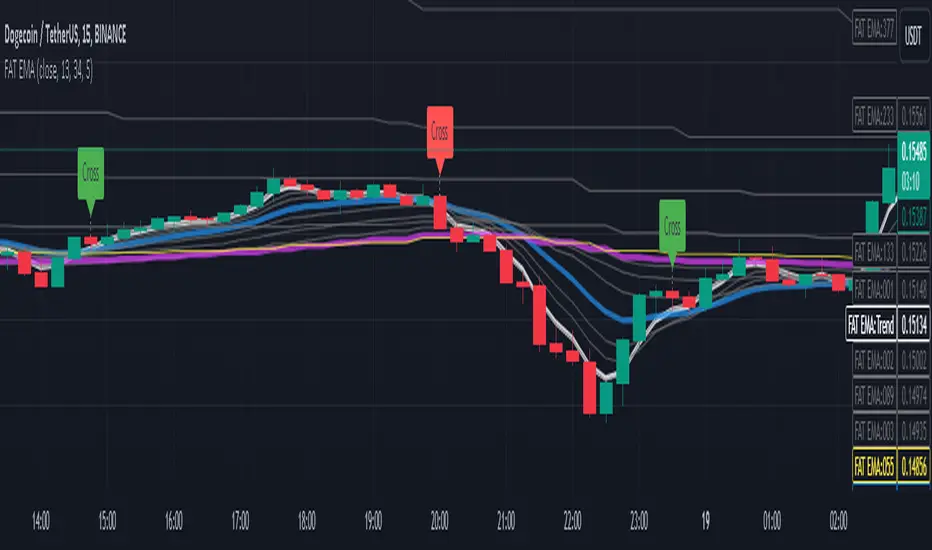
Fibonacci Adaptive Timeframe EMA (FAT EMA)The "Fibonacci Adaptive Timeframe EMA" is a sophisticated trading indicator designed for the TradingView platform, leveraging the power of Exponential Moving Averages (EMAs) determined by Fibonacci sequence lengths to provide traders with dynamic market insights. This indicator overlays directly on the price chart, offering a unique blend of trend analysis, smoothing techniques, and timeframe adaptability, making it an invaluable tool for traders looking to enhance their technical analysis strategy.
Key Features
1. Fibonacci-Based EMA Lengths: Utilizes the Fibonacci sequence to select EMA lengths, incorporating natural mathematical ratios believed to be significant in financial markets. The available lengths range from 1 to 987, allowing for detailed trend analysis over various periods.
2. Multiple Smoothing Methods: Offers the choice between several smoothing techniques, including Simple Moving Average (SMA), Exponential Moving Average (EMA), Smoothed Moving Average (SMMA or RMA), Weighted Moving Average (WMA), and Volume Weighted Moving Average (VWMA). This versatility ensures that users can tailor the indicator to suit their analytical preferences.
3. Timeframe Adaptability: Features the ability to fetch and calculate EMAs from different timeframes, providing a multi-timeframe analysis within a single chart view. This adaptability gives traders a broader perspective on market trends, enabling more informed decision-making.
4. Dynamic Visualization Options: Traders can customize the display to suit their analysis needs, including toggling the visibility of Fibonacci EMA lines, EMA prices, and smoothed EMA lines. Additionally, forecast lines can be projected into the future, offering speculative insights based on current trends.
5. Ema Tail Visualization: An innovative feature allowing for the visualization of the 'tail' or the continuation of EMA lines, which can be particularly useful for identifying trend persistence or reversal points.
6. User-friendly Customization: Through a series of input options, traders can easily adjust the source data, Fibonacci lengths, smoothing method, and visual aspects such as line colors and transparency, ensuring a seamless integration into any trading strategy.
Application and Use Cases
The "Fibonacci Adaptive Timeframe EMA" indicator is designed for traders who appreciate the significance of Fibonacci numbers in market analysis and seek a flexible tool to analyze trends across different timeframes. Whether it's for scalping, day trading, or long-term investing, this indicator can provide valuable insights into price dynamics, trend strengths, and potential reversal points. Its adaptability makes it suitable for various asset classes, including stocks, forex, commodities, and cryptocurrencies.
Fibonacci Timeframe Adaptive EMAThe "Fibonacci Timeframe Adaptive EMA" is a sophisticated trading indicator designed for the TradingView platform, leveraging the power of Exponential Moving Averages (EMAs) determined by Fibonacci sequence lengths to provide traders with dynamic market insights. This indicator overlays directly on the price chart, offering a unique blend of trend analysis, smoothing techniques, and timeframe adaptability, making it an invaluable tool for traders looking to enhance their technical analysis strategy.
Key Features
1. Fibonacci-Based EMA Lengths: Utilizes the Fibonacci sequence to select EMA lengths, incorporating natural mathematical ratios believed to be significant in financial markets. The available lengths range from 1 to 987, allowing for detailed trend analysis over various periods.
2. Multiple Smoothing Methods: Offers the choice between several smoothing techniques, including Simple Moving Average (SMA), Exponential Moving Average (EMA), Smoothed Moving Average (SMMA or RMA), Weighted Moving Average (WMA), and Volume Weighted Moving Average (VWMA). This versatility ensures that users can tailor the indicator to suit their analytical preferences.
3. Timeframe Adaptability: Features the ability to fetch and calculate EMAs from different timeframes, providing a multi-timeframe analysis within a single chart view. This adaptability gives traders a broader perspective on market trends, enabling more informed decision-making.
4. Dynamic Visualization Options: Traders can customize the display to suit their analysis needs, including toggling the visibility of Fibonacci EMA lines, EMA prices, and smoothed EMA lines. Additionally, forecast lines can be projected into the future, offering speculative insights based on current trends.
5. Ema Tail Visualization: An innovative feature allowing for the visualization of the 'tail' or the continuation of EMA lines, which can be particularly useful for identifying trend persistence or reversal points.
6. User-friendly Customization: Through a series of input options, traders can easily adjust the source data, Fibonacci lengths, smoothing method, and visual aspects such as line colors and transparency, ensuring a seamless integration into any trading strategy.
Application and Use Cases
The "Fibonacci Timeframe Adaptive EMA" indicator is designed for traders who appreciate the significance of Fibonacci numbers in market analysis and seek a flexible tool to analyze trends across different timeframes. Whether it's for scalping, day trading, or long-term investing, this indicator can provide valuable insights into price dynamics, trend strengths, and potential reversal points. Its adaptability makes it suitable for various asset classes, including stocks, forex, commodities, and cryptocurrencies.

EMA Cross Dashboard | Flux Charts💎 GENERAL OVERVIEW
Introducing our new Exponential Moving Average (EMA) Cross Dashboard! This dashboard let's you select a source for the calculation of the EMA of it, then let's you enter 2 lengths for up to 5 timeframes, plotting their crosses in the chart.
Features of the new EMA Cross Dashboard :
Shows EMA Crosses Across Up To 5 Different Timeframes.
Select Any Source, Including Other Indicators.
Customizable Dashboard.
📌 HOW DOES IT WORK ?
EMA is a widely used indicator within trading community, it is similar to a Simple Moving Average (SMA) but places more weight on recent prices, making it more reactive to current trends. Crosses of EMA lines can be helpful to determine strong bullish & bearish movements of an asset. This indicator shows finds crosses across 5 different timeframes in a dashboard and plots them in your chart for ease of use.
🚩UNIQUENESS
This dashboard cuts through the hassle of manual EMA cross calculations and plotting. It offers flexibility by allowing various data sources (even custom indicators) and customization through enabling / disabling individual timeframes. The clear visualization lets you see EMA crosses efficiently.
⚙️SETTINGS
1. Timeframes
You can set up to 5 timeframes & 2 lenghts to detect crosses for each timeframe here. You can also enable / disable them.
2. General Configuration
EMA Source -> You can select the source for the calculation of the EMA here. You can select sources from other indicators as well as more general sources like close, high and low price.

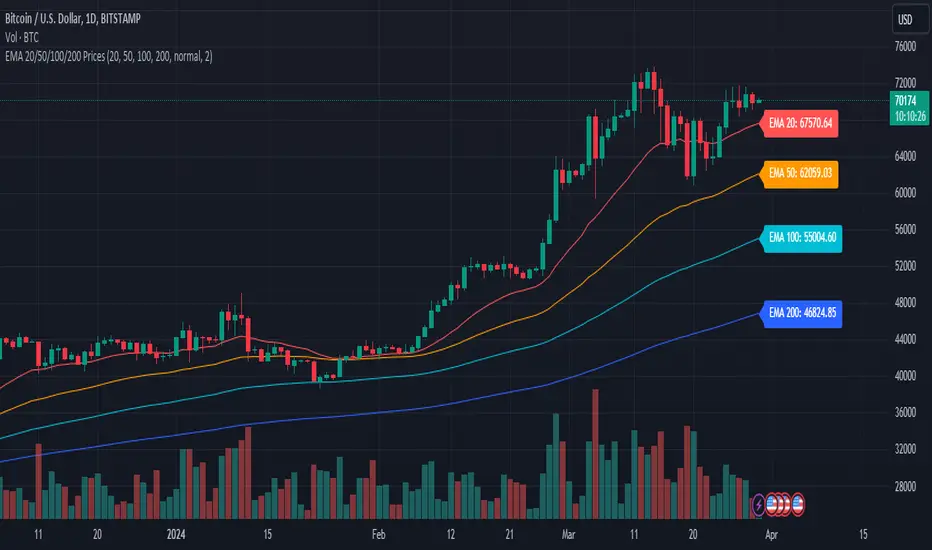
EMA 20/50/100/200 PricesDescription:
Introducing the EMA Indicator with Dynamic Labels, a unique addition to the TradingView Public Library. This innovative script enhances trend analysis and decision-making by overlaying four Exponential Moving Averages (EMAs) – 20, 50, 100, and 200 periods – on your chart, each with a distinct color for quick identification.
What sets this script apart?
Unlike standard EMA indicators, this script includes dynamic labels that display the current price level of each EMA at the latest price bar. This feature provides an instant snapshot of market sentiment, offering insights into potential dynamic support or resistance levels.
Key Features:
Customizable EMA Periods: Tailor the EMA periods according to your trading strategy, allowing for flexibility across different timeframes and assets.
Adaptive Label Sizes: A unique function adjusts label sizes based on user input, ensuring optimal readability across various display settings.
Color-Coded EMAs: Quickly differentiate between the EMAs with pre-defined colors, enhancing visual clarity and trend recognition.
How to Use:
Trend Analysis: Use the EMAs to identify the overall market trend. When shorter EMAs are above longer ones, it suggests a bullish trend, and vice versa.
Trade Entries and Exits: Look for crossovers of the EMAs as potential entry or exit signals. Dynamic labels will help you pinpoint the exact levels.
Customization: Adjust the EMA periods and label sizes under the indicator settings to match your trading style and preferences.
Underlying Concepts:
This script utilizes the classic EMA calculation but innovates by integrating dynamic, real-time labels and customizable periods. The choice of four different periods allows for a nuanced analysis of trend strength and direction, catering to both short-term traders and long-term investors.
Originality and Contribution:
The "Advanced EMA Indicator with Dynamic Labels" is original in its approach to providing real-time, actionable data through dynamic labels. It caters to the community's need for more interactive and informative indicators that go beyond basic trend analysis.
Conclusion:
Whether you're a novice trader seeking to understand market trends or an experienced investor looking for nuanced analysis tools, this script offers valuable insights and flexibility. It stands as a testament to the power of Pine Script in creating practical, user-centric trading tools.
Dual SMA/EMA BandsThe Dual SMA/EMA Bands indicator provides a clear view of market trends, combining Simple Moving Averages (SMA) and Exponential Moving Averages (EMA) in one customizable tool. Designed for any timeframe, it features Aqua and Purple Bands for 50-period and 200-period averages , respectively, aiding in trend analysis and volatility insights.
Features:
Adaptive Timeframes : Automatically aligns with the chart’s timeframe or can be manually set for cross-timeframe analysis.
Customization : Offers easy adjustments for colors, line thickness, and opacity to suit personal preferences and enhance readability.
Insights : Facilitates trend confirmation and volatility assessment, essential for informed trading decisions.
Usage Tips:
Use the bands to gauge market direction; above the bands suggests bullish conditions, below them indicates bearish trends.
The gap between EMA and SMA within each band can signal market volatility.
Apply customizable timeframes for a comprehensive market overview.
Conclusion:
With its straightforward setup and versatile application, the Dual SMA/EMA Bands indicator is a valuable tool for traders looking to deepen their market analysis and uncover trading opportunities.

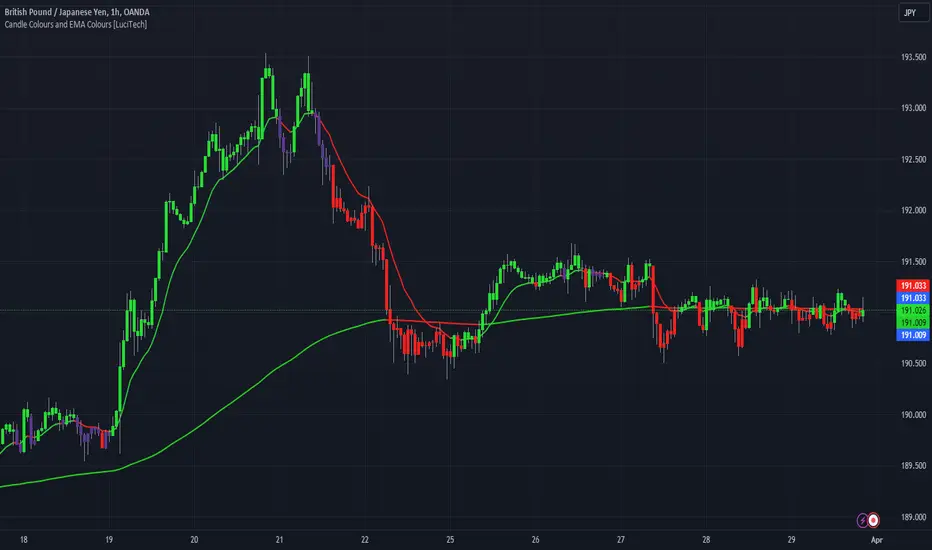
Candle Colours and EMA Colours [LuciTech]this indicator assigns a colour to each candle based on the relationship between the price and the EMAs, The indicator first checks whether the close price is above or below the first EMA, If the close price is above the first EMA the candle is coloured green. If the close price inbetween both EMAs the candle is colored gray. If the close price is below the second EMA, the candle is coloured red.
the indicator also colours the EMAs based on the closed price, if closed price is above the EMAs its coloured green and if price is closed below the EMA is coloured red.
The colours of the candles and EMAs can be changed in "style" and the periods of the EMAs can be changed in inputs.
Price and Volume Stochastic Divergence [MW]Introduction
This indicator creates signals of interest for entering and exiting long and short positions on equities. It primarily uses up and down trends defined by the change in cumulative volume with some filtering provided by a short period exponential moving average (9 EMA by default).
Settings
Moving Average Period : The moving average over which the cumulative volume delta is calculated. Default: 14
Short Period EMA : The EMA used to represent price action, and is used to generate the EMA Delta line. Default: 27 (3*3*3)
Long Period EMA : The second EMA used to calculate the EMA Delta line. Default: 108 (2*2*3*3*3)
Stochastic K Value : The value used for stochastic curve smoothing. Default: 3
Dot Size : The diameter of the larger indicator. Default: 10
Dot Transparency : The transparency level of the outer ring of the primary BUY/SELL signal. Default: 50 (0 is opaque, 100 is transparent)
Band Distance from 0 to 100 : The upper and lower band distance. Default: 20
Calculations
The cumulative volume delta (CVD) is calculated using candle bodies and wicks. For a red candle, buying volume is calculated by multiplying the volume by the spread percentage of the average of the top and bottom wicks, while Selling Volume is calculated multiplying the volume by the spread percentage of the average of the top and bottom wicks - in addition to the spread percentage of the candle body.
For a green candle, buying volume is calculated by multiplying the volume by the spread percentage of the average of the top and bottom wicks - plus the spread percentage of the candle body - while Selling Volume is calculated using only the spread percentage average of the top and bottom wicks.
Once we have the CVD, we can then perform a stochastic calculation of the CVD value.
stochastic calculation = (current value - lowest value in period) / (highest value in period - lowest value in period)
We’ll do the same stochastic calculation for the short term EMA (27 EMA default) as well as for the difference between the short term and long term EMA.
When the stochastic CVD value is rising from zero and the short term EMA stochastic value equals 100, then it’s a major bullish signal. When the stochastic CVD value is falling from 100 and the short term EMA stochastic value equals 0, then it’s a major bearish signal.
Sometimes, after a bullish or bearish signal, the stochastic CVD will reverse direction triggering a new opposing signal.
How to Interpret
The CVD indicates when there is either more buying than selling or vice versa. A value over 50 for the stochastic CVD curve represents more buying taking place. A value below 50 represents more selling. One might intuitively believe that when there is more buying volume than selling volume that the price would follow suit. This is not always the case.
Most of the time buying volume will precede consistent price movement upwards, and selling volume will precede consistent price movement downwards. When this divergence occurs, the indicator generates a signal. When this divergence begins to fail, and buying or selling volume reverses, then another signal is generated indicating that the buying/selling impulse is headed back into the direction of price action.
These interactions are visually represented on the chart with the coral line that represents CVD, and the yellow line that represents the EMA, or the average price. When the coral line goes up and the yellow line stays down, that’s the BUY signal. When the coral line goes down and the yellow line stays up, that’s the sell signal. When the coral line switches direction, the chart generates another signal showing that volume is moving in a direction that supports the price.
The orange line represents the stochastic representation of the difference between the short EMA (27 by default) and the long EMA (108 by default). EMA differences is a method that can be used to define a trend. When a short term EMA is above a longer term EMA, that may represent a bullish trend. When it is below, that may represent a bearish trend. When all 3 lines are rising or falling in the same direction at the same time, it tends to indicate a movement that has the potential to continue.
Other Usage Notes and Limitations
It's important for traders to be aware of the limitations of any indicator and to use them as part of a broader, well-rounded trading strategy that includes risk management, fundamental analysis, and other tools that can help with reducing false signals, determining trend direction, and providing additional confirmation for a trade decision. Diversifying strategies and not relying solely on one type of indicator or analysis can help mitigate some of these risks.
This indicator can be paired with the MW Volume Impulse indicator if it is desired to see the actual buying and selling cumulative volume deltas. Also, in many cases, the BUY and SELL signals tend to correspond with Keltner Bands (ATR Bands) becoming extended. Lastly, volume weighted average price (VWAP) along with other macro events can impact price and negate signals. To view VWAP lines, you may choose to use the Multi VWAP or Multi VWAP for Gaps indicator to help ensure that the signals you see in this indicator are not being affected by VWAP lines.

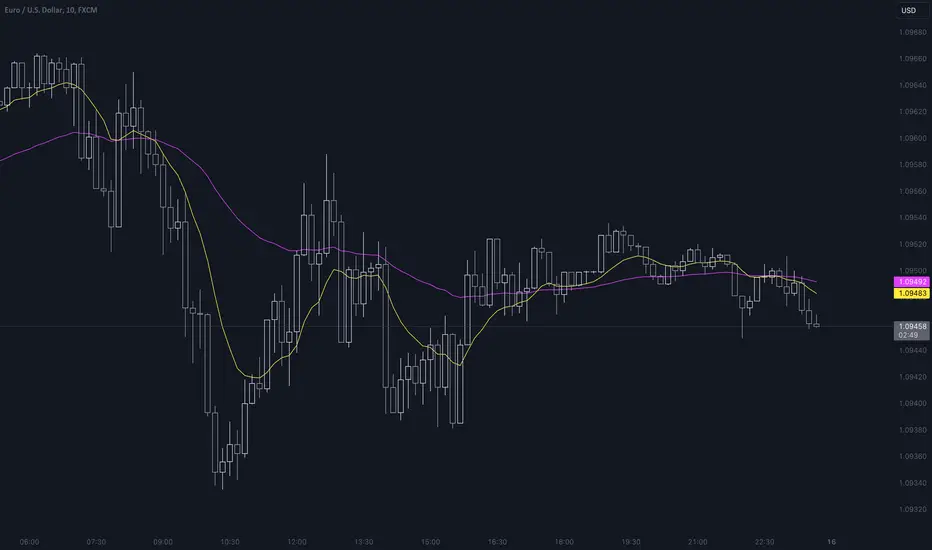
EMA + Lower Timeframe EMA (correct display in Replay Mode)This indicator shows
one EMA for the current timeframe
one EMA for a lower timeframe
Unlike the built-in Tradingview EMA indicator, this indicator shows the correct values for the lower timeframe EMA during Replay Mode.
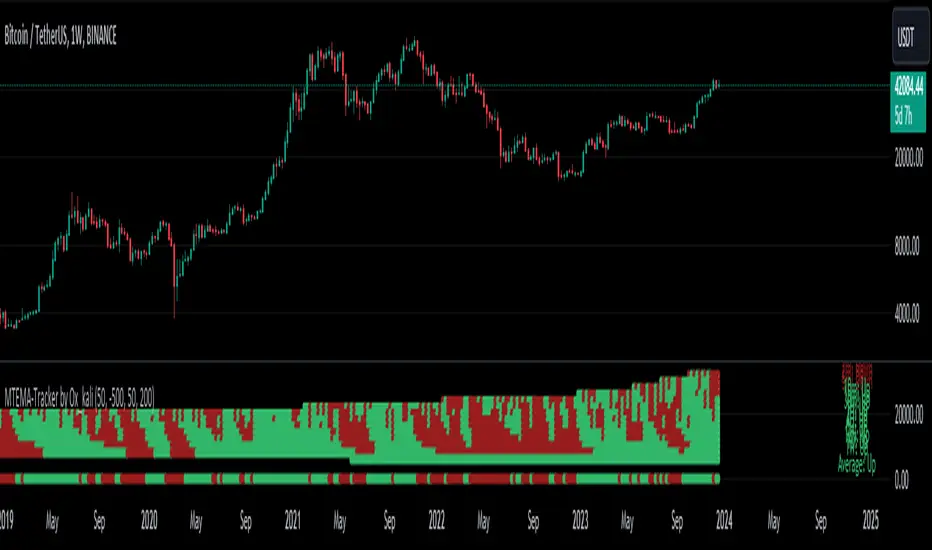
Multi-Timeframe EMA Tracker by Ox_kaliThis script is an advanced trend analysis indicator crafted for traders who seek a detailed and customizable view of market trends across multiple timeframes. This tool utilizes exponential moving averages (EMAs) to offer insights into market direction and momentum.
Key Features:
Multi-Timeframe Analysis: MTEMA-Tracker covers a wide range of timeframes, including 1, 2, 3, 5, 10, 15, 30 minutes; 1, 2, 4, 6, 12 hours; 1 day; and 1 week. This allows traders to analyze market trends from various perspectives, from short-term fluctuations to longer-term movements.
EMA-Based Trend Determination: The indicator employs two EMAs (50 and 200 periods) for each timeframe to ascertain the market trend. A higher EMA50 compared to EMA200 indicates an uptrend, while the opposite scenario suggests a downtrend.
User-Defined Trend Colors: Traders can personalize the appearance of the trend lines with custom colors for upward and downward trends, enhancing visual clarity and quick interpretation.
Selectable Timeframe Display: MTEMA-Tracker by Ox_kali offers the flexibility to choose which timeframes to display, enabling traders to focus on the most relevant data for their trading strategy.
Average Trend Calculation: A unique feature of MTEMA-Tracker is its ability to compute the average trend across all selected timeframes, providing a holistic view of the market's general direction.
List of Parameters:
Color of the trend: Customizable color settings for both upward and downward trends.
Settings for the Lengths of the EMAs: Options to set the lengths of the short and long-term EMAs.
Display Options for Each Timeframe's EMA Trend: Ability to activate or deactivate the display of EMAs for each selected timeframe.
Indicators and Financial Name Label settings: To ensure maximum clarity and understanding of the displayed trends, users should not hesitate to use the function to display "indicators and financial name labels" in their settings. This feature will help in identifying the legends for each trend, making it easier to interpret the market direction for the selected timeframes.
Please note that the MTEMA-Tracker is not a guarantee of future market performance and should be used in conjunction with proper risk management. Always ensure that you have a thorough understanding of the indicator’s methodology and its limitations before making any investment decisions. Additionally, past performance is not indicative of future results.
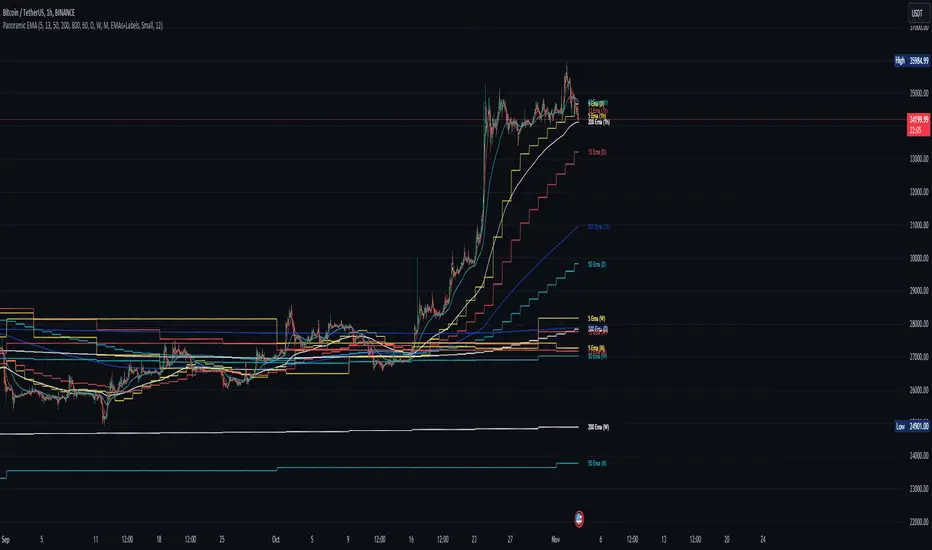
Panoramic EMA - Multi TimeframePanoramic EMA - Multi Timeframe
This indicator provides a straightforward visualization of Exponential Moving Averages (EMAs) from multiple timeframes simultaneously. This indicator allows traders to customize the display of EMAs, making it easier to identify and analyze trends and potential support or resistance levels across different periods.
Settings:
EMA Lengths: Customize up to five EMA lengths. Activating a length will display its EMA line on the chart for the selected timeframes.
Timeframes Selection: Choose up to four different timeframes to display the EMAs. This lets you observe how EMAs behave on various scales from a single chart.
Interpretation:
Utilize the EMAs as potential zones of dynamic support or resistance.
Observe the relationship between price action and EMAs across different timeframes to gauge market sentiment and identify trend consistency or potential shifts.
This tool is designed to offer visual clues about the market state through the behavior of EMAs. It does not generate direct buy or sell signals. It is recommended to understand how the assets you are trading interact with EMAs. For instance, in our example below, Bitcoin demonstrates a tendency to interact with the 800 and 200-length EMAs on the 4-hour timeframe, providing areas where price rejections may occur:
Note: This is a utility-focused indicator meant to supplement your market analysis and should be used in conjunction with other analysis methods or indicators for the best results.
Confluence Buy-Sell Indicator with Fibonacci The script is a "Confluence Indicator with Fibonacci" designed to work on the TradingView platform. This indicator combines multiple technical analysis strategies to generate buy and sell signals based on user-defined confluence criteria. Here's a breakdown of its features:
Confluence Criteria: Users can enable or disable various strategies like MACD, RSI, Bollinger Bands, Divergence, Fibonacci, and Moving Average. The number of strategies that need to align for a signal to be generated can be set by the user.
Strategies Included:
MACD Strategy: Uses the Moving Average Convergence Divergence method to identify buy/sell opportunities.
RSI Strategy: Utilizes the Relative Strength Index to detect overbought or oversold conditions.
Bollinger Bands Strategy: Incorporates Bollinger Bands to identify volatility and potential buy/sell signals.
Divergence Strategy: A basic implementation that detects bullish and bearish divergences using the RSI.
Fibonacci Strategy: Uses Fibonacci retracement levels to determine potential support and resistance levels.
Moving Average Strategy: Employs a crossover system between the 50-period and 200-period simple moving averages.
Additional Features:
Support & Resistance: Identifies major support and resistance levels from the last 50 bars.
Pivot Points: Calculates pivot points to determine potential turning points.
Stop Loss Levels: Automatically calculates and plots stop-loss levels for buy and sell signals.
NYC Midnight Level: Option to display the New York City midnight price level.
Visualization: Plots buy and sell signals on the chart with green and red markers respectively.
Adequate Category:
"Technical Analysis Indicators & Overlays" or "Strategy & Scripting Tools".

MA + MACD alert TrendsThis is a strategy/combination of warning indicators using 6MA+MACD.
The strategy details are as follows: This is a simple warning strategy created so that we don't have to monitor the candlestick chart too often.
Note: This isn't an entry strategy; it's a signaling strategy for upcoming trends. For maximum efficiency, we should incorporate more formulas into the command. In the case below, I use Fibonacci to enter the command.
This strategy setting works for a 15-minute time frame, but it can still work for different time frames.
It has been working well with Gold and USOIL for the last two years, as well as with currency pairs like EURUSD and many others.
Components:
EMA100 + EMA200 + MA400 + MA800
MACD (timeframe greater than 1 timeframe)
Fibonacci retreat.
Uptrend alert:
Candles on both EMAs (100-200) + 2 SMAs (400-800)
In the previous 80 candles:
EMA100 cross up to EMA200
At the same time, the MACD cross up 0.
The uptrend warning will trigger when EMA6 cuts down to MA10. That's when the price creates the top and we'll wait for the market to go back to the Fibonacci threshold of 0.618 and start buying (or wait for markets to break up the trendline to buy).
Downtrend alert:
Candles are below both EMAs ( 100-200 ) + 2 SMAs ( 400-800 )
In the previous 80 candles:
EMA100 cross down to EMA200
At the same time, the MACD cross down zero.
The downtrend warning will trigger when EMA6 cuts to MA10. That's when the price creates a bottom and we'll wait for the market to go back to the Fibonacci threshold of 0.618 and start selling (or wait for the market to break down the trendline to sell).
Recommended RR: 1:1
If you have any questions please let me know!

Buy/Sell BoxThis indicator tries to identify the points where the price exceeds or falls below a rectangle based on the opening and closing prices of the previous period, the creation of the boxes occurs when a doji is detected therefore it will calculate the coordinates of the rectangle that will be drawn around it, therefore the indicator offers buy or sell signals based on this logic. Specifically, the buy signal is generated if the closing price is above the top of the rectangle and satisfies some previous price conditions while the sell signal is generated if the closing price is below the bottom of the rectangle and satisfies some conditions of previous prices within a further threshold based on the Ema 150.
Lines are then drawn on the graph to visually display the extreme price levels, which can be useful for any confirmation of buy and sell signals, Stop Loss and Take Profit, Trend Filter (to visually understand if the trend is bullish or bearish)
A potentially effective trading strategy could involve identifying buy and sell signals near the extreme price level lines drawn by the indicator. This approach can be used to try to improve the accuracy of your trading signals and make more informed decisions. For example:
When you receive a buy or sell signal based on the dojis and rectangles generated by the indicator, check whether the price is also near one of the extreme price level lines. If you are receiving a buy signal and notice that the current price is near a low of the lower level line, this may further confirm the buying opportunity, as the price is near a significant resistance level. On the contrary, if the sell signal was close to a maximum price level it could confirm an excellent short entry.
It is also possible to use the boxes as reference points to set the stop loss and take profit levels. If you are entering a buy position, you might consider setting your stop loss just below an upper line of the last box. Additionally, you may want to set your take profit near a higher price level if you are looking to maximize profits. This will help manage risks and protect your capital.
