SFI Follow Trend Level 1 ( SFI Academy )“SFI Trading Level 1 Indicator is a proprietary indicator used by SFI Academy for its students, in combination with SFI Academy’s exclusive capital management toolset.”
Educational

Kijun Sen Standard Deviation | QuantLapse SystemsOverview
The Kijun Sen Standard Deviation indicator by QuantLapse Systems is a volatility-aware trend-following framework that combines the structural equilibrium of the Kijun Sen (基準線) with statistically adaptive standard deviation bands.
By anchoring trend detection to market structure and confirming direction through volatility expansion, the indicator delivers a cleaner, more reliable regime classification across varying market conditions.
Rather than reacting to short-term noise, the system focuses on identifying statistically justified trend phases , making it well-suited for disciplined, rule-based trading.
Technical Composition, Calculation, Key Components & Features
📌 Kijun Sen (基準線) – Structural Trend Baseline
Calculated as the midpoint between the highest high and lowest low over a user-defined period.
Represents market equilibrium and structural balance rather than short-term momentum.
Naturally adapts to expanding and contracting price ranges.
Provides a stable baseline for regime detection and volatility validation.
Acts as the anchor for deviation bands and persistent trend-state logic.
Unlike fast or reactive moving averages, the Kijun Sen emphasizes price structure and equilibrium , making it especially effective for higher-quality trend confirmation.
📌 Volatility Adjustment – Standard Deviation Bands
Standard deviation is calculated over a configurable lookback to measure current price dispersion.
Upper and lower envelopes are formed by applying a deviation multiplier to the Kijun Sen.
Band width expands during volatility surges and contracts during consolidation.
Creates proportional, volatility-aware thresholds instead of static offsets.
Visually represents market energy through expanding and compressing channels.
These adaptive bands ensure that trend signals only occur when volatility supports directional movement.
📌 Trend Signal & Regime Calculation
Bullish Trend is confirmed when price closes above the upper deviation band.
Bearish Trend is confirmed when price closes below the lower deviation band.
Once established, the trend state persists until an opposing volatility break occurs.
This persistence reduces whipsaws and improves regime stability.
Trend state is reinforced with color-coded lines, envelopes, and background shading.
This volatility-confirmed persistence model is visible in the chart, where trends remain intact through minor pullbacks and only flip on decisive expansion.
How It Works in Trading
✅ Volatility-Confirmed Trend Detection – Requires expansion beyond deviation bands.
✅ Noise Suppression – Filters low-energy price movement within volatility envelopes.
✅ Regime Persistence – Maintains trend state until statistical invalidation.
✅ Immediate Visual Context – Direction, strength, and transitions are clear at a glance.
Visual Representation
Trend signals are displayed directly on price using both line and background context:
🟢 Green / Teal Kijun & Envelope → Confirmed bullish regime.
🔴 Red / Pink Kijun & Envelope → Confirmed bearish regime.
Semi-transparent band fill visualizes volatility expansion and compression.
Buy and Sell labels appear only on confirmed regime transitions.
The lower panel includes:
Strategy equity curve based on trend exposure.
Buy & Hold equity for performance comparison.
Background regime shading synchronized with trend state.
Features and User Inputs
The Kijun Sen Standard Deviation framework offers a focused yet powerful set of configurable inputs:
Kijun Sen Length – Controls structural trend sensitivity.
Standard Deviation Controls – Adjust lookback length and multiplier for regime strictness.
Backtesting & Date Filters – Define evaluation periods and starting conditions.
Display Options – Toggle labels, equity curves, and background shading.
Color Customization – Fully configurable buy/sell colors for trends and equity curves.
These controls allow users to balance responsiveness, stability, and clarity without overfitting.
Practical Applications
The Kijun Sen Standard Deviation indicator is designed for traders who prioritize structure, volatility confirmation, and regime awareness.
Primary Trend Filtering – Identify and stay aligned with dominant market direction.
Volatility-Aware Trend Following – Participate only when price expansion confirms intent.
Risk-Managed Exposure – Avoid chop during compression and transitional phases.
Systematic Strategy Development – Use as a regime engine or higher-timeframe filter.
Performance Evaluation – Compare trend-following equity against buy-and-hold benchmarks.
This framework bridges classical Ichimoku structure with modern statistical validation.
Conclusion
The Kijun Sen Standard Deviation indicator by QuantLapse Systems represents a refined evolution of Ichimoku-based trend analysis.
By integrating the structural equilibrium of the Kijun Sen with adaptive standard deviation confirmation, the system delivers clearer regime classification, reduced noise, and more reliable trend participation.
Rather than attempting to predict price, it focuses on confirming when trends are statistically justified .
Who should use Kijun Sen Standard Deviation:
📊 Trend-Following Traders – Stay aligned with dominant market structure.
⚡ Momentum & Swing Traders – Enter only on volatility-backed expansions.
🤖 Systematic & Algorithmic Traders – Ideal as a regime filter or trend-state engine.
Past performance is not indicative of future results.
Disclaimer: All trading involves risk, and no indicator can guarantee profitability.
Strategic Advice: Always backtest thoroughly, optimize parameters responsibly, and align settings with your timeframe, asset class, and risk tolerance before live deployment.

Long Position (Manual Setup)BINANCE:BTCUSDT
This script is for long position setup manually....
Just enter the following data ......
1. higher entry price
2. lower entry price
3. stop loss price
4. targets ( up to 5 targets)
5- extra targets ( up to 3 extra targets)
then you will have the long position draw in the chart with the trade summary including risk and reward percentage.

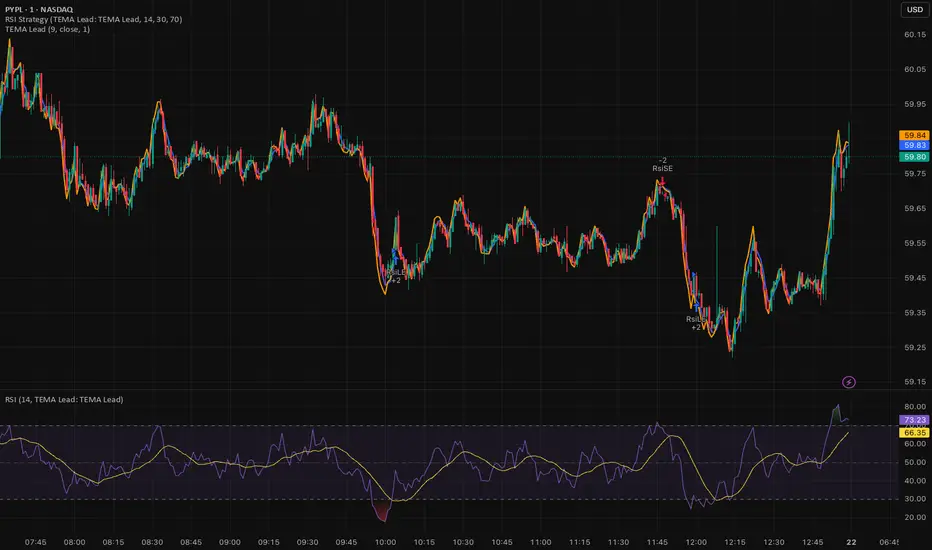
RSI (Any Source) StrategyThis is a simple RSI crossover/crossunder strategy. It calculates RSI on a user-selected Source (default close) using the chosen Length (default 14). It enters a long when RSI crosses up through the Oversold level (default 30), and enters a short when RSI crosses down through the Overbought level (default 70). It does not include explicit exits—each new signal effectively flips/replaces the position via a new entry.

Fundamental Dashboard [Standalone]Overview
The Fundamental Strength Dashboard is a streamlined utility designed to evaluate the fundamental health of a stock directly on your chart. Instead of relying solely on price action, this indicator fetches real-time financial data to assess profitability, valuation, and financial stability.
It aggregates five core financial metrics into a single "Fundamental Score" (0-5) and displays a clear rating (Strong Buy, Buy, Neutral, or Weak/Sell) in a customizable dashboard table.
How It Works
The script analyzes the following 5 Key Fundamental Metrics. For a stock to receive a "point" for a specific metric, it must meet the criteria defined in your settings:
Net Income (Profitability): Checks if the company is actually profitable (Net Income > 0).
EPS (Earnings Per Share): Ensures the company has positive Earnings Per Share (TTM).
P/E Ratio (Valuation): Checks if the stock is valued reasonably compared to your maximum threshold (default: < 45).
Debt-to-Equity (Leverage): Analyzes financial risk. Lower is better (default: < 0.5).
ROE (Efficiency): Measures how effectively management uses equity to generate profit (default: > 15%).
The Scoring System
The indicator calculates a cumulative score based on how many of the above criteria are met:
Score 5/5 → STRONG BUY: The stock meets all profitability, valuation, and stability criteria.
Score 4/5 → BUY: The stock misses only one criterion but is otherwise fundamentally sound.
Score 0-3 → WEAK / SELL: The stock fails multiple fundamental checks (e.g., negative earnings, high debt, or overvaluation).
Features & Customization
Every trader has different risk appetites and sector preferences. You can fully customize the thresholds in the Settings menu:
Max P/E Threshold: Adjust this based on the sector (e.g., Tech stocks typically have higher P/Es than Utilities).
Min ROE %: Set your requirement for management efficiency.
Max Debt/Equity: Tighten or loosen leverage requirements.
Visuals: Change the table position (Top Right, Bottom Right, etc.) and color scheme to match your chart theme.
How to Use
Add the indicator to your chart.
Open the Settings (Gear icon).
Adjust the Dynamic Thresholds to fit the sector you are trading.
Look at the dashboard on the chart to see a snapshot of the stock's fundamental health.
Disclaimer
This script is for educational and informational purposes only. It relies on third-party financial data provided by TradingView, which may occasionally be missing or delayed. Always do your own research (DYOR) before making investment decisions.

Body Close Continuity & failure Backtesting @MaxMaseratiThis indicator, is a highly advanced institutional-grade tool designed to track the "lifespan" of a trend based on Body Close (BC) sequences.
Unlike basic indicators that just show direction, this script analyzes the structural integrity of a trend by monitoring how many candles continue the move before a "Touch" (retest) or a "Break" (failure) occurs.
The Continuity & Failure Stats indicator tracks sequences of Bullish Body Closes (BuBC) and Bearish Body Closes (BeBC). It measures three critical phases: Building (pure momentum), Touching (price retesting the low/high of the sequence), and Resumption (price continuing the trend after a retest). It provides a statistical distribution of how long these "buildings" typically last before failing, allowing traders to know exactly when a trend is overextended.
This comprehensive analysis blends the statistical breakdown of the Continuity & Failure Stats indicator to provide a deep understanding of the structural momentum for the S&P 500 E-mini (ES1!) on a 4-hour timeframe.
1. Extensive Table Breakdown
A. Building Distribution (Left Table): The Fatigue Gauge
This table acts as a histogram of momentum, tracking the "Building Count"—the number of consecutive candles closing in a trend without price returning to its origin.
Count Column: Represents the streak length (e.g., 1, 2, or 3 candles).
Touch Column: Shows how many times a streak was interrupted by a retest ("touch") but remained structurally intact.
Break Column: Counts total structural failures where price closed beyond the sequence's anchor.
Data Insight: For BuBC, 92 sequences reached Count 1, but only 28 remained by Count 4. This reveals a steep momentum decay after the 3rd candle, establishing a "Statistical Wall" where only 2 sequences in history reached a count of 9.
B. MMM Summary Stats (Top Right): The Mathematical DNA
This table provides the "Expected Value" and behavior of a trend over the lookback period.
Avg Building (2.39 for BuBC): On average, a bullish move lasts ~2.4 candles of pure momentum before a retest or reversal occurs.
Avg Touches (0.8): This low number indicates "clean" trends that rarely wobble back to retest levels multiple times before reaching a conclusion.
Avg R Cycles (0.55): This suggests that once a bullish trend is interrupted, it only successfully resumes its momentum about half the time.
Max R Count (1): Typically, once a trend is "touched," it only manages one more push before failing.
C. Multi-Timeframe (MTF) Quick Stats (Bottom Right): Trend Weight
This compares the 4H chart against other layers of the market to identify "global" alignment.
Sample Comparison: There are 3,594 tracked BuBC sequences on the 4H compared to only 142 on the Weekly chart.
Fractal Law: The Avg Building (2.4) is consistent across several timeframes, implying that the "Rule of Three" (momentum fading after 3 candles) is a fractal characteristic of this asset.
2. Table Comparison: Synthesizing the Data
To trade effectively, you must compare Distribution (timing) against Summary Stats (averages):
Continuity vs. Failure: The Summary Stats show an average building of 2.39. When checking the Distribution table at Count 2, the "Break" count (58) is already high relative to the "Total". This confirms that the risk of failure increases exponentially the moment you exceed the average.
Momentum vs. Mean Reversion: Distribution tells you when a trend is "tired". If the 4H is at a "Building Count 4" (statistically overextended) while the Weekly chart is at "Building Count 1" (fresh momentum), you may choose to prioritize the higher timeframe's strength despite the local overextension.
3. Strategic Summary & Application
This indicator proves that market momentum follows a predictable "Building" cycle rather than an infinite streak.
The "Rule of Three" for ES1! 4H:
The Entry Zone (Momentum Start): The most profitable entries occur at Building Count 1. Statistically, you have a high probability of reaching a count of 2 or 3.
The Exit Zone (Momentum Limit): Take profits or tighten stops at Count 3. The data shows the sample size drops by nearly 50% between Count 3 and Count 4.
The "Touch" Rule (Retest Reliability): If price returns to the sequence low (a "Touch"), do not expect a massive continuation. The Max R Count of 1 tells us that resumptions are usually short-lived.
Danger Zone: Entering at Building Count 4 or higher is statistically dangerous, as the "Break" probability significantly outweighs the "Touch" or continuation probability.

Least Squares Moving Average Zero Lag LeadLSMA Zero‑Lag + Lead Indicator
This indicator is a modified Least Squares Moving Average (LSMA) designed to reduce lag and optionally introduce a controlled forward‑leaning (lead) component. It is intended to be used either directly on price or as a smoother, more responsive input source for other indicators such as RSI, MACD, or regime filters.
1. What LSMA Is Doing
LSMA (Least Squares Moving Average) fits a straight‑line regression to the last N bars and evaluates that line at the current bar. Unlike simple or exponential averages, LSMA implicitly models trend direction and slope, which makes it more responsive during directional moves.
2. Zero‑Lag Adjustment
The zero‑lag version applies a simple error‑correction technique:
ZL = 2 × LSMA − LSMA(previous)
This cancels part of the inherent regression delay, producing a smoother line that reacts faster to turns while remaining stable in trends.
3. Lead Component (Optional)
On top of the zero‑lag LSMA, a slope‑based lead is added:
Lead = ZL + k × (ZL − ZL(previous))
Here, the recent slope is projected forward by a user‑controlled factor (k). This does not predict price, but it shifts the average slightly in the direction of current momentum, improving responsiveness for signal generation.
4. Why This Helps RSI and Similar Indicators
RSI and many oscillators operate on raw price changes, which can be noisy and lag‑prone. Feeding RSI with LSMA ZL or LSMA ZL + Lead instead of raw close price:
• Reduces noise without excessive smoothing
• Aligns RSI swings with underlying trend direction
• Improves timing of overbought/oversold transitions
• Reduces late signals after sharp reversals
In practice, this produces an RSI that reacts faster in trends but stays calmer in chop.
5. Practical Usage Tips
• Use LSMA ZL as a clean, low‑lag replacement for price in oscillators
• Add small lead values (0.5–1.0) only if earlier signals are needed
• Avoid high lead values in choppy markets
• Combine with regime or volatility filters for best results
This indicator is best thought of as a signal‑conditioning layer rather than a standalone trading system.

Long Short Trading System With TableSmart Trading System Pro is an advanced TradingView indicator designed for precision and clarity.
It combines Order Blocks, Liquidity Zones, EMA trend alignment, MACD, RSI, Volume, and ATR-based risk management to generate high-quality LONG / SHORT signals.
🔹 Clear trade direction
🔹 Smart entry, stop-loss & multi-level take-profit
🔹 Automatic risk/reward & leverage calculation
🔹 Clean visual dashboard for fast decision-making
Built for traders who value structure, confirmation, and risk control.
Best suited for crypto, forex, and indices on all timeframes.
Disclaimer:
This indicator is for educational and informational purposes only and does not constitute financial advice.
Trading involves risk, and past performance does not guarantee future results.
You are solely responsible for your trading decisions and outcomes.

Aroon (Any Source)Aroon (Any Source)
Overview
This indicator is an enhanced version of the classic Aroon Oscillator. It measures trend dominance based on the recency of highs and lows, with added flexibility to operate on any chosen source series and an optional price-scaling mechanism based on VWAP distance.
What the Indicator Does
The Aroon Oscillator compares how recently the most recent high and low occurred within a lookback window. The result is a bounded oscillator that indicates whether buyers or sellers are currently dominant.
This version adds: - Ability to run Aroon on any source - Optional smoothing to reduce noise - Optional VWAP-based price scaling
Core Outputs
• Aroon Up (0–100): Strength of recent highs
• Aroon Down (0–100): Strength of recent lows
• Aroon Oscillator (−100 to +100): Net dominance (Up − Down)
Inputs and Options
• Source: Input series used for calculations
• Aroon Length: Lookback window
• Use Source for High/Low: Enables Aroon-like mode on any series
• Show Oscillator: Toggles oscillator plot
• Show Aroon Up/Down: Toggles component lines
• Smooth Oscillator: Light smoothing (EMA/RMA/SMA)
• VWAP Price Scaling: Scales signal by VWAP distance normalized by ATR
How to Use It
Use the oscillator as a trend regime filter. Positive values indicate bullish dominance; negative values indicate bearish dominance. VWAP scaling helps suppress signals near equilibrium and emphasize extended moves.
Practical Notes
• Measures recency, not magnitude
• Best used as a regime or bias input
• Especially effective intraday with VWAP scaling

Butterworth LPF Flip + AutoTune (PF)Butterworth LPF Flip + AutoTune (PF)
This strategy trades price trend flips using two Butterworth low-pass filters (a FAST filter and a SLOW filter). A trade is taken when the FAST filter crosses the SLOW filter. Optionally, the script can auto-tune the filter lengths by simulating many Fast/Slow combinations and selecting the pair with the best Profit Factor (PF).
What the Script Does
- Computes two 2‑pole Butterworth low‑pass filters on price.
- Enters LONG when FAST crosses above SLOW.
- Enters SHORT when FAST crosses below SLOW.
- Optionally simulates many Fast/Slow length combinations internally.
- Chooses the Fast/Slow pair with the highest Profit Factor.
- Trades only the selected best pair.
Manual Mode (Default)
1. Leave Auto‑Tune OFF.
2. Set:
- FAST cutoff period (bars)
- SLOW cutoff period (bars)
3. The strategy will trade using only these values.
Use this mode for normal trading or live deployment.
Auto‑Tune Mode
1. Enable Auto‑Tune.
2. Define Fast and Slow ranges:
- FAST min / max / step
- SLOW min / max / step
3. The script simulates ALL Fast × Slow combinations bar‑by‑bar.
4. Each combination tracks:
- Gross Profit
- Gross Loss
- Closed trades
- Profit Factor (PF = GP / GL)
5. At the end of the chart, the best PF pair is selected and used for trading.
Interpreting the End Box
The status label at the end of the chart reports:
- Whether Auto‑Tune is enabled
- Number of candidate pairs tested
- Best FAST period
- Best SLOW period
- Profit Factor of the best pair
- Win Rate (wins ÷ closed trades)
If PF is near 1.0 or trades are very low, expand the range or length of the test.
Best Practices
- Use Auto‑Tune ONLY for research and optimization.
- After finding good parameters, disable Auto‑Tune and trade manually.
- Keep Fast < Slow (logical separation).
- Longer charts produce more reliable PF results.
- Avoid very small step sizes (performance + noise).
Known Limitations
- Pine Script runs bar‑by‑bar; tuning is approximate, not vectorized.
- Large grids increase execution time.
- Results are historical and NOT predictive.
- Not suitable for live auto‑optimization.
Summary
This script is best viewed as a *research tool first, strategy second*. Use it to discover stable Fast/Slow regimes, then lock them in for simple, repeatable trading.

Triple EMA (TEMA) + Slope LeadThis indicator plots a standard Triple EMA (TEMA) and an optional slope-lead version. TEMA is a low-lag moving average built from three EMAs, allowing it to track price more closely than a single EMA. The Lead Strength (k) adds a small forward “push” based on the recent TEMA slope:
TEMA_lead = TEMA + k × (TEMA − TEMA ). Higher k values make the line react earlier but increase sensitivity in chop.
Used as a source for other indicators (RSI, MACD, stochastic, regime filters, etc.), TEMA or TEMA-Lead may improve signal quality by reducing noise, aligning momentum readings with trend direction, and producing earlier, cleaner transitions at turns, often without the excessive lag introduced by heavier smoothing.
RSI Strategy with Auto Tuner (PF)# RSI Auto‑Tuner Strategy — How To Use
This document explains **how to use** the RSI Auto‑Tuner strategy. It intentionally avoids math and implementation details. Follow this as an operating guide.
---
## 1. What This Tool Is For
This strategy helps you:
* Discover **which RSI length works best** on a given ticker and timeframe
* Measure performance using **Profit Factor (PF)**
* Improve RSI performance on noisy markets by **transforming price first**
The auto‑tuner is a **research tool**, not a live trading signal generator.
---
## 2. Two Modes You Must Treat Differently
### Research Mode
Used to explore and discover parameters.
* Auto‑Tune: **ON**
* Parameters are allowed to change
* Results may look very good
* Overfitting risk is real
### Trading Mode
Used for forward testing or live trading.
* Auto‑Tune: **OFF**
* Parameters are fixed
* Behavior is stable and repeatable
* This is the only acceptable mode for live use
**Never trade live with Auto‑Tune enabled.**
---
## 3. Manual Mode (Trading Mode)
Use this after parameters are finalized.
Steps:
1. Set **Auto‑Tune = OFF**
2. Choose:
* Source (raw price or transformed price)
* RSI Length (manual, default 14)
* Oversold / Overbought levels
3. The strategy will:
* Enter long when RSI crosses up through Oversold
* Enter short when RSI crosses down through Overbought
* Flip positions on opposite signals
This mode is predictable and safe for forward testing.
---
## 4. Auto‑Tune Mode (Research Mode)
Use this to find optimal RSI lengths.
Steps:
1. Set **Auto‑Tune = ON**
2. Configure the search range:
* Minimum Length (default 5)
* Maximum Length (default 14)
* Step Size (default 1)
3. The strategy will:
* Internally simulate trades for each RSI length
* Track gross profit, gross loss, and trades
* Select the length with the highest Profit Factor
4. The best length is applied automatically
Auto‑Tune evaluates historical data only.
---
## 5. Using a Transform on Price (Critical)
RSI does **not** have to run on raw price.
You can significantly improve results by:
* Applying a **price transform** first
* Feeding the transformed series into the RSI Source input
Examples of transforms:
* Moving averages
* Low‑pass filters
* Butterworth filters
* Any smoother or denoiser
Why this works:
* Busy, wicky markets cause RSI to whipsaw
* Transforms remove micro‑noise
* RSI responds to structure instead of chaos
* Profit Factor often increases dramatically
Best practice:
* Auto‑tune on raw price
* Auto‑tune on transformed price
* Compare PF, trade count, and stability
---
## 6. Reading the Status Label
At the last bar, the on‑chart label shows:
* Whether Auto‑Tune is ON or OFF
* Whether candidates were built successfully
* Number of RSI lengths tested
* Best RSI length found
* Profit Factor and trade count
If Auto‑Tune is OFF, the label shows the manual length.
---
## 7. Recommended Workflow
1. Choose ticker and timeframe
2. Enable Auto‑Tune on **raw price**
3. Record best RSI length and PF
4. Enable Auto‑Tune on **transformed price**
5. Compare results
6. Lock parameters
7. Disable Auto‑Tune
8. Forward test
---
## 8. Warnings and Discipline
* High PF with few trades is unreliable
* Transforms can hide execution costs
* Always validate on a different period
* Auto‑Tune is a **lens**, not an edge
Treat this tool as a research microscope, not an autopilot.

Michael Mor - ATRMichael Mor -ATR is a clean, lightweight chart watermark that gives you key stock context at a glance — without cluttering your chart or covering price action.
It’s designed for traders who want essential fundamentals + recent performance visible directly on the chart, in a subtle, professional style.
What it shows
You can toggle each line on or off:
Company name (optional market cap: M / B / T)
Symbol & timeframe
Sector & industry
ATR (14) with percentage of price and a quick volatility indicator
🟢 low volatility
🟡 medium volatility
🔴 high volatility

Udta Teer MKCIts normal vwap which is already available in TradingView. Now we have modified it with help of AI for bands

Ram Key Levels (Daily Horizontals) + Day SeparatorsRam Key Levels (Daily Horizontals) + Day Separators

Trinity Swing Trading Buy and SellThis is a simple little Heiken Ashi MA + ADX & MACD trend-following trading system designed to capture medium- to longer-term moves while filtering out noise and weak trends. It combines modified Heiken Ashi candles (for smoother trend detection) with a moving average alignment, plus optional confirmation from ADX (trend strength) and MACD (momentum).
In practice, the indicator works well on higher timeframes (e.g., 1H, 4H, daily) where trends are more sustained. It performs best in trending markets and naturally avoids choppy/range-bound conditions thanks to the ADX filter (requiring ADX > 20 by default). All key components are fully customizable, so you can disable filters or adjust parameters to suit different instruments (stocks, forex, crypto, futures).
Default settings are:
16 HMA
8,17,9 MACD
15,20 ADX
Recommend to add an additional longer term EMA like 200 for long term trend confirmation.
Adjust inputs in the settings panel as needed:
Toggle MA, ADX, or MACD filters on/off.
Change MA type/length, MACD parameters, ADX threshold
- Use the visual blue diamonds (below bars) for long entries and purple diamonds (above bars) for short entries as confirmation of signals.
- Set alerts on the "Buy Alert" and "Sell Alert" conditions if you want real-time notifications.
This setup gives you a complete, rule-based system that avoids emotional trading and repetitive entries, making it suitable for both backtesting and live trading with proper risk management.

Udta Teer Its normal vwap which is already available in tradingview. But it has added bands with help of AI

ODR BoxThis indicator automates the Opening Range Definition (ODR) based on the Ali Khan / ICT Model 1 framework. By capturing the 07:00-09:25 AM Dealing Range, it projects institutional quadrants and standard deviation targets. It is designed to filter out 'retail noise' and highlight the mathematical levels where price delivery is most likely to accelerate or reverse.

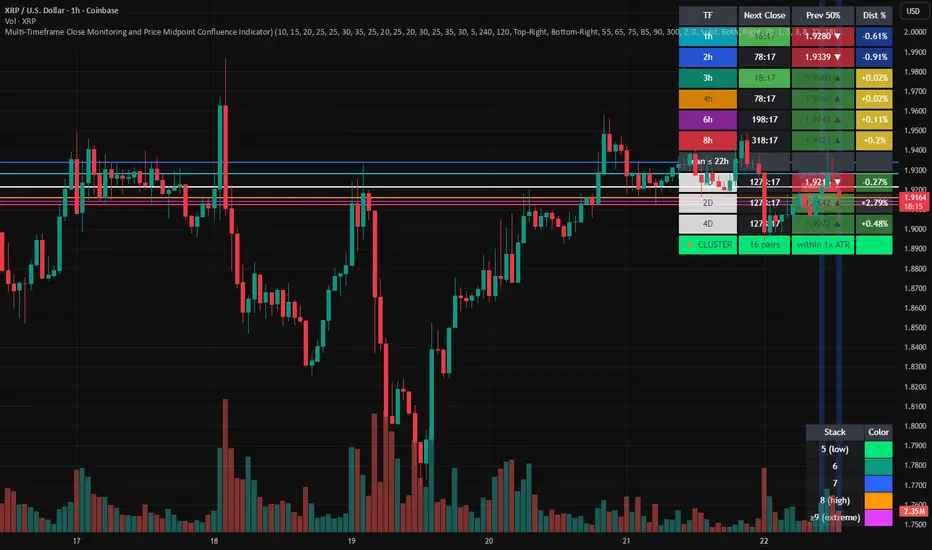
Multi-Timeframe Close and Midpoint ConfluenceMulti-Timeframe Close Monitoring and Price Midpoint Confluence Indicator
This indicator is designed to assist traders in monitoring multiple timeframe candle closes and identifying areas where price midpoints (50% levels) from different timeframes cluster together.
The tool focuses on timing awareness and structural context, helping users observe periods where multiple timeframe events occur close together, which may coincide with increased market activity.
What the Indicator Tracks
The indicator monitors candle close timing and price context across multiple timeframes, including:
Intraday timeframe closes (30m, 1h, 2h, 3h, 4h, 6h, 8h)
Higher-timeframe closes (Daily, Weekly, Monthly) when within a defined scan window
The midpoint (50%) of the previous candle for each tracked timeframe
The distance between current price and each midpoint level
This information is evaluated independently for each timeframe.
Timeframe Close Confluence
When multiple timeframes are approaching a candle close within a short window, the indicator highlights this period visually.
These moments can be useful for observing potential shifts in activity or volatility, particularly when combined with other forms of analysis.
Visual markers and optional alerts are used to draw attention to these timing clusters.
Midpoint (50%) Level Clustering
The indicator also evaluates whether multiple 50% levels from different timeframes are located within a user-defined proximity.
When several midpoints cluster closely together, the area is highlighted as a zone of interest for further observation, as overlapping price references may act as areas of interaction.
Countdown & Information Panel
An optional on-chart panel displays:
A live countdown to upcoming timeframe closes
Relative urgency based on proximity to each close
Whether current price is above or below each midpoint
Distance metrics to help gauge proximity
Color coding is used to improve readability rather than indicate trade direction.
Visual Context Tools
Additional visual options include:
Background shading when multiple timing or midpoint conditions overlap
Adjustable thresholds to control sensitivity
Customizable colors, opacity, and panel placement
These visuals are intended to provide contextual awareness, not trade signals.
Intended Use
Style: Multi-timeframe analysis and timing awareness
Markets: Forex, crypto, equities, futures
Purpose:
Monitor upcoming timeframe closes
Observe overlapping price reference zones
Improve preparation around potential activity windows
The indicator is best used as a supplementary tool alongside independent analysis.
Important Notes
This script is provided for educational and analytical purposes only.
It does not predict market outcomes and should not be used as a standalone decision-making tool. Users are encouraged to apply appropriate risk controls and confirm observations with additional analysis.
BHUVANA Fib 50/61.8 Stairs with RR Targets Fib 50–61.8 Stairs with RR Targets (debug) automatically tracks the latest swing and draws a 50%–61.8% Fibonacci pullback zone as step-like “stairs.” From that zone it plots a planned trade framework: entry reference, stop/invalidation, and multiple Risk:Reward targets (e.g., 1R/1.5R/2R/3R).
What it’s for
Visualize the “buy/sell pullback” area (50–61.8) in trending moves
Standardize exits with RR targets instead of guessing
Quickly see when the swing/zone updates as structure changes
How to use (simple)
Wait for a clear impulse swing to form.
Let price retrace into the 50–61.8 zone.
Take entries only with your own trigger (reclaim / rejection / BOS).
Use the plotted stop and RR targets for management.
Inputs
Swing detection / lookback
RR multiples and target count
Show/hide stairs, labels, debug visuals
Important
This is a mapping tool, not a standalone signal. If you trade every touch of 50–61.8 without confirmation, you’ll get chopped. Debug version may show extra visuals and can repaint on swing updates. Not financial advice.

Weekly Bullish Engulfing ScreenerThis is a weekly Bullish engulfing screener to find the stocks ready to breakout

Jim Kombein Ph.D. Core Engine (Invite-Only)This invite-only script is a research-oriented framework for analyzing market structure and price dynamics.
It is intended solely for educational and informational use.
No trading advice, buy/sell recommendations, or profit guarantees are provided.
All decisions and associated risks remain the sole responsibility of the user.

Quant_DCA**Quant_DCA - Smart Dollar-Cost Averaging with Dynamic Position Sizing**
Designed for SPY,QQQ,BTC
Transform your DCA strategy with intelligent dip-buying. Instead of buying a fixed amount every week, Quant_DCA identifies quality dips and scales position sizes dynamically - buying more during significant corrections.
**✨ KEY FEATURES**
• 4% Minimum Threshold - Quality dips only, eliminates noise
• Volume Confirmation - Requires 2x average volume spike
• Volatility Confirmation - ATR and StdDev elevation required
• 9-Tier Multiplier System - 1x to 20x based on dip severity
• Conservative Risk - Max 20x multiplier, not extreme
• Capital Efficient - Deploys ~60% of DCA capital, not 2-3x more
• Real-Time Comparison - See DCA vs Quant performance live
• Color-Coded Signals - Visual strength indicators
• Smart Alerts - Detailed execution instructions
**💰 POSITION SIZING**
4% dip → 1.0x
7.5% dip → 2.0x
10% dip → 2.8x
17% dip → 5.5x
28% dip → 10.5x
35% dip → 15.0x
Max → 20.0x
**📈 EXPECTED RESULTS (Realistic)**
Based on QQQ 4H, 2022-2024 backtest:
✅ +10-20% share advantage vs DCA
✅ 15-20% better average cost
✅ ~60% capital deployment (similar to DCA)
✅ 30-45 quality signals per year
✅ +15-30% ROI advantage over 5-10 years
**💡 CAPITAL REQUIREMENTS**
**⚙️ QUICK START**
1. Add to QQQ 4H chart (optimized timeframe)
2. Keep default settings (pre-optimized)
3. Backtest from 2022-01-01 to present
4. Verify 10-20% share advantage shown
5. Create alerts for buy signals
6. Start with 50% position size
7. Execute ALL signals for 3 months
8. Scale to 100% after confidence built
**🎯 WHO IS THIS FOR**
✅ Long-term investors (5+ year horizon)
✅ Accounts $25k+ (preferably $50k+)
✅ Those wanting better DCA results
✅ Disciplined traders who execute all signals
✅ Comfortable buying during crashes
✅ SPY/QQQ/GLD/BTC or any Index that always goes up over the long period of time
❌ NOT for: Day traders
**⚠️ IMPORTANT DISCLAIMERS**
• works best in volatile conditions
• Requires 75%+ signal execution to achieve results
• Need liquid reserves (5x max buy) ready at all times
• Some years will lag DCA (wins over full market cycles)
• Past performance does not guarantee future results
• This is NOT financial advice - educational purposes only
• Always do your own research and consult a financial advisor
**🔧 SETTINGS**
Pre-optimized for QQQ 4H timeframe. All settings are customizable:
Dip Detection:
• Min Dip: 4.0% (adjustable 1-10%)
• Lookback: 10 bars
• Fast EMA: 20 / Slow EMA: 50
• Volume: 2.0x threshold
• Volatility: 1.5x threshold
Multipliers:
• 9 customizable tiers
• Conservative 1-20x range
• Exponential scaling
Strategy:
• Base: $1,000 (match your DCA)
• DCA Frequency: Weekly
• Start Date: Any backtest period
**📊 RESULTS TABLE**
Real-time metrics displayed:
• Portfolio values (DCA vs Quant)
• ROI percentages
• Capital deployed (with ratio)
• Share counts (with advantage %)
• Average cost per share
• Buy frequency and averages
• Winner declaration
**💡 PRO TIPS**
1. Execute within 1 hour of signal
2. Keep 5x max buy in liquid reserves
3. Don't skip signals - even small dips matter
4. Track actual vs backtest monthly
5. Think long-term (5-10 years)
6. Accept that some years lag DCA
7. Start conservative (50% size)
8. Build to 100% over time
**🎓 WHY THIS WORKS**
Academic research shows buying dips beats random timing over long periods:
• Price advantage from buying declines
• Psychological edge (buy fear)
• Mean reversion tendency
• Volume spikes mark capitulation
• Volatility premium rewards patience
Quant_DCA systematizes this with objective rules, quality filters, and conservative position sizing.
**📝 VERSION INFO**
Version: 1.0 - Balanced Edition
License: Mozilla Public License 2.0
Author: Sahebson
Optimized For: QQQ 4H timeframe
**💬 FEEDBACK WELCOME**
Share your backtest results or real-world performance in the comments! Questions? Ask below.
Like this indicator? Give it a boost! 👍
Have suggestions? Comment! 💬
---
*Disclaimer: This indicator is for educational purposes only and does not constitute financial advice. Trading involves risk of loss. Past performance does not guarantee future results. Always do your own research and consult with a qualified financial advisor before making investment decisions. The author is not responsible for any trading losses incurred using this indicator.*
---
**Tags:** #DCA #SmartInvesting #DipBuying #QQQ #LongTerm #PositionSizing #RiskManagement #TradingStrategy
