Google Trends: Dogecoin (Cryptollica) Google Trends: Dogecoin (Cryptollica) 2013-2026 Keyword: DogecoinPine Script® Indikatorvon Cryptollica2240
EMA Color Flip Strategy + ATR Risk BoxesEMA ColorFlip Strategy A trend-following strategy that captures EMA color flips for high-probability intraday setups on Ethereum (ETH), Solana (SOL), and Dogecoin (DOGE). Uses ATR-based dynamic risk boxes to define precise entry zones, stop losses, and profit targets with asymmetric risk-reward. The approach focuses on clean trend shifts across multiple timeframes, filtering for sustained momentum moves while maintaining tight risk control. Designed for futures and crypto trading with consistent position sizing. Happy New Year! The strategy is off to a strong start in 2026 - here's to continued performance throughout the year! 🚀📈 Pine Script® Strategievon CoinCaveIdeas0
ALT Risk Metric StrategyHere's a professional write-up for your ALT Risk Strategy script: ALT/BTC Risk Strategy - Multi-Crypto DCA with Bitcoin Correlation Analysis Overview This strategy uses Bitcoin correlation as a risk indicator to time entries and exits for altcoins. By analyzing how your chosen altcoin performs relative to Bitcoin, the strategy identifies optimal accumulation periods (when alt/BTC is oversold) and profit-taking opportunities (when alt/BTC is overbought). Perfect for traders who want to outperform Bitcoin by strategically timing altcoin positions. Key Innovation: Why Alt/BTC Matters Most traders focus solely on USD price, but Alt/BTC ratios reveal true altcoin strength: When Alt/BTC is low → Altcoin is undervalued relative to Bitcoin (buy opportunity) When Alt/BTC is high → Altcoin has outperformed Bitcoin (take profits) This approach captures the rotation between BTC and alts that drives crypto cycles Key Features 📊 Advanced Technical Analysis RSI (60% weight): Primary momentum indicator on weekly timeframe Long-term MA Deviation (35% weight): Measures distance from 150-period baseline MACD (5% weight): Minor confirmation signal EMA Smoothing: Filters noise while maintaining responsiveness All calculations performed on Alt/BTC pairs for superior market timing 💰 3-Tier DCA System Level 1 (Risk ≤ 70): Conservative entry, base allocation Level 2 (Risk ≤ 50): Increased allocation, strong opportunity Level 3 (Risk ≤ 30): Maximum allocation, extreme undervaluation Continuous buying: Executes every bar while below threshold for true DCA behavior Cumulative sizing: L3 triggers = L1 + L2 + L3 amounts combined 📈 Smart Profit Management Sequential selling: Must complete L1 before L2, L2 before L3 Percentage-based exits: Sell portions of position, not fixed amounts Auto-reset on re-entry: New buy signals reset sell progression Prevents premature full exits during volatile conditions 🤖 3Commas Automation Pre-configured JSON webhooks for Custom Signal Bots Multi-exchange support: Binance, Coinbase, Kraken, Bitfinex, Bybit Flexible quote currency: USD, USDT, or BUSD Dynamic order sizing: Automatically adjusts to your tier thresholds Full webhook documentation compliance 🎨 Multi-Asset Support Pre-configured for popular altcoins: ETH (Ethereum) SOL (Solana) ADA (Cardano) LINK (Chainlink) UNI (Uniswap) XRP (Ripple) DOGE RENDER Custom option for any other crypto How It Works Risk Metric Calculation (0-100 scale): Fetches weekly Alt/BTC price data for stability Calculates RSI, MACD, and deviation from 150-period MA Normalizes MACD to 0-100 range using 500-bar lookback Combines weighted components: (MACD × 0.05) + (RSI × 0.60) + (Deviation × 0.35) Applies 5-period EMA smoothing for cleaner signals Color-Coded Risk Zones: Green (0-30): Extreme buying opportunity - Alt heavily oversold vs BTC Lime/Yellow (30-70): Accumulation range - favorable risk/reward Orange (70-85): Caution zone - consider taking initial profits Red/Maroon (85-100+): Euphoria zone - aggressive profit-taking Entry Logic: Buys execute every candle when risk is below threshold As risk decreases, position sizing automatically scales up Example: If risk drops from 60→25, you'll be buying at L1 rate until it hits 50, then L2 rate, then L3 rate Exit Logic: Sells only trigger when in profit AND risk exceeds thresholds Sequential execution ensures partial profit-taking If new buy signal occurs before all sells complete, sell levels reset to L1 Configuration Guide Choosing Your Altcoin: Select crypto from dropdown (or use CUSTOM for unlisted coins) Pick your exchange Choose quote currency (USD, USDT, BUSD) Risk Metric Tuning: Long Term MA (default 150): Higher = more extreme signals, Lower = more frequent RSI Length (default 10): Lower = more volatile, Higher = smoother Smoothing (default 5): Increase for less noise, decrease for faster reaction Buy Settings (Aggressive DCA Example): L1 Threshold: 70 | Amount: $5 L2 Threshold: 50 | Amount: $6 L3 Threshold: 30 | Amount: $7 Total L3 buy = $18 per candle when deeply oversold Sell Settings (Balanced Exit Example): L1: 70 threshold, 25% position L2: 85 threshold, 35% position L3: 100 threshold, 40% position (final exit) 3Commas Setup Bot Configuration: Create Custom Signal Bot in 3Commas Set trading pair to your altcoin/USD (e.g., ETH/USD, SOL/USDT) Order size: Select "Send in webhook, quote" to use strategy's dollar amounts Copy Bot UUID and Secret Token Script Configuration: Paste credentials into 3Commas section inputs Check "Enable 3Commas Alerts" Save and apply to chart TradingView Alert: Create Alert → Condition: "alert() function calls only" Webhook URL: api.3commas.io Enable "Webhook URL" checkbox Expiration: Open-ended Strategy Advantages ✅ Outperform Bitcoin: Designed specifically to beat BTC by timing alt rotations ✅ Capture Alt Seasons: Automatically accumulates when alts lag, sells when they pump ✅ Risk-Adjusted Sizing: Buys more when cheaper (better risk/reward) ✅ Emotional Discipline: Systematic approach removes fear and FOMO ✅ Multi-Asset: Run same strategy across multiple altcoins simultaneously ✅ Proven Indicators: Combines RSI, MACD, and MA deviation - battle-tested tools Backtesting Insights Optimal Timeframes: Daily chart: Best for backtesting and signal generation Weekly data is fetched internally regardless of display timeframe Historical Performance Characteristics: Accumulates heavily during bear markets and BTC dominance periods Captures explosive altcoin rallies when BTC stagnates Sequential selling preserves capital during extended downtrends Works best on established altcoins with multi-year history Risk Considerations: Requires capital reserves for extended accumulation periods Some altcoins may never recover if fundamentals deteriorate Past correlation patterns may not predict future performance Always size positions according to personal risk tolerance Visual Interface Indicator Panel Displays: Dynamic color line: Green→Lime→Yellow→Orange→Red as risk increases Horizontal threshold lines: Dashed lines mark your buy/sell levels Entry/Exit labels: Green labels for buys, Orange/Red/Maroon for sells Real-time risk value: Numerical display on price scale Customization: All threshold lines are adjustable via inputs Color scheme clearly differentiates buy zones (green spectrum) from sell zones (red spectrum) Line weights emphasize most extreme thresholds (L3 buy and L3 sell) Strategy Philosophy This strategy is built on the principle that altcoins move in cycles relative to Bitcoin. During Bitcoin rallies, alts often bleed against BTC (high sell, accumulate). When Bitcoin consolidates, alts pump (take profits). By measuring risk on the Alt/BTC chart instead of USD price, we time these rotations with precision. The 3-tier system ensures you're always averaging in at better prices and scaling out at better prices, maximizing your Bitcoin-denominated returns. Advanced Tips Multi-Bot Strategy: Run this on 5-10 different altcoins simultaneously to: Diversify correlation risk Capture whichever alt is pumping Smooth equity curve through rotation Pairing with BTC Strategy: Use alongside the BTC DCA Risk Strategy for complete portfolio coverage: BTC strategy for core holdings ALT strategies for alpha generation Rebalance between them based on BTC dominance Threshold Calibration: Check 2-3 years of historical data for your chosen alt Note where risk metric sat during major bottoms (set buy thresholds) Note where it peaked during euphoria (set sell thresholds) Adjust for your risk tolerance and holding period Credits Strategy Development & 3Commas Integration: Claude AI (Anthropic) Technical Analysis Framework: RSI, MACD, Moving Average theory Implementation: pommesUNDwurst Disclaimer This strategy is for educational purposes only. Cryptocurrency trading involves substantial risk of loss. Altcoins are especially volatile and many fail completely. The strategy assumes liquid markets and reliable Alt/BTC price data. Always do your own research, understand the fundamentals of any asset you trade, and never risk more than you can afford to lose. Past performance does not guarantee future results. The authors are not financial advisors and assume no liability for trading decisions. Additional Warning: Using leverage or trading illiquid altcoins amplifies risk significantly. This strategy is designed for spot trading of established cryptocurrencies with deep liquidity. Tags: Altcoin, Alt/BTC, DCA, Risk Metric, Dollar Cost Averaging, 3Commas, ETH, SOL, Crypto Rotation, Bitcoin Correlation, Automated Trading, Alt Season Feel free to modify any sections to better match your style or add specific backtesting results you've observed! 🚀Claude is AI and can make mistakes. Please double-check responses. Sonnet 4.5Pine Script® Strategievon nakphananAktualisiert 30
NEESON Plus Crypto Market Sentiment IndicatorCore Features 1. Multi-Factor Sentiment Scoring System Comprehensive Algorithm: Combines 6 different market indicators Weighted Scoring: Each factor contributes with different weights Real-time Calculation: Updates with every new bar Smoothing Mechanism: Triple EMA smoothing for stable signals 2. Advanced Technical Indicators Integration Multi-Timeframe RSI: 1H, 4H, and Daily RSI analysis Volume Analysis: Volume spikes and decline detection ATR Volatility: Market volatility assessment MACD Momentum: Trend momentum confirmation Bollinger Bands: Price position analysis 3. Proprietary Indicator Calculations AHR999 Proxy: Enhanced version for crypto markets Puell Multiple Proxy: Dynamic calculation with RSI adjustment PI Cycle Top: Multi-moving average cycle analysis CBBI Enhanced: Crypto Bull Bear Index with momentum Market Volatility Sentiment: Volatility-based sentiment scoring Volume Sentiment: Volume-based market sentiment Signal Generation System 4. Multi-Condition Signal Filters Strong Buy/Sell Signals: Multiple confirmation requirements Warning Signals: Early entry/exit indications Confirmation Bars: User-configurable signal confirmation Trend Filter: Optional trend alignment requirement Volume Filter: Volume spike confirmation Volatility Filter: ATR-based market condition filtering Momentum Filter: MACD momentum confirmation 5. Advanced Signal Management Signal State Tracking: Maintains current position state Duration Tracking: Tracks how long signals have been active Entry Score Recording: Records sentiment score at entry Consecutive Signal Counting: Prevents signal flipping Exit Conditions: Multiple exit criteria for risk management Visualization Features 6. Professional Chart Display Dual Score Plotting: Comprehensive and raw sentiment scores Color-Coded Background: Real-time market sentiment coloring Threshold Lines: Clear visual reference levels Area Fills: Colored zones for different sentiment levels Signal Markers: Visual indicators for buy/sell signals 7. Information Panel Real-time Data Display: Current scores and signals Position Tracking: Duration and entry information Performance Metrics: Floating P/L calculation Market Status: RSI, Volume, Volatility, MACD status Configuration Status: Current filter settings Customization Options 8. User-Configurable Parameters Threshold Settings: Adjustable buy/sell/exit levels Filter Toggles: Enable/disable various filters Indicator Periods: Customizable calculation periods Color Settings: Fully customizable color scheme Signal Duration: Minimum signal duration requirements 9. Alert System Strong Buy/Sell Alerts: Immediate notification for strong signals Warning Alerts: Early signal notifications Custom Alert Messages: Clear, descriptive alert texts Multiple Timeframe Compatibility: Works across all timeframes Risk Management Features 10. Built-in Protection Mechanisms Signal Confirmation: Prevents false signals Exit Triggers: Multiple exit conditions Position Duration Limits: Automatic exit after prolonged periods Profit/Loss Tracking: Real-time performance monitoring Volatility Adjustment: Adapts to market conditions Technical Specifications 11. Performance Optimization Efficient Calculation: Optimized for real-time performance Multi-Timeframe Support: Works on all chart timeframes Resource Management: Controlled line and label counts Precision Control: Adjustable decimal precision 12. Compatibility Cryptocurrency Focus: Specifically designed for crypto markets Multi-Asset Support: Works with all TradingView symbols Platform Compatibility: Fully compatible with TradingView platform Mobile Support: Responsive design for mobile devices Usage Benefits Comprehensive Analysis: Single indicator providing multiple insights Clear Signals: Easy-to-understand buy/sell indications Customizable: Adaptable to different trading styles Risk-Aware: Built-in risk management features Professional Grade: Institutional-level analysis tools User-Friendly: Intuitive visual interface Educational: Helps understand market sentiment dynamics This indicator is designed to provide traders with a comprehensive market sentiment analysis tool specifically optimized for cryptocurrency markets, combining traditional technical analysis with crypto-specific metrics.Pine Script® Indikatorvon neeson198711
Big Whale Purchases and SalesBig Whale Purchases and Sales - plots big whale transactions on your chart! People that hold more than 1% of a crypto currencies circulating supply are considered whales and have a huge influence on price, not just because they can move the market with their huge transactions, but also because other traders often track their wallets and follow their example. Taking a look at whale holdings, one can see why whale worship is so common in crypto: While Bitcoin has a relatively low whale concentration, many of the Top 100 Cryptocurrencies have whales control 60% or more of their circulating supply. Integrating IntoTheBlock data, this script plots the transactions of these whales and, in strategy mode, copy trades them. Features: Strategy Mode: Switches the script between an indicator and a strategy. Standard Deviations: The number of Standard Deviations that a transaction needs to surpass to be considered worth plotting. Setting this to 0 will show all whale transactions, higher settings will only show the biggest transactions. Blockchain: The Chain on which Whale activity is tracked.Pine Script® Strategievon PowerscooterAktualisiert 66832
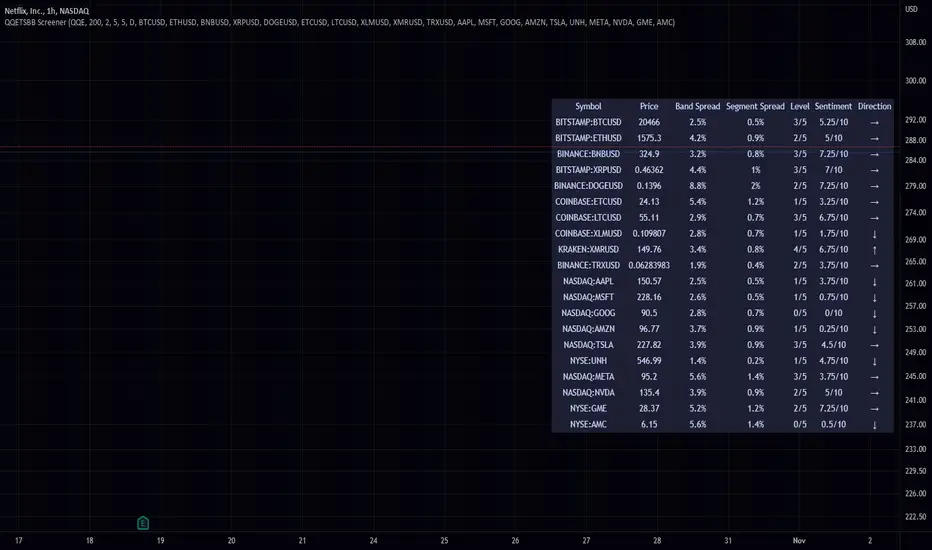
QQE Student's T-Distribution Bollinger Bands ScreenerThis script scans 20 custom symbols and displays the QQE Students T-Distribution Bollinger Bandwidth as a percentage, the quarter segment percentage, a score that tells you what segment of the band the price is in, and what direction the market is going in. This is useful because it can tell you how volatile a market is and how much reward is in the market. It also tells you what direction the market is going in so you can pick a symbol that has the best looking reward. I really hope that this script complements the group of indicators I have made so far. Here is a list of the other two indicators related to this script. Please enjoy!Pine Script® Indikatorvon The_Peaceful_LizardAktualisiert 3376
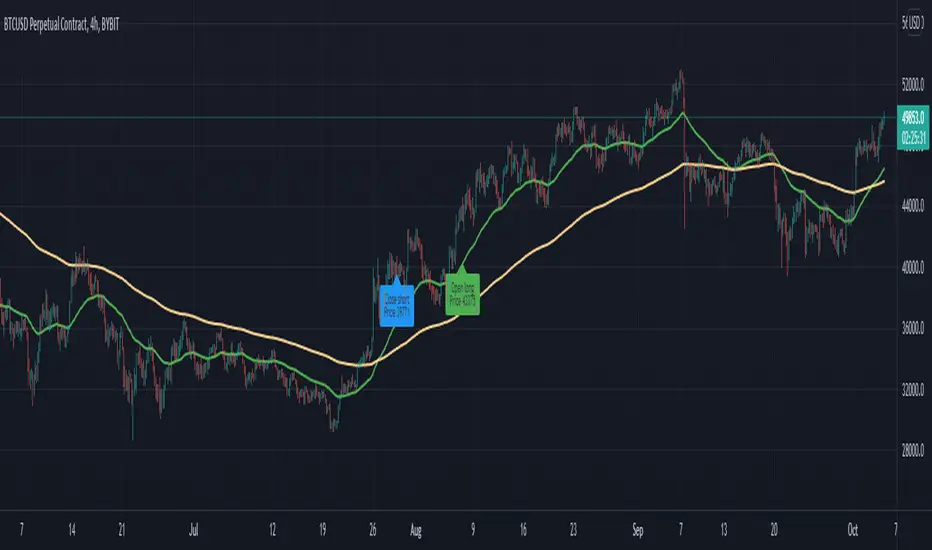
EMASAR Investor ModePLEASE READ THE FULL DESCRIPTION BEFORE BUYING OR USING THIS INDICATOR THIS IS THE INVESTOR MODE ONLY VERSION OF THE EMASAR INDICATOR. IT INCLUDES THE ORIGINAL SIGNALS TELLING YOU WHEN TO BUY OR SELL. IT ONLY INCLUDES THE OCEAN TO INDICATE PULLBACKS AND NOT OTHER TRADING REGIONS ARE INCLUDED. IT SHOWS THE BUY/SELL SIGNALS AS WAS PUBLISHED IN THE ORIGINAL VERSION OF EMASAR EMASAR (pronounced Emma-sar) is a strategy based on Exponential Moving Averages and the Parabolic SAR. This is a position trading approach that is derived from Tyler Jenks’ Consensio. This strategy was developed with four objectives in mind: (1) managing risk (2) protecting from missing out on major moves (3) maximizing risk:reward (4) staying in a trending market and taking profit before it fully reverses. EMASAR does a great job at accomplishing all of the above through the buy and sell signals that are generated. The data provided below is from the signals that occurred on Bitcoin ( Bitstamp ) from January 1, 2015 to present (November 11, 2019). (1) Risk is tightly managed, relative to the winners, and losing positions will be exited before the market moves too far against. The biggest losing trade on Bitcoin , for the time period outlined above, is -18.47%. (2) Following the EMASAR buy and sell signals guarantees that one will not miss out on a major trend. As a result of the indicators used for this system it is mathematically impossible for a major trend to occur without providing a buy or sell signal. This system isn't meant to catch exact tops or bottoms but it will do a great job of capturing ~85% of a trend. (3) On average the winning trades will be 5.55 times the losing trades. There will be stretches where the losers are bigger than the winners and this could last for many months, maybe even a year. However, over the long run the average reward is expected to be 5.55 times the average risk*. *Past performance does not guarantee future results! (4) This indicator was designed to capitalize on parabolic markets, specifically Bitcoin and alt coins. Crypto markets have a tendency to get moving so fast that many indicators become all but useless. Entries can get signaled too late and exits will get signaled way too early. This is specifically true when using oscillators that are designed to identify overbought or oversold environments. EMASAR does a great job of keeping us in a position for the duration of a trend and this includes the major parabolic runs that Bitcoin has a tendency to go on. When Bitcoin , or other alts, really get moving it can be very difficult to distinguish between a correction and a full reversal. We do not want to be exiting during a minor correction, instead this is a time when we want to be holding on or looking to buy the dip. This is a very fragile balance. The market has a very strong tendency to make corrections looks like reversals and to make reversals look like corrections. Therefore it is very important to have a tool(s) that you trust to distinguish in between the two. I believe that EMASAR is the best way to find that balance - if I knew of a better way then I would be using it instead! Following these signals will help us to hold onto positions while the market is still trending in our favor when most think that it has moved too far / too fast, and it will also get us out before a market fully reverses. Keep in mind that there will be times when we exit a market that is in danger of reversing, only to buy back higher later on. That is okay because it enables us to properly manage risk during times of uncertainty and buying back in at a higher price is more than worth the opportunity cost. Risks The biggest risks with trading EMASAR revolve around disobeying the signals. Risk management is built into this system with the exit signals that will occur, however it is up to the individual to execute those signals. Passing on an exit signal could lead to a big loss which would have a dramatic impact on the ROI . Most trading systems will have small and medium losses with small, medium and large wins. That is exactly how this works. The small - medium losses and wins will mostly be a wash and will account for roughly 80% of the trades. The large wins will happen about 20% of the time and will make up 80% - 90% of the profits. Therefore the two biggest risks are passing on signals entirely, or exiting preemptively. Getting chopped in and out of a market can be quite frustrating. If you become overwhelmed with negative emotions then it could cause you to pass up on the next signal. That signal will often be the one that more than makes up for the small - medium losses that preceded. On average EMASAR will provide one signal every 6 weeks when using the default settings on the 4h chart. Therefore missing one entry could turn an otherwise profitable year into a loser. If electing to trade a system, whether it is EMASAR or another, it is crucial to commit to taking every signal regardless of outside variables (namely your personal bias about market direction or frustration that follows a losing stretch). Another major risk with this system is taking too much profit too soon. When getting into a trade that has the potential to be a big winner it can be challenging to continue holding through the swings. Anyone that has watched paper profits vanish will be inclined to start exiting after the market makes a big move in his or her favor. While this is better than watching profits completely evaporate, this mistake can be enough to turn a profitable system into one that loses to the market. If 80% - 90% of our profits come from 10% - 20% of our trades then it is vital we do not cut those positions off at the knees. If taking too much profit too soon then you will consistently turn potential large winners into medium winners. This may lead to making money over the long run which will make it very difficult to realize that anything is wrong. However making money and beating the market are two very different things. Exiting early and making money is nearly as big of a risk as missing entries entirely. If you have the discipline to execute signals in a timely manner after they are triggered and the emotional control to let the winners run despite the appearance of a vastly overbought / oversold market, then you should have what it takes to beat the market with EMASAR. If you are not an experienced trader then it is very important to start out small. The only way to learn is to trade in a live environment and the only way to succeed is to risk much less than you can afford to lose. If you have $2,000 to trade with then start with a maximum position size of $20 - $50 and don’t be shy about scaling that down even further. Focus on ROI instead of actual dollars made. If you can return 100% on a $20 roll then you should be able to do the same with a $2,000 roll. Important Notes Make sure that you read / understand the risks outlined above. If you jump into this without understanding the unique risks that this system entails then you are going to have a bad time. This indicator was developed around the 4h and that is where it works best. For crypto adjusting to higher TF’s will cause for bad results as the entries / exits will be late to the party. For traditional markets the Daily - Weekly time frames are preferred. It was not originally intended for smaller TF's but we have seen some good results on the 15m and 1h. The RSI can be a great compliment when using on smaller TF's. Adding a rule for not entering when RSI > 75 or < 25 and instead entering when RSI retests 50 will help to avoid some bad signals. Alerts can be set for this indicator. Simply make sure that it is visible on the chart, then click the alert icon on the top panel. In the first dropdown set 'Condition' to 'EMASAR' and the second 'Condition' for the upcoming signal. For example if just entered long then set the second condition to 'Close Long' and you will be notified as soon as that signal occurs. If waiting for the next long entry then set the second condition to 'Open Long' so on and so forth . There is an 'All in One' alert that is also available. If you select that then you will be alerted any time that a signal occurs. The message will tell you to check the chart to see which signal caused the alert. Pine Script® Indikatorvon SawcruhteezAktualisiert 1134
InvictusHello, I introduce my strategy that provide signals for entering in the market and signal for exit. This indicator attempts to show a trader when is the best time to open a long or short position. The calculations are partially based on volatility, SMA, EMA and predefined values depending on used timeframe. We collect data from comparing the current price, calculating the average move of the market, top, bottom and close of the latest bars. The middle line is an adaptive moving average, which is the base of the signals and we also use it as a Trend Line to determine if we are in long or short "condition". The basic idea of this indicator is to show the best place to open a Long or Short position and when to close it. It is very simple - there are 2 type of signals - LONG (in green) and SHORT (in red). You can close your position when a TP (Take profit) shows up or based on your calculations. You can chose from several options which strategy you want (there is a "Strategy" select in the settings). The strategies that are proving better according to our tests are marked with a diamond. Don't forget to always trade with caution, trading is dangerous don't trade more than you can afford to lose. Please contact me via personal message if you want to test the strategy or for more information. Thank you.Pine Script® Indikatorvon SivakoAktualisiert 5577
PineGIF - Display Gifs & Images In Tradingview [LuxAlgo]Pinescript is not designed to create or display images, let alone gifs, but it's very fun to try, and that's what this script does. This script allows the user to display three different gifs. In this post, we explain how we managed to display images/gif's using pinescript tables. 1. Image Pre-Processing Due to pinescript limitations, we can't possibly display images with an excessively high resolution. As such we targeted pixel art as a primary image source. We used a pixel art gif of the magnificent Octocat (the mascot for the source-code hosting service GitHub) for our first try. We first extract each frame from the gif and resize them to a 50x50 resolution which returns frames made of 2500 pixels. This process was done using python. Getting Individual Pixels RGBA Values Python can easily return a matrix containing each pixel's rgba value. For convenience, we converted the rgba values to hex. We then create a simple code allowing us to return a pinescript array containing the 2500 pixel hex colors. We do this process for each frame. 2. Defining Table Cell Color In the code, each frame is its own array. We create a new table with dimensions equal to len(frame1)^2 (we assume height = width). The color of a cell is defined by the color of the image pixel at the same exact location. When a new bar is created, we do this exact process using a different frame which ultimately allows a new frame to be displayed. 3. Playing The GIFs By default, the script will play the gif of the Tradingview cloud logo raining. In order to play the gif, simply use the replay mode. The replay speed allows the user to determine the frame rate (0.1 for the raining cloud and Nyan cat works best, 0.5 for Octocat). We included the frames of the Octocat and Nyan cat gifs in the script. 4. Some Other Cool Images Displaying static images is possible and involves the same process described above. An original idea of the lizard, implemented by the wizard. Pine Script® Indikatorvon LuxAlgo77477
Carpe Diem 2.0 [Alerts]Carpe Diem 2.0 Alerts, Still automating the original Carpe Diem scripts, now the V2 uses heavy Volume based filtering to help only trade in bullish markets, Search for Carpe diem 2.0 to see backtest results This Alerts script has been created to help with bot Automation allowing you to create custom alerts This script has 10 variations built within it which are fitted for the coins differnt coinditions The coins included are DOGE/USDT 4H XRP/USDT 4H LINK/USDT 4H MATIC/USDT 2H SRM /USDT 6H COTI/USDT 4H DOT/USDT 3H TRX /USDT 4H RSR/USDT 4H ATOM/USDT 4H How to use the Indicator You can change what plots are shown in the settings Cog, I toggle all plots off apart from the coin I am trading When the Volume Average line is green, the market is up trending and will be looking for a trade whereas when they are red, the market is in a sideways or downtrend. You can ignore the color of the line and just base the bullish / bearish bias based of the Volume line being above/below 0 The script is written in version 4 When you go to create an alert with this script you will see 20 options, 10 for opening longs on certain conis and then 10 to close them This strategy performs best on the Binance listingsPine Script® Indikatorvon TradingWolf41
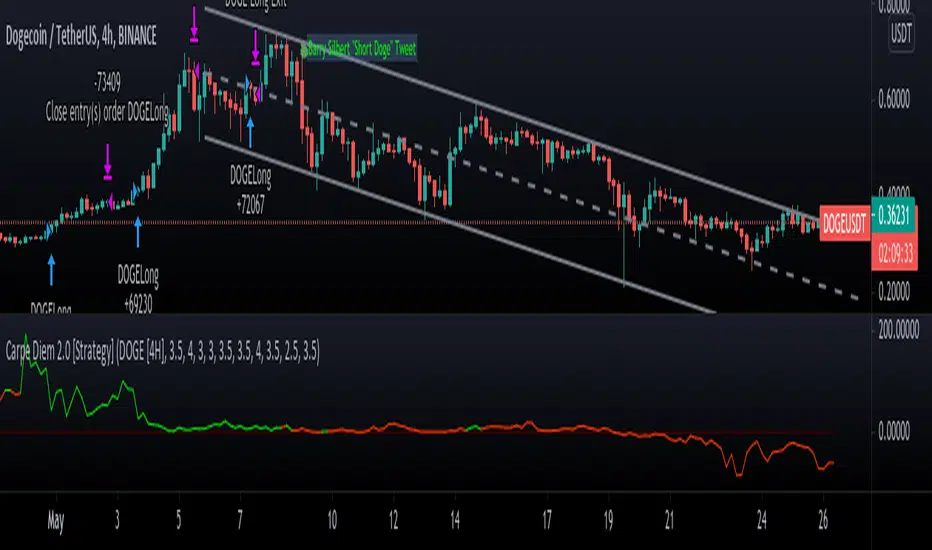
Carpe Diem 2.0 [Strategy]Carpe Diem 2.0 Strategy, Still automating the original Carpe Diem scripts, now the V2 uses heavy Volume based filtering to help only trade in bullish markets, This strategy script has been created to show backtest results This script has 10 variations built within it which are fitted for the coins differnt coinditions The coins included are DOGE/USDT 4H XRP/USDT 4H LINK/USDT 4H MATIC/USDT 2H SRM/USDT 6H COTI/USDT 4H DOT/USDT 3H TRX/USDT 4H RSR/USDT 4H ATOM/USDT 4H How to use the Indicator You can change what plots are shown in the settings Cog, I toggle all plots off apart from the coin I am trading When the Volume Average line is green, the market is up trending and will be looking for a trade whereas when they are red, the market is in a sideways or downtrend. You can ignore the color of the line and just base the bullish/bearish bias based of the Volume line being above/below 0 This strategy includes Fees and there is NO Repaint. The script is written in version 4 There is an option in the settings cog to choose from 10 Coins and timeframes which the Strategies have been optimised for and their best timeframes. There is also another option in the settings cog to change the backtesting range. There is also another option to adjust the stop loss. I have left it on the Default value which I believe works best This strategy performs best on the Binance listingsPine Script® Strategievon TradingWolf26
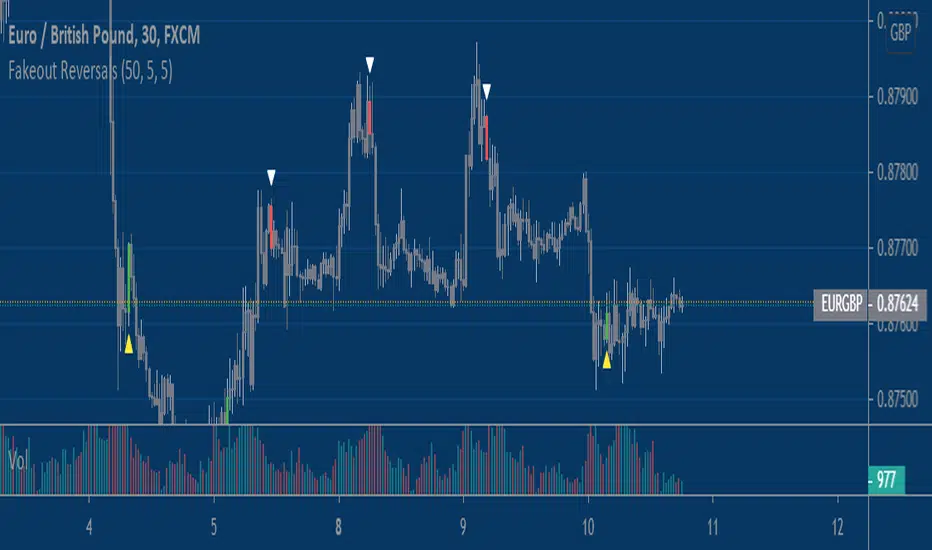
Fake-out ReversalsThis script combines two simple concepts, stop running and short term momentum, into a simple visual signal that can be applied to any market and any timeframe with some adjustment. It looks for price to violate a prior extreme within a certain lookback window, followed by price triggering a momentum filter that helps put the proverbial 'wind at your back' for the user. Users have the ability to customize three inputs; 1) Bars used to calculate price extremes 2)Bars since price violated that extreme 3)The sensitivity of the momentum filter. You will find that these signals work best in choppy and rangebound price action, less so in trending/grinding markets. For entertainment/educational purposes only. Enjoy!Pine Script® Indikatorvon CSC11111273