FuTech : Darvas Box (Original Theory) IndicatorFuTech : Darvas Box (Original Theory) Indicator
📈 Introduction
🔹 This indicator implements the legendary Darvas Box theory developed by Nicolas Darvas in the 1950s, which helped him turn $25,000 into $2,000,000 in just 18 months.
🔹 Unlike other box indicators, this implementation strictly follows Darvas' original methodology while adding modern technical features for enhanced usability in today's markets.
===============================================================================
📊 What Makes This Implementation Unique
🔹 This indicator stands apart from other Darvas Box implementations in several key ways:
🔹 It implements the exact "high before low" rule that Darvas used - first identifying the roof (top) of the box, then waiting for the floor (bottom) to form
🔹 It offers two distinct methods for box detection - Swing Confirmation (which waits for price confirmation) and Lookback Period (simpler approach)
🔹 It includes Darvas' critical volume confirmation requirement with customizable parameters
🔹 It incorporates Darvas' focus on strong stocks near their highs through the 52-week high filter
🔹 It provides multi-timeframe capability, allowing application to intraday, daily, weekly, or monthly charts
🔹 It features dynamic box coloring based on breakout direction (green for upward, red for downward)
===============================================================================
🔍 Technical Implementation Details
📦 Box Formation Algorithm
🔹 The indicator constructs boxes using a sophisticated algorithm that follows Darvas' original approach:
🔹 For Swing Confirmation mode:
🔸 The system identifies potential swing highs by looking for price points that are higher than the previous N bars (user-defined)
🔸 Similarly, swing lows are identified as points lower than the previous N bars
🔸 The "high before low" rule ensures a roof is established before a floor is determined
🔸 Once both parameters are locked in, the box is drawn and extended horizontally
🔹 For Lookback Period mode:
🔸 The box high is simply the highest high of the last X bars (user-defined)
🔸 The box low is the lowest low of the last X bars
🔸 This provides a simpler but still effective implementation of Darvas' concept
🚀 Breakout Detection System
🔹 The indicator employs a dual-confirmation system for breakouts:
🔹 Upward Breakout Conditions:
🔸 Price must close above the box roof
🔸 Volume must exceed the volume moving average (default 20-period) multiplied by a factor (default 1.5x)
🔸 The 52-week high filter must be satisfied (price must be within the maximum drawdown percentage from the 52-week high)
🔹 Downward Breakout Conditions:
🔸 Price must close below the box floor
🔸 No volume confirmation is required for downward breakouts (following Darvas' approach)
📊 Volume Confirmation Mechanism
🔹 The indicator calculates volume thresholds using:
🔸 Volume Average = SMA(volume, N) where N is the user-defined period (default 20)
🔸 Volume Threshold = Volume Average × Volume Factor (default 1.5)
🔸 Only when current volume exceeds this threshold is an upward breakout considered valid
📈 Uptrend Filter
🔹 The indicator implements Darvas' focus on strong stocks through:
🔸 52-week High Calculation = Highest price over the past 52 weeks
🔸 Minimum Price Requirement = 52-week High × (1 - Maximum Drawdown %)
🔸 This ensures only stocks that are not too far from their highs generate signals
===============================================================================
🎯 How to Use This Indicator
🔷 Entry Signals
🔹 Wait for a green box to appear, indicating an upward breakout
🔹 Confirm that volume was above average during the breakout (shown by the indicator)
🔹 Verify the stock is within your acceptable distance from its 52-week high
🔹 Consider entering on the next candle after confirmation
🔷 Exit Signals
🔹 Exit when a red box appears, indicating a downward breakout
🔹 Alternatively, use trailing stops below newly formed box lows
🔹 Consider partial exits at predefined profit targets while letting the remainder run
🔷 Parameter Optimization
🔹 For swing traders, use longer lookback periods (20-50 bars)
🔹 For day traders, use shorter periods (5-15 bars)
🔹 Adjust the volume factor based on the asset's typical volatility
🔹 Modify the maximum drawdown percentage based on your risk tolerance
===============================================================================
📚 Historical Context and Trading Philosophy
🔹 Nicolas Darvas developed his box theory while traveling the world as a dancer.
🔹 With limited access to market information, he relied only on price charts and telegrams.
🔹 He discovered that strong stocks tend to pause after hitting new highs, forming what he called "boxes" - sideways ranges where the stock "rests" before its next move.
🔹 By buying only when price broke above these ranges with unusually high volume, he was able to ride powerful uptrends while cutting losses quickly when the breakdown occurred.
🔹 This indicator captures the essence of Darvas' approach - focusing on strength, confirming with volume, and selling weakness quickly - while adding modern technical features to enhance its utility in today's electronic trading environment.
===============================================================================
⚙️ Calculation Summary
🔹 The indicator performs the following calculations:
🔸 Box High = Highest swing high or lookback high (depending on selected method)
🔸 Box Low = Lowest swing low or lookback low (depending on selected method)
🔸 Upward Breakout = Price > Box High AND Volume > (Volume Average × Volume Factor)
🔸 Downward Breakout = Price < Box Low
🔸 Volume Average = SMA(Volume, N) where N is the volume period
🔸 Uptrend Filter = Price ≥ (52-week High × (1 - Maximum Drawdown %))
===============================================================================
🔔 Alert Configuration
🔹 To set up alerts:
🔸 Right-click on the chart and select "Add Alert"
🔸 Choose the Darvas Box indicator as the alert condition
🔸 Select either "Breakout Up" or "Breakout Down" as the alert condition
🔸 Configure your preferred notification method
🔹 This modernizes Darvas' telegram-based approach, allowing you to receive instant notifications when potential trading opportunities occur.
===============================================================================
📈 Conclusion
🔹 This FuTech : Darvas Box (Original Theory) indicator faithfully implements Nicolas Darvas' legendary trading method while adding modern technical features.
🔹 By focusing on strength, confirming with volume, and providing clear entry and exit signals, it offers traders a structured approach to trend following that has stood the test of time.
🔹 The indicator's multiple detection methods, volume confirmation, and trend filtering make it a comprehensive tool for implementing Darvas' box theory in today's markets.
===============================================================================
🙏 Credits : Inspired by @LevelUpTools
Darvasboxstrategy

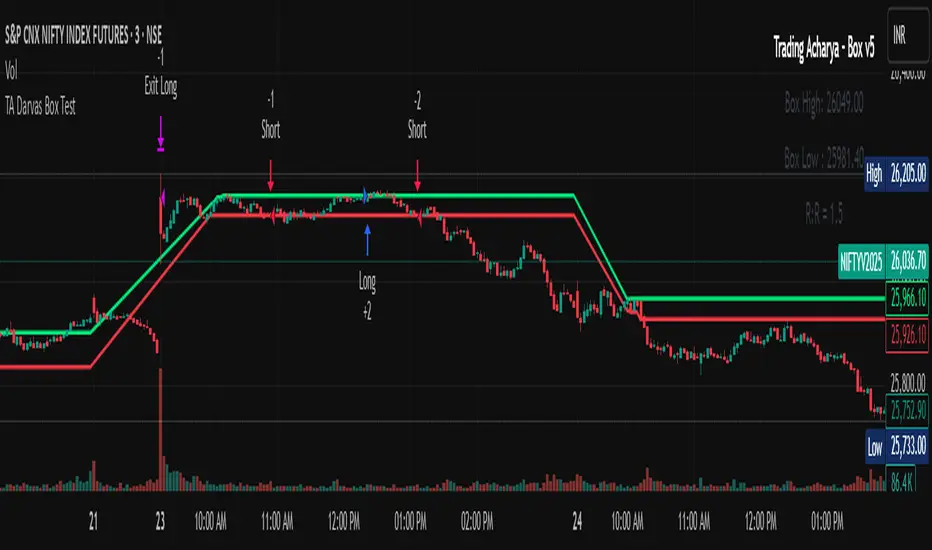
TA Darvas Box Test🎯 Core Logic
1-Darvas Box Breakouts/Breakdowns → Entry when price crosses above the Top Box (long) or below the Bottom Box (short).
2-Trend Filter (MavilimW) → Longs only when price is above MAVW, shorts only when below.
3-Momentum Confirmations → ATR spike and Volume spike must confirm breakout strength.
🛠 Position Sizing (MaTriangle – Martingale by Qty)
1-Starts with Base Qty.
2-On losing trades → step-up size using Qty Multiplier, capped by Max Steps & Max Qty Cap.
3-On winning trades → optional reset back to Base Qty.
⚠️ Martingale sizing can increase drawdowns — use carefully.
⏱ Trade Gating
1-Backtest Window: Only trades between selected From – To dates.
2-Trade Cap: Limit trades Per Day / Per Week / Per Month (auto reset).
3-One Position at a Time (pyramiding = 0).
📉 Exit Rules
1-Protective Stops:
2-Long → Stop at Bottom Box.
3-Short → Stop at Top Box.
Profit Safeguard: If in profit, exit when RVI crosses against trade.
1-No fixed TP → trades ride until Box stop or RVI exit.
🔔 Alerts (Options Workflow)
1-Static Alerts: Fire on confirmed long/short signals (compile-safe).
2-Dynamic Alerts: Send ATM strike info, Qty, and Martingale step.
3-Auto ATM Mapping: BANKNIFTY, NIFTY, FINNIFTY, MIDCPNIFTY detected automatically; fallback to manual step.
⚙️ Suggested Defaults
Darvas Box Length = 5
ATR Len = 14, ATR SMA = 14, Mult = 1.0–1.5
Volume SMA = 20, Mult = 1.5–2.0
Base Qty = 1, Mult = 2.0, Max Steps = 3
Trade Cap = Per Day, 10–30 trades
✅ Works on any symbol/timeframe.
⚠️ High-risk position sizing (Martingale). Backtest thoroughly and use with caution.
MB Darvas Box The algorithm is related to darvas theory.
Creates resistance and support levels by creating boxes on the chart layout.
It creates flag icons in the form of Down (A) or Up (Y) according to these box breaks about the trend.
Considering the Darvas strategy, it also provides convenience in trailing stop.
-Alarm adding feature is available.
-Box color change can be edited from the settings section.
-Box fill color can be changed.
-Show/unhide history boxes is available in settings.
-Box calculation can be changed in time intervals.
-You must change the Box Limit entry to see fewer boxes.
It will be more meaningful if used together with the volume indicator.
It is not recommended for use in real transactions.
Does not include investment advice.
Algorithms are useful tools for making predictions.
