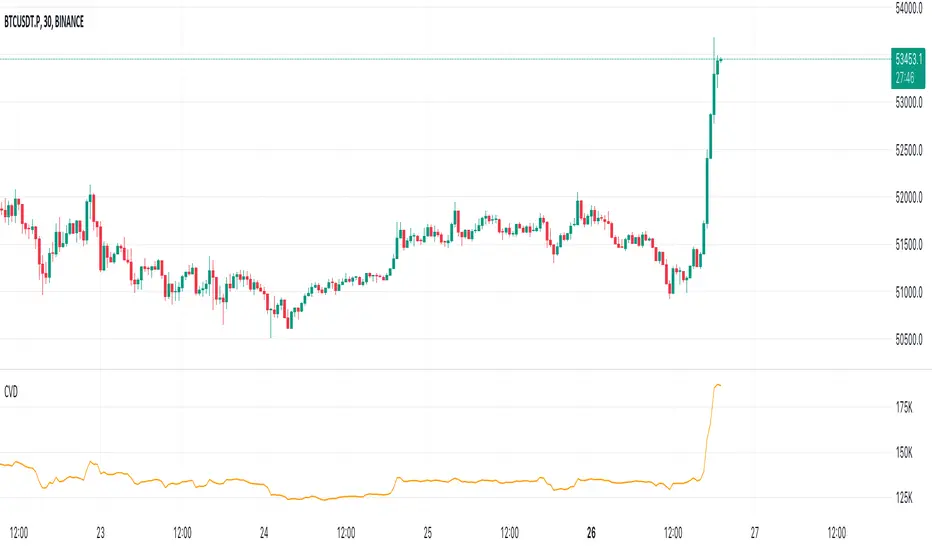
Cumulative Volume Delta LineThis script is a refined version of TradingView's Cumulative Volume Delta (CVD) indicator. It features a CVD line for lower time frames and automatically switches to a Simple Moving Average (SMA) line on daily time frames and higher. This functionality makes it easier to spot Volume Delta divergences on daily charts while maintaining utility on intraday time frames.
Key Features:
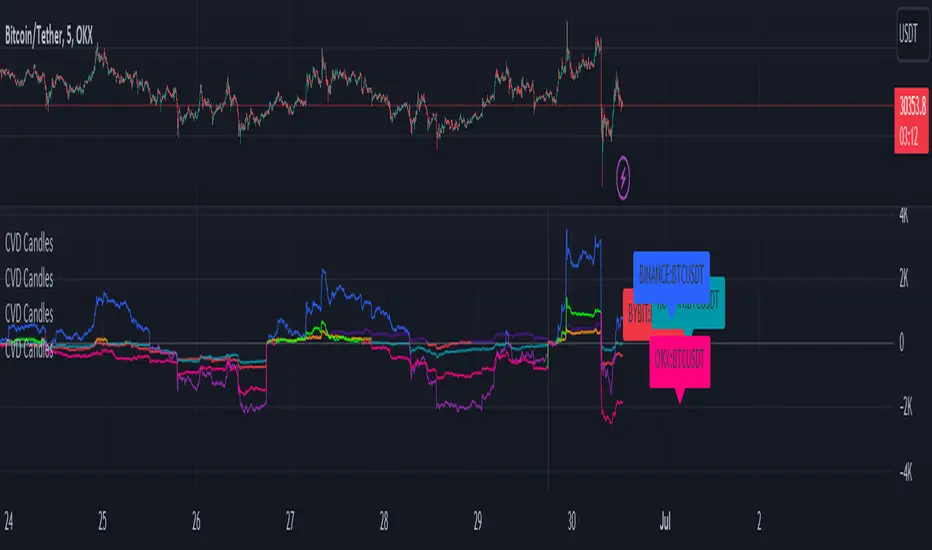
Line Chart and Oscillator Configuration: Unlike TradingView's standard CVD, this script can be configured as a line chart or an oscillator, enhancing flexibility and usability.
Line chart for easier divergence spotting: The line chart format is preferred for spotting divergences, providing a clearer visual representation compared to other formats.
Accurate Calculations: Many older community CVD scripts use approximate calculations that can be inaccurate. This script leverages TradingView's own calculations, which are the most accurate available without tick data feeds.
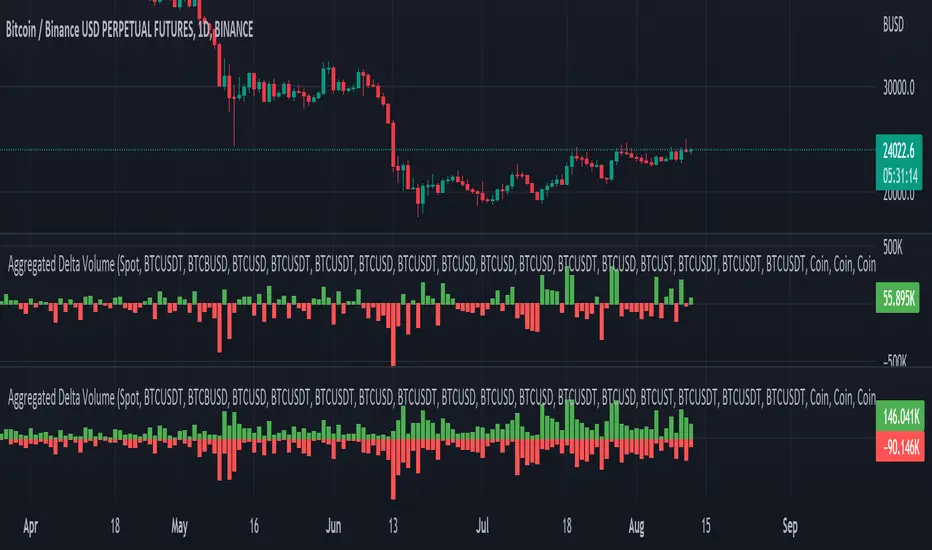
Intraday and Daily Adaptation: The Traditional CVD script is a per bar volume delta on Daily and higher timeframes and cumulative volume delta for intraday session timeframes which makes it very hard to spot divergences on higher timeframes. This script resolves that by using an SMA on daily time frames and higher.
Auto-Switching Feature: The script intelligently switches between the CVD line and the SMA line based on the active time frame. This feature can be toggled off if you prefer to use the CVD on all time frames or the SMA on all time frames.
Customizable Settings: Building on TradingView's CVD script, this version includes all the same settings in addition to the new auto-switch, SMA length etc.
About Volume Delta and Cumulative Volume Delta:
Volume Delta is the difference between the buying and selling volume within a specified period. It helps traders understand the net buying or selling pressure in the market. A positive volume delta indicates more buying activity, while a negative volume delta indicates more selling activity.
Cumulative Volume Delta (CVD) aggregates the volume delta over time to provide a running total. This cumulative approach helps traders see the overall buying and selling pressure trends, making it easier to identify potential reversals or continuations in the market trend.
Pine Script® Indikator