Takashi Trend | 2nd Gen |Discover trends instantly thanks to our new indicator.
A popular trading expression says: "the trend is your friend until it ends." This indicator makes it easier for any trader to see the market's major trend and trade accordingly.
Calculations are based on Average True Range.
This indicator does not provide signals or alerts. It is best used as a confirmation tool.
To get access to this and other scripts check links below.
Cryptotrading

Takashi Triangular Arbitrage | 2nd Gen | [Alerts]Spot discrepancies between three currencies: these opportunities are rare and usually benefit to traders using advanced programs. You can now set up alerts and discover those for yourself.
This indicator signals opportunities for executing triangular arbitrage. Triangular arbitrage is the result of a discrepancy between three different currencies that occurs when the currency's exchange rates do not exactly match up. These opportunities are more frequent at cryptocurrency markets. The trader would exchange an amount at one rate (Currency_B/Currency_A), convert it again (Currency_C/Currency_B) and then convert it finally back to the original (Currency_C/Currency_A), and assuming low transaction costs, net a profit.
Example:
As per standard inputs, the trader would use US dollars to buy BTC (BITFINEX:BTCUSD), use BTC to buy NEO (BITFINEX:NEOBTC), use NEO to buy US dollars back (BITFINEX:NEOUSD). Whenever the quantity of US dollars bought back is higher than 1% from the initial amount, the indicator will send an alert signaling an arbitrage possibility.
Disclaimer: triangular arbitrage requires advanced automation tools and is only possible if there is enough liquidity to quickly execute all 3 trades at prices used on the indicator.
Inputs
Symbol 1
Symbol input. First step currency to initiate triangular arbitrage. (Currency_B/Currency_A)
Symbol 2
Symbol input. Second step currency to continue triangular arbitrage. (Currency_C/Currency_B)
Symbol 3
Symbol input. Final step currency to finalize triangular arbitrage. (Currency_C/Currency_A)
Discrepancy %
Float input. Amount in percent of profit return after triangular arbitrage is finished. Transaction fees not included.
To get access to this and other scripts check links below.

Rogue Profit Alert IndicatorThis is a complex script developed to measure specific volatility parameters and enter trades based on predetermined rules which are proprietary and will not be released, so don't ask for specific indicator settings.
This indicator accompanies the "Rogue Profit Strategy" and can be used for creating alerts based on the strategy's performance. Please read the more in depth description on the "Rogue Profit Strategy" page. Make sure the input parameters are the same for both the Strategy and Indicator to insure accurate signals.
This is a very powerful and profitable script that will simplify your trading and has been in development and tested for three years. Message for details on how to obtain access. Please allow up to 24 hours for a response.

PpSignal drake delay oscillator GritasIt is a technique, when the drake oscillator moving averages (Drake Daly Statocastico) cross up you must buy and the histogram is painted in a green color .... when the drake oscillator crosses down and the histogram is painted red you must to sell.

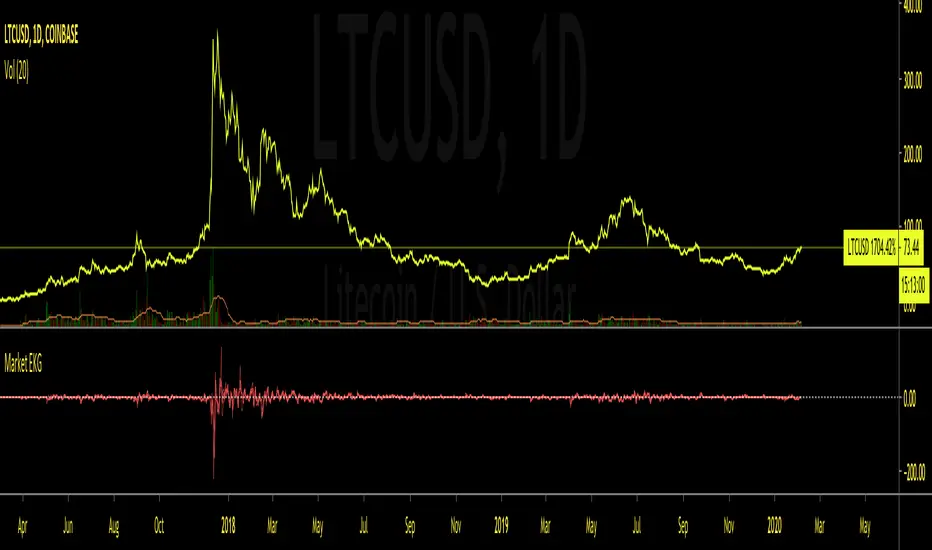
Market EKGShort Summary
This indicator takes the differences in the previous 4 period OHLC inputs, and compares them to the previously closed candle input. The difference is then placed into an oscillator that when all four inputs are scrolled back on, shows an EKG appearing oscillator / volatility measure for traders to use on indexes, tickers and markets that do not allow typical volume based indicators.
Full Summary
Named for its similar appearance to an EKG medical chart, this script takes the difference in relative averages of previous periods in a trend , and compares it to the most recent period input. This can be used as a price based volatility measure, useful in markets that may be limited by no valume measures or other indexes where volatility is useful to meeasure but will not allow volume initializations.
Steps taken
Taking Previous Period OHLC
Taking Previous 3 Periods OHLC Avgs
Difference Between #1 & #2 (Comparing most recent confirmation to relative trend
Plot Results
This RSI Script is intended for public use and can be shared / implemented as needed
Questions? I do not monitor my TradingView inbox. See email address in signature at the bottom of this page for contact information.
Use this script and its calculations as needed! No permission required.
Cheers,
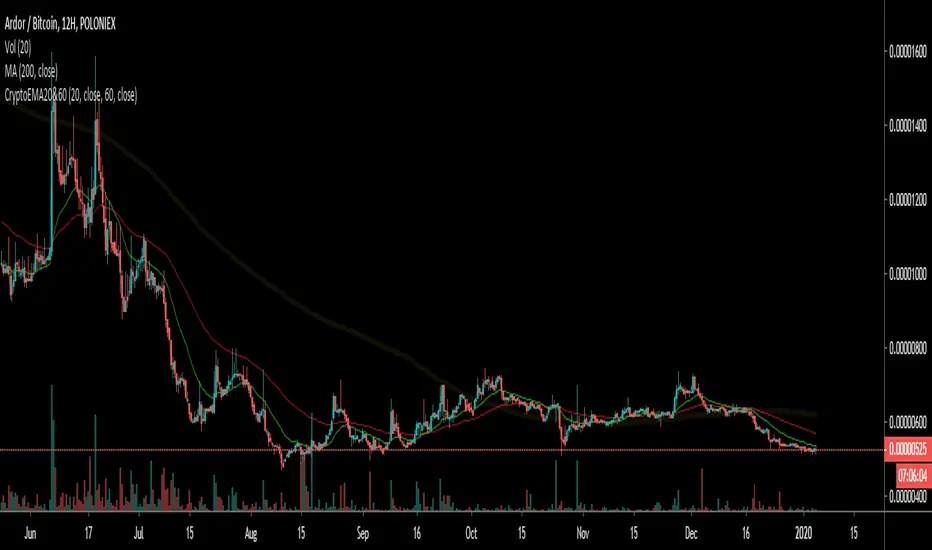
Crypto EMA 60/20Intended for use with Cryptocurrency Markets on the 12 hour time frame, the 60/20 exponential moving average frequency has proven successful for identifying trend bottom formations and for verifying head and shoulders top formations.
Combine the Crypto EMA 60/20 with classical RSI and MACD divergences to help verify impending reversals.
Useful for identifying trend changes in the frequency of four to six month price trends followed by a four to six week reversal, as historically found in cryptocurrency bull and bear markets.
This signal gets noisy if prices trend sideways for more than 30 days - consult daily views.
BEST Mayer MultipleHello traders
I'm not a HODLer by any means. I know when to sell (or I think I know....) when an asset starts going against me too much.
Even if it's a "long-term" investment.
My mentor used to telling me this: "If a short-term trade becomes a long-term investment, then you're in for a hell of a ride".
I have no clue if Bitcoin/BTC will go back up or not - I don't even care because I'm an intraday trader.
What if BTC was actually a way to accumulate more fiat? Satoshi fooled us
I coded this Mayer Multiple according to the specifications below. By the way, I'm a big fan of Willy Woo. I've been monitoring all his work since I learned about crypto (10 minutes ago.... it's a joke come on)
charts.woobull.com
Scaling
To respect the Mayer's multiple model, I recommend to select the Logarithmic scaling as shown below
imgur.com
What Mayer's model says
Using the reference below, the model says we're in the oversold zone. But, we can be in that zone for months/years...
When a model says an asset could bounce in a 1000-7000 USD range... well... I don't know how I would be able to perform optimally with that insight. This is very subjective and not a recommendation.
Mayer's Multiple model reference
All the BEST
Dave

Entry Point IndicatorIndicator detects entry point on differents markets and timeframes
Suggested timeframes: from 1 hour to 1-week chart

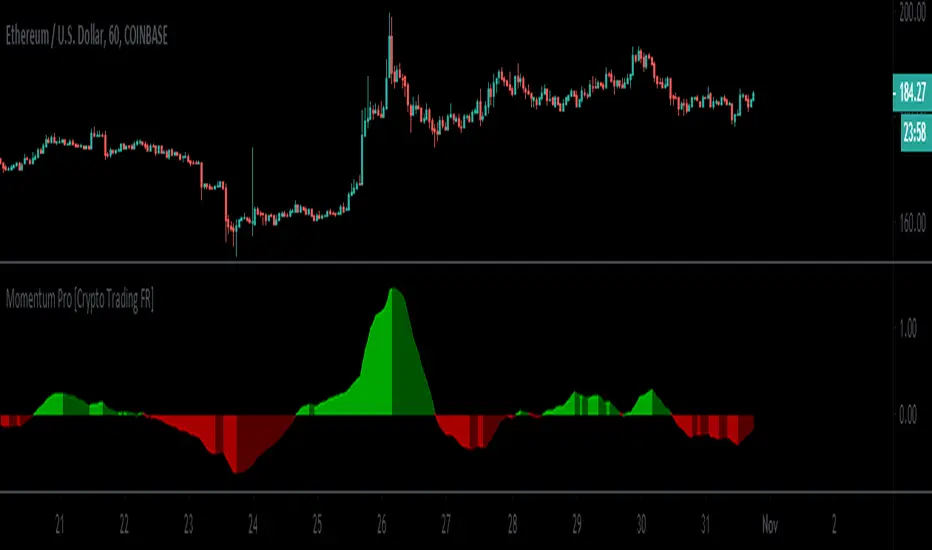
Momentum Pro [Crypto Trading FR]Momentum Pro is a script geared toward identifying price trends.
It is calculated to best fits the set of data being analyzed whatever the timeframe used.
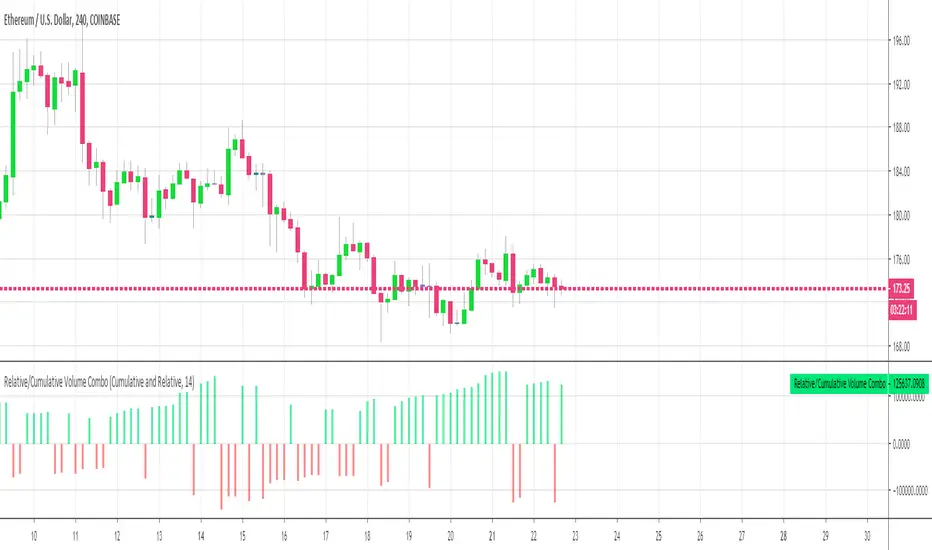
Relative Volume Combined With a Cumulative FunctionHi everyone
The today's script was suggested by a follower.
--------------------------------------
1 minute of Knowledge
--------------------------------------
Many traders look at volume as a pre-signal that a move may happen.
In trading, some say that "the volume precedes the movement".
This simply means that often volume will increase before a significant move in the stock.
Imagine if a unique trader is buying a crypto/stock. The volume is unlikely to move.
But, if all the mass goes to mass spot buy an asset, then we could see a volume spike announcing a potential upwards move.
---------------------------------------------
What's the story with that indicator?
---------------------------------------------
It's an interesting way of presenting the volume data.
Will show the total volume for the selected period.
You can choose between relative and cumulative presentation.
The users can display the consecutive rising volume above the 0 line and the failing volume below that line.
--------------------------------------
Mix knowledge with usefulness
--------------------------------------
A price making a higher/high (HH) or lower/low (LL) has a real and strong meaning- a HH or LL on a volume has a significant meaning also.
Increasing volume for a stock/crypto, could signify that buyers were willing to purchase a bigger number of shares at a higher price (comparatively to the day before)
Obviously, non-stop crazy buying/shorting won't work at some point - and that "some point" may hurt a bit.
Such volume indicator combined with others like momentum or strength indicators is a nice trading strategy.
The volume announces that a move may happen and the other indicators will confirm the prophecy :)
Peace
Dave
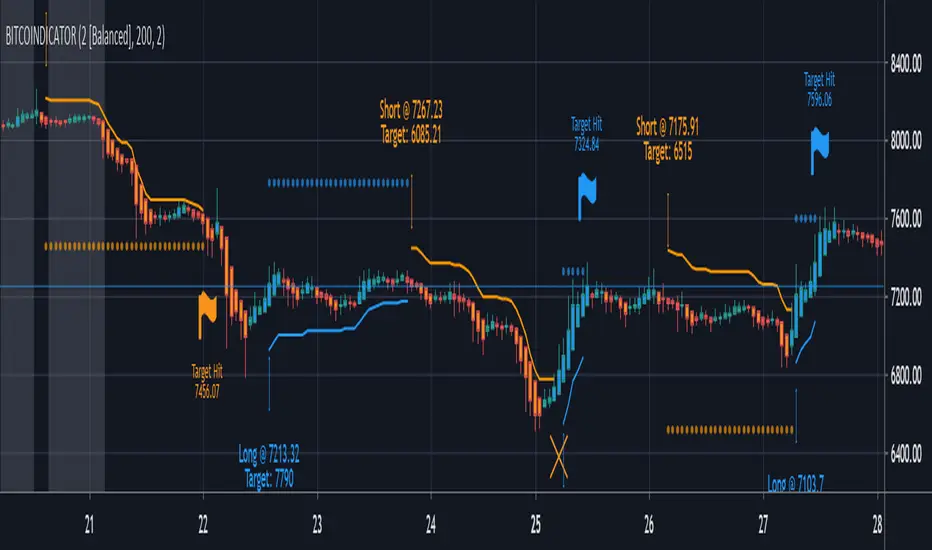
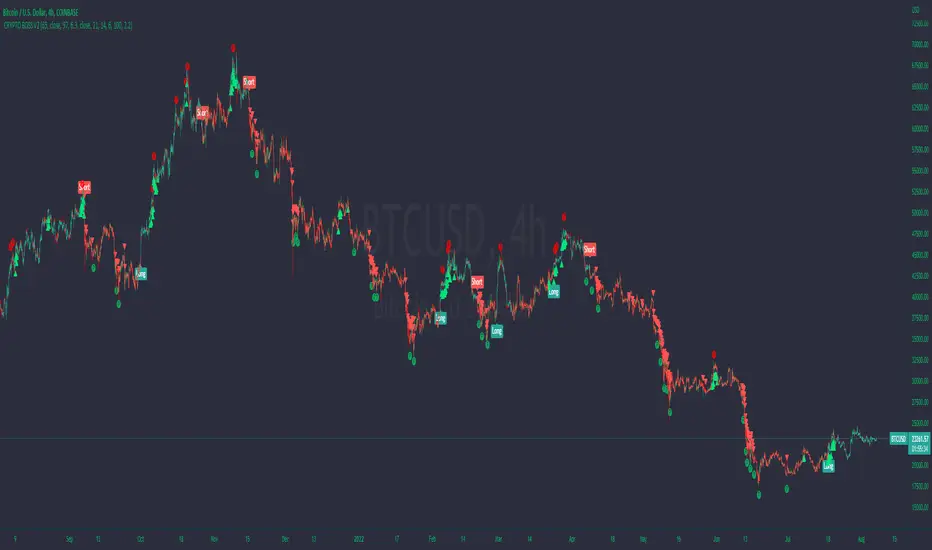
BITCOINDICATORAll-in-one indicator designed for Bitcoin (any BTC/USD pair), and works well for all Crypto/stable coin pairs. It utilizes individual trade signals from price momentum, EMA crossings, periodical VWAP, volume divergences, and market volatility to create a checklist that when filled, generates easy-to-read, real-time trade labels.
For detailed information on Bitcoindicator and how to add it to your charts, please visit:
www.bitcoindicator.com
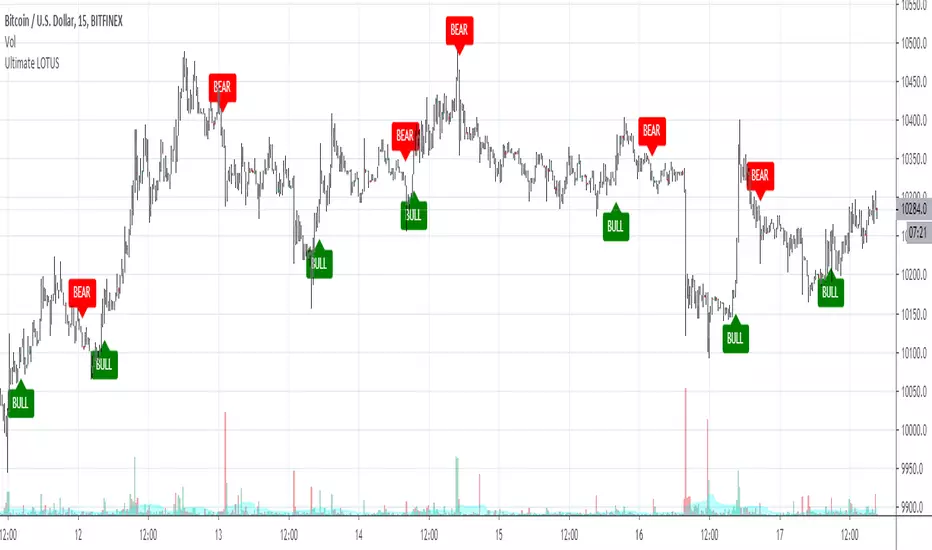
Ultimate LOTUSWelcome to the Ultimate LOTUS.
You may have used my original Lotus indicator from last year. This is the new and improved version of the Lotus.
This indicator does NOT repaint!
How to use: Wait for the candle to close before taking a signal. You can also set alerts with this indicator!
BULL = Buy alert
BEAR = Sell alert
DM if you have any questions!
Crypto Break-even FeeWhen I started trading cryptocurrency, I lost money because I didn't take the fees enough into account. Therefore I created my own indicator to quicqly see the break-even selling price of the selling price if I want a predifined profit level.
2 lines are added to the graph. These lines move together with the current price.
- One line indicating the break-even selling price (depending on your maker/taker strategy). For beginners I suggest taking the taker strategy (mostly 0.25%)
- Another line indicating the selling price in order to make a predifined profit %
There are 2 parameters you can set:
- Desired profit (%)
- Maker/Taker Fee (%)
Always happy with a little appreciation ;-) Bitcoin wallet: 18522cAc7YDwwXTvtckXKb1kP33upVDRFR

Crypto Fund indicatorThis indicator is just a slight modified version of the godmode indicator developed by xSilas.
It helps to spot and extreme building selling or buying pressure.
I use it mainly for BTC on the 1h chart but can do the job on other crypto-assets and timeframes such as 5min, 30min etc.

PpSignal LONG SHORT BTC SIGNALanalyzing the open buy or sell positions, we have developed an indicator that avoids falling into trading traps
BOSS| Trade Like A Bitcoin and Ethereum WhaleTHE BEST BITCOIN AND ETHEREUM INDICATOR FOR TRADINGVIEW.COM
Quantum Technology – You won’t find any other indicator out there that predicts the probability of the next candle being bullish or bearish .
No Lag, No delay, No repaint!
Quality of Signals – The new Boss Quantum allows you to be in control of the outcome probability. Higher accuracy!
Buy/Long on Long Signal
Sell/Short on Short Signal
SET ALERTS TO ONCE PER BAR CLOSE
//////////////////////////////////////////////////////////////////////
Breakouts, Profit Points, and ReEntry's
This indicator will alert you of when to take profits, when to reenter a trade, and when a breakout occurs.
TAKING PROFITS
When in a long position take long profits on teal circle which, will be above candle.
When in a short position take short profits on purple circle which, will be below candle.
I typically exit 25-50% of position and reenter 25-50% on next candle.
If a Long or Short signal on BOSS quantum is still present the long or short trade is still active.
ReENTRY's
Long ReEntry's
If in a long position and a purple circle appears below candle this indicates a great place to either reenter trade or add more to position.
If a green triangle appears below candle you can either reenter or add more to long position as this signifies a long breakout/ strong upward movement.
Short ReEntry's
If in a short position and a teal circle appears above candle this indicates a great place to either reenter trade or add more to position.
If a red triangle appears below candle you can either reenter short or add more to short position as this signifies a short breakout/ strong downward movement.
Breakout's
Green Triangle
If a green triangle appears below candle you can either reenter or add more to long position as this signifies a long breakout/ strong upward movement.
Red Triangle
If a red triangle appears above candle you can either reenter short or add more to short position as this signifies a short breakout/ strong downward movement.
SET ALERTS TO ONCE PER BAR
Available At: Bosscripts.com
Crypto Noodles ema S/R bands + supertrendSpecial combination of bands/lines for support and resistance in bear and bull market, also for catch spike , when price go out of them. Also integrated a supertrend indicator with green and red smoothed heikin ashi candles.

BOSS Smooth Stochastic-RSI And RSI Oscillators With Alerts THE BEST FOREX, BINARY OPTIONS, STOCK AND CRYPTO INDICATORS FOR TRADINGVIEW.COM
Our Smooth Stochastic RSI indicator and our RSI indicator all combined in one!
BACKGROUND AND BAR COLOR
Green=BULLISH
Yellow= NEUTRAL/TRANSITIONAL
Red= BEARISH
ALERTS
GET ALERTS FOR BULLISH AND BEARISH CROSSOVERS ON STOCHASTIC RSI
GET ALERTS WHEN RSI LINE IS GREEN AND RED

PpSignal ADX/DI HistogramHere we have the ADX with DM histogram signal, and volatile Bollinger Band (period 13, Deviation 0.61).
the best signal is when adx is into volatility and dm histogram is going in the same directions.
For example if you detect a up channel...you will buy when DMI histogram is in buy signal (green) and Adx is abobe the bollinguer band. and in e green color.

Scalp TraderA nice strategie for the beginners traders..in order to help see better how to folllow the trend.. because trend is youre friend :)
For access ----> private message.

Momentum Signal Moving AverageThis is a script with one modified indicator that mainly tracks and executes positions openings by calculating volume and "enthusiasm" from the exchanges coin pairs. I recommend that it is used on a 15m chart.
When it is a bullish trend it is configured to take profit, but this is of course something you can set values or disable. In bearish trends, the script opens bigger positions, and when a bounce happens the script starts taking profit.
In stagnation, the script used to be week, and made losses. However, with the added scalping feature it seems to at least even it out, or even make profit as I have seen now.
It's still a very 1.0 script and will get updated to make sure the profit keeps getting higher percentage.
I use the Alerts Trader extension to execute orders from Tradingview in Chrome via Bitmex API.
I use it on Bitmex, but surely you can use it on other exchanges that are supported in the Alerts Trader extension, which is extensive.
Important : You will be able to add this script to your chart, but you won't be able to se the source code, so to make it work you need to set the alerts right, with correct code for it to work.
Here is where I come in:
I'll give each user 3 day trial, and after that, if you are satisfied and want to run it longer, you can subscribe for $49/month.
And if you have bigger capital, I will install it and configure it to match the amount of contracts you wish to have.
If you are a person with big capital, you can get 1 week of trial.
And for people with big capital, you can get personal support from me when needed to alter settings or create new alerts. This will cost $50 each time.
But remember, you can also run the trial on the Bitmex testnet, but the volume is very low there so the bot does not preform as well on the testnet as it does on the mainet with big volume.
I am willing to let someone, a 3rd party, with good reputation test it for a few days and make an honest review after.
Disclaimer: I cannot guarantee that this script will make you rich, but after a week of testing, both on testnet and mainnet, the results are good enough for me. (I am no financial expert or professional trader. Any losses from the algorithm is not my issue, use it at your own risk. Always run the script/bot with money you can afford to lose)
All payments to me are made in bitcoin.

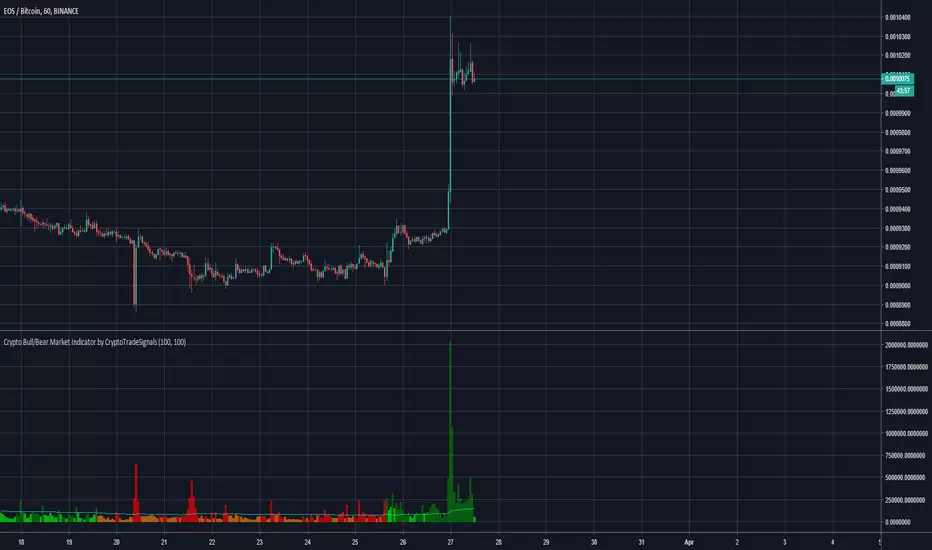
Crypto Bull/Bear Market Indicator by CryptoTradeSignalsHave you ever struggled to identify the sentiment of the crypto market?
With the "Crypto Bull/Bear Market Indicator by CryptoTradeSIgnals" you can easily determine whether markets are “bullish” or “bearish".
Features
Combines price and volume algorithms to easily identify market sell offs or strong buying activity.
Synergises with with Crypto Peak and Crypto Bottom indicators to better identify ENTRY and EXIT points for your trades.
Complete REWRITE of the pre-existing Crypto Bull/Bear Signal which provides better visual cues to understand market activity.
>>Get access to our Crypto Trading Indicators by visiting our website (please go to my main profile page or check the my signature)<<
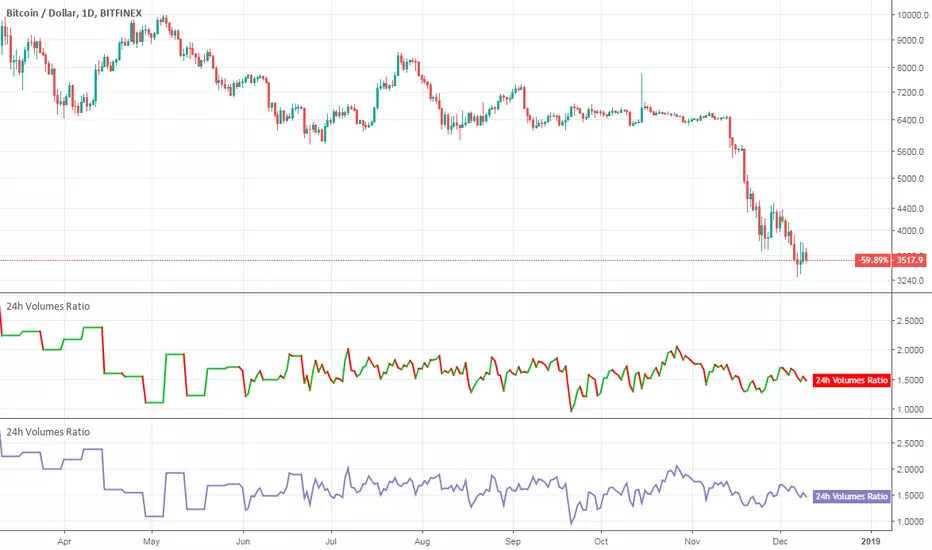
Crypto Mineable vs Not Mineable (24h Volumes Ratio)Hello traders!
This indicator shows you the dynamic ratio between 24h total volumes of the mineable and not mineable cryptocurrencies from TOP-40 according to coinmarketcap.com .
NOTE : The word "dynamic" means that I didn't have to hardcode 24h volumes from coinmarketcap.com for the presented cryptocurrencies - all values are updated automatically.
How to get access
You can buy it for only 30$ to get lifetime access
Happy Trading!