MTF CPR Boxes & Multiple Pivots - Nadeem Al-QahwiMTF CPR Boxes & Multiple Pivots is designed to make those structural zones easier to see by turning classic pivot math into clean, multi-timeframe visual regions directly on your chart.
⸻
The Concept: Central Pivot Range (CPR) Math
This tool is based on the well-known Central Pivot Range (CPR) methodology.
For each selected timeframe, the CPR is calculated from the previous period’s OHLC data:
• Central Pivot:
Pivot = (High + Low + Close) / 3
• Bottom Central:
BC = (High + Low) / 2
• Top Central:
TC = (Pivot - BC) + Pivot (equivalently TC = 2 * Pivot - BC)
This indicator computes these CPR levels for Daily, Weekly, and Monthly timeframes and overlays them on the current chart. The idea is to reveal how price is interacting with higher-timeframe value areas and potential support/resistance clusters in real time.
⸻
Visual Innovation:
• Instead of drawing only thin lines for TC, Pivot, and BC, the area between TC and BC is rendered as a box (zone).
• The central pivot is still drawn as a line inside the box for reference, but the main emphasis is on the entire value range, not a single price.
• This box-based representation helps traders visually identify:
• Liquidity clusters inside the CPR range
• Overlapping CPR zones across multiple timeframes (powerful confluence)
• Compression areas where price is likely to build up orders before expansion
⸻
Key Features
• Multi-Timeframe CPR (MTF Overlay)
• Daily CPR box
• Weekly CPR box
• Monthly CPR box
All three can be enabled simultaneously, allowing you to see where short-term and higher-timeframe value zones overlap.
• Institutional Color Theme
• Separate colors for Daily, Weekly, and Monthly CPR zones
• Designed to be visually distinct yet clean, so confluence is easy to spot without clutter.
• Multiple Pivot Types (Traditional + Camarilla)
• Traditional pivots (PP, S1–S5, R1–R5)
• Camarilla pivots (L1–L6, H1–H6)
These are drawn as classic lines with label/price options and can be used together with CPR boxes for a richer structural map.
• Dynamic Zone Levels (DZL) Engine
• Automatically detects pivot-based support and resistance zones from historical swings.
• Clusters nearby pivots into channels based on a configurable width and strength filter.
• Draws only the strongest zones to keep the chart readable and focused on meaningful levels.
⸻
Settings Guide (How to Customize)
The script includes a set of user-friendly controls so you can adapt the visuals to your style and chart theme:
• General Settings
• Pivot timeframe selection for the main (non-CPR) pivots.
• “Pivots Back” and “CPR Levels Back” to control how many historical periods are displayed (helpful for performance).
• CPR Visual Style (SMC Boxes)
• Box Transparency: Adjusts how opaque the CPR zones are (0 = solid, 100 = invisible fill).
• Border Style & Width: Choose between Solid, Dashed, Dotted, or hide borders completely.
• Text Options: Toggle CPR labels inside each box (e.g., “D-CPR”, “W-CPR”), set text color, size, and placement (center or corner positions).
• Pivots & Labels
• Enable/disable Traditional and Camarilla sets independently.
• Control which levels to display (e.g., show R1–R3 only).
• Choose whether to show level names, prices, or both.
• DZL Settings
• Pivot period for swing detection.
• Channel width (% of price range).
• Maximum number of zones and minimum strength (how many pivots must cluster to form a valid zone).
• Separate style controls for support vs. resistance colors.
⸻
Disclaimer
This indicator is provided for educational and analytical purposes only.
It does not constitute financial advice, investment advice, or a recommendation to buy or sell any security or instrument. Always perform your own analysis and use proper risk management. Trading involves risk, and you are solely responsible for your own decisions.
Cprmonthly

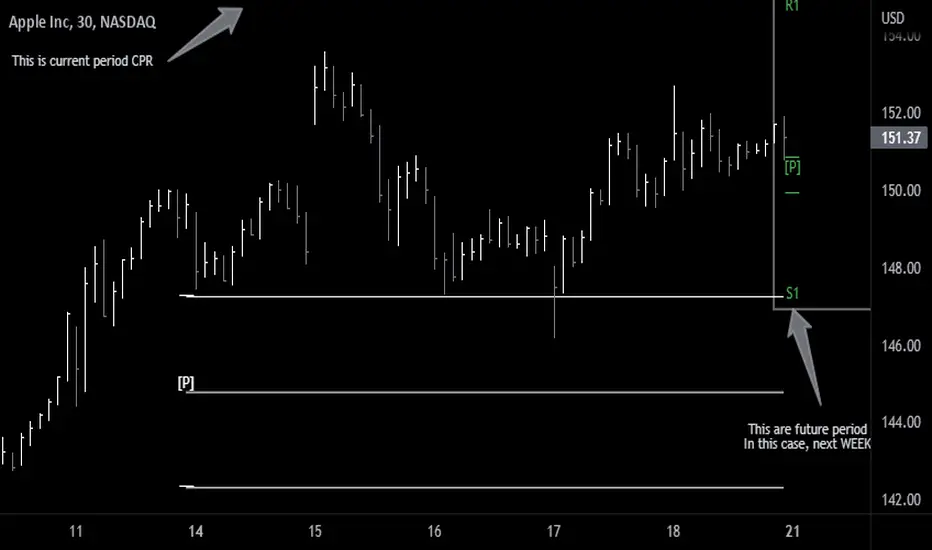
Future Pivots CPR - All Timeframes
Simple idea that allows you to display tomorrow CPR/ Standard Floor Trader Pivots based on the high, low and close of today session. Likewise, it works for higher timeframes taking into account the high, low, close of the period (e.g. weekly, monthly, year).
Just be aware that -regardless of the timeframe- if the period is still in development, the indicator will constantly/ live update the values until the period is closed!! This indicator is meant to be used when preparing for the next trading period. If you want to use it live, I'd suggest using the function of this indicator which allows to display only current/closed pivots-
Similar to other script I published, this indicator lower timeframes (Daily and Weekly) will work with lower timeframe bars, this is the Minutes and Hour bars. Conversely, higher timeframe CPR/Pivots will work better with timeframes/charts from Daily and above.
Available tick/untick functions:
- Select timeframe
- Show current CPR & Support/Resistance
- Show tomorrow CPR & Support/Resistance
- Display historical CPR (CPR only)
- Show extended support and resistance lines (S2,S3,R2,R3) for current and future pivots.