Replay CountdownDisplays countdown for current bar in Replay mode.
Optionally also displays the current replay time in the exchange timezone.
Countdown

EAB: Earnings CountdownEAB: Earnings Countdown displays a compact table showing the number of days remaining until the next earnings release for the current symbol, using TradingView’s built-in earnings data.
Features
• Displays a clear countdown to the next earnings date.
• Configurable alert thresholds based on remaining days.
• Custom messages for earnings day, 1 day before, alert range and normal mode.
• Fully customizable colors, text size and table position.
How to use
1. Select the table position and visual style from the settings.
2. Define how many days before earnings should trigger an alert.
3. Customize the messages displayed for each countdown state.
Notes
• Earnings data is provided by TradingView.
• If no upcoming earnings are available, a default message is shown.
• Informational indicator only; no trading signals are generated.

HTF Candle Time Left (1m/2m/3m/5m/15m) + HV Color per TFWhat it shows:
Countdown for:
1m, 2m, 3m, 5m, 15m candles
Each row displays:
TF: M:SS (example: 5m: 01:23)
Color logic:
Red text = less than 10 seconds left before that candle closes
Orange (or your chosen color) = that timeframe is currently on a high-volume bar
White = normal
You can:
Turn each timeframe on/off
Move the table to any corner of the chart
Match the high-volume settings to your other volume indicator
Perfect if you scalp or day trade and want to:
Time entries to HTF candle closes
See when a big move is loading on 3m/5m/15m
React faster when volume and time line up.

DeMARK 9-13For the first time ever, the power and precision of DeMARK is now available on TradingView. Combining core elements of the renowned Sequential® and Combo® studies, the DeMARK 9-13® indicator delivers the same unique insights in a streamlined interface.
The Sequential and Combo family of indicators have been trusted by the top financial firms, funds and figures for decades to enhance their trading and investment strategies. Known for their 9 Setup® and 13 Countdown® readings, these studies are designed to highlight potential market reversals as well as key areas of support, resistance and momentum. With DeMARK 9-13, users can access these groundbreaking techniques in one integrated offering.
While it's often said, "the trend is your friend," it's also crucial to recognize when it's about to end. Identifying potential market inflection points allows you to buy weakness and sell strength, improving your cost basis, reducing risk and allowing you to capitalize on a greater portion of the reversal.
At its core, 9s and 13s are constructed to measure market momentum and exhaustion. Both Sequential and Combo consist of two phases: Setup and Countdown. The Setup phase compares price activity across nine consecutive bars to define the market environment, while the Countdown phase performs a separate 13-bar comparison to indicate when a reversal may be imminent. A 9-13 reading reflects the fulfillment of both phases. When combined with TDST® lines and Risk Levels®, this approach provides a more comprehensive view of the market.
The DeMARK 9-13 indicator consists of:
Sequential
Combo
9 Setup
13 Countdown
TD Setup Trend (TDST)
Perfected® Setup
Risk Levels & Zones
Together, these elements provide an unparalleled view into the inner workings of the market, helping you anticipate shifts and act with greater precision.
🟡 DESCRIPTION
SETUP
The initial stage of the DeMARK 9-13 indicator is the Setup phase. This series is the same for both Sequential and Combo and compares the close of the current bar to the close four bars earlier. Buy Setup counts are displayed in blue below the data set and fulfilled when there are nine consecutive closes less than the close four bars earlier. Sell Setup counts are displayed in blue above the data set and fulfilled when there are nine consecutive closes greater than the close four bars earlier.
During the active Setup, all number counts remain visible to show the progress of the series. Upon completing the Setup, the 9 is recorded and the 1-8 counts are removed. This reduces visual distraction and allows for more result history (due to TradingView’s 500-label limit). Setups are always counting, with Price Flips® occurring as the series alternates between Buy and Sell Setups.
PERFECTED SETUPS
Setups can be classified as either “Perfected” or “Imperfected.” The Setup is Perfected when the 9 is completed and the 6 and 7 bars have been exceeded. In the case of a Buy Setup, the low of bars 8 or 9 must be less than the low of bars 6 and 7. Conversely, in the case of a Sell Setup, the high of bars 8 or 9 must be greater than the high of bars 6 and 7. The point at which the Setup is perfected is displayed with a solid blue dot, matching the color of the Setup series.
Generally speaking, the market will reverse or stabilize within one to four bars of a completed and Perfected Setup 9. The strength and duration of this response can be assessed with the implementation of other indicators, such as TDST® lines.
TD SETUP TREND (TDST)
The TDST indicator is derived from the Setup phase and is used to confirm market trends and identify likely trend failures. A TDST resistance line is drawn from the highest true high of the completed 9 Buy Setup series, while a TDST support line is drawn from the lowest true low of the completed 9 Sell Setup series. These TDST lines provide an indication of market support, resistance and momentum to help evaluate the integrity of the move.
TDST lines are displayed in a lighter blue than the Setup phase. When Breakout Qualifiers are enabled, TDST lines can be considered qualified or disqualified. Disqualified TDSTs appear as a dashed line, indicating potential support in the case of TDST support lines or resistance in the case of TDST resistance lines. Qualified TDSTs appear as a solid line and will stop drawing when a breakout or breakdown occurs, suggesting continued momentum.
COUNTDOWN
Once the Setup phase is completed, the second stage of the DeMARK 9-13 indicator can begin — the Countdown phase. Sequential and Combo share the same Setup series, but there are subtle differences in their respective Countdown phases, each constructed to identify areas of potential trend exhaustion in different market conditions.
Sequential is designed to respond in both trending and consolidating markets, while Combo is more responsive in trending environments and inactive during periods of market consolidation. For that reason, we often say that Combo identifies the highest or lowest points of a move, with Sequential identifying secondary tests. When aligned, these results are even more powerful.
SEQUENTIAL COUNTDOWN
A Sequential Buy Countdown is possible upon completion of a Buy Setup and looks for 13 closes less than or equal to the low two bars earlier. Sequential Buy Countdown counts are displayed as a dark green number below the data set and can begin as early as the 9 bar of a completed Buy Setup. A Sequential Sell Countdown is possible upon completion of a Sell Setup and looks for 13 closes greater than or equal to the high two bars earlier. Sequential Sell Countdown counts are displayed as a dark red number above the data set and can begin as early as the 9 bar of a Sell Setup. Because of this overlap, Sequential Countdown requires as few as 12 bars beyond the 9 Setup to complete the cycle.
Unlike the Setup phase, Countdown counts need not be consecutive. During the active Countdown, all number counts remain visible to display the progress of the series. Upon completing the Countdown, the 13 is confirmed and the 1-12 counts are removed. This reduces visual distraction and allows for more result history (due to TradingView’s 500-label limit).
A completed Sequential 13 Countdown marks the fulfillment of the 9-13 reading and identifies potential market exhaustion. Additional elements of Sequential Countdown like Intersection, Countdown Deferral, Risk Levels and the 12-bar rule can be used to provide further detail and are outlined below.
COMBO COUNTDOWN
A Combo Buy Countdown is possible upon completion of a Buy Setup and looks for 13 closes less than or equal to the low two bars earlier, with additional rules based on the Combo version selected. Combo Buy Countdown counts are displayed as a light green number below the data set and can begin as early as the 1 bar of a completed Buy Setup. A Combo Sell Countdown is possible upon completion of a Sell Setup and looks for 13 closes greater than or equal to the high two bars earlier, with additional rules based on the Combo version selected. Combo Sell Countdown counts are displayed as a magenta number above the data set and can begin as early as the 1 bar of a Sell Setup. Because of this overlap, Combo Countdown requires as few as four bars beyond the 9 Setup to complete the cycle.
Unlike the Setup phase, Countdown counts need not be consecutive. During the active Countdown, all number counts remain visible to display the progress of the series. Upon completing the Countdown, the 13 is confirmed and the 1-12 counts are removed. This reduces visual distraction and allows for more result history (due to TradingView’s 500-label limit).A completed Combo 13 Countdown marks the fulfillment of the 9-13 reading and identifies potential market exhaustion. Additional elements of Combo Countdown like Risk Levels and the 12-bar rule can be used to provide further detail and are outlined below.
RISK LEVELS
When a 9 Setup or 13 Countdown indication is recorded, a Risk Level is generated to identify the zone within which a reversal should occur. This level accounts for any residual trend momentum without invalidating the buy or sell indication. For a completed buy indication, the Risk Level marks the price above which the 9 or 13 remains active and serves as additional support. Conversely, for a completed sell indication, it marks the price below which the 9 or 13 remains active and serves as additional resistance. This level can be viewed as the maximum threshold the indication can withstand before the prevailing momentum overwhelms and negates it and is often used to establish stop-loss areas.
Risk Level line colors correspond to the completed Setup, Sequential Countdown or Combo Countdown that generated it. Shaded risk zones can also be displayed, further highlighting the indication window. When Breakout Qualifiers are enabled, the Risk Level can be considered qualified or disqualified. Disqualified Risk Levels appear as a dashed line, indicating likely support in the case of a buy indication and likely resistance in the case of a sell indication. Qualified Risk Levels appear as a solid line and will stop drawing when a breakout or breakdown occurs, suggesting continued momentum.
4-BAR & 12-BAR METRICS
Generally speaking, the market should see some sort of response within four bars of a completed 9 Setup indication and 12 bars of a completed 13 Countdown indication. If the chart has not responded in that time the existing trend is likely to continue.
INTERSECTION
Intersection is an elective setting unique to Sequential Countdown. When enabled, it postpones the start of the Countdown phase until the price range of the later Setup counts overlap with the price activity of any Setup count occurring three or more bars earlier. This is intended as a pressure release to avoid commencing the count during an extraordinary breakaway market event or aberration. The Intersection level’s color matches its corresponding Buy and Sell Countdown reading and is displayed as a horizontal line on the confirming bar.
COUNTDOWN DEFERRAL
The Sequential Countdown phase of the DeMARK 9-13 indicator includes two optional Countdown Deferral qualifiers — the 13 vs. 8 rule and the 8 vs. 5 rule.
The 13 vs. 8 Countdown Deferral rule is designed to ensure that the tail end of the Countdown is representative of the existing trend. To fulfill this restriction, the low of the 13 bar must be less than or equal to the close of the 8 bar in the case of a Sequential Buy Countdown, while the high of the 13 bar must be greater than or equal to the close of the 8 bar in the case of a Sequential Sell Countdown. Because Countdown counts can increment in a sideways market, this rule helps to confirm that a trend has remained intact and improves accuracy as the series reaches its completion.
When enabled, this Countdown Deferral condition substitutes a “+” for what would otherwise be a “13,” thereby postponing the count. A Sequential Buy Countdown deferral is displayed in dark green below the data set, while a Sequential Sell Countdown deferral is displayed in dark red above the data set. Note that this optional setting is enabled by default and labeled “Last vs. 8 Qualifier” in the DeMARK 9-13 indicator settings.
Whereas the 13 vs. 8 rule is designed to ensure that the tail end of the Sequential series is representative of the existing trend, the 8 vs. 5 Countdown Deferral rule is designed to ensure that the body of the Countdown phase is properly configured. As with the 13 vs. 8 rule, the 8 vs. 5 rule matches the color and placement of its corresponding Buy or Sell Countdown series and substitutes a "+" for what would otherwise be an "8," thereby postponing the count. The 13 vs. 8 comparison is critical to the Countdown phase, while the 8 vs. 5 comparison is elective and provides additional confidence that the trend has remained intact.
COUNTDOWN RECYCLE®
Markets are constantly evolving to reflect new information. Just as fundamentals experience occasional adjustments impacting the expectations of the asset, so too do technical analysis and market timing. This is most often reflected in the Sequential and Combo Countdown phase by a process known as Recycling.
Recycling occurs when a Countdown 13 is interrupted by a subsequent overlapping “22” Setup count in the same direction. Recycling suggests that the new Setup is sufficiently strong to weaken the impact of a confirmed Countdown series and resets the process. A recycling indication is represented as an “R” where the Countdown 13 was previously displayed, matching the color and placement of that Buy or Sell Countdown series.
COUNTDOWN CANCELLATION
Once completed, a 9 Setup and 13 Countdown confirmation is permanent and never altered. However, it’s important to note that Countdowns can be cancelled during their construction phase. There are two scenarios where a Countdown series would be removed from the chart.
The first Countdown cancellation scenario occurs when a subsequent 9 Setup is confirmed in the opposite direction prior to the completion of the Countdown phase. The reasoning is that market conditions have changed from what they were when the initial Setup was fulfilled, making the newer Setup more relevant. Upon confirming an opposing 9 Setup, the incomplete Countdown phase is canceled and removed from the chart.
The second Countdown cancellation scenario takes place when the TDST in the opposite direction is violated, suggesting a conclusion to the previous trend and a confirmation of a new one. In these cases, a true low that occurs above the Buy Setup’s TDST resistance line, or a true high that occurs below the Sell Setup’s TDST support line, cancels the incomplete Countdown phase and removes the counts from the chart.
🟡 SETTINGS
DISPLAY
Setup : Displays the Setup phase of the Sequential and Combo indicators. The first swatch controls the color of the Buy Setup phase displayed below the data set. The second swatch controls the color of the Sell Setup phase displayed above the data set.
TDST : Displays the TDST lines for the Sequential and Combo indicators. The first swatch controls the color of the TDST resistance lines associated with the Buy Setup phase. The second swatch controls the color of the TDST support lines associated with the Sell Setup phase.
Sequential Countdown : Displays the Countdown phase of the Sequential indicator. The first swatch controls the color of the Buy Countdown phase displayed below the data set. The second swatch controls the color of the Sell Countdown phase displayed above the data set.
Combo Countdown : Displays the Countdown phase of the Combo indicator. The first swatch controls the color of the Buy Countdown phase displayed below the data set. The second swatch controls the color of the Sell Countdown phase displayed above the data set.
Indicator font size : Adjusts the size of the Sequential and Combo indicator counts displayed above and below the data set. ( Default: 18 )
Display full series count : Displays the full Sequential and Combo numerical series for the active 9 Setup and 13 Countdown phases only, or for all completed indications (within TradingView’s 500-label limit). ( Default: Active only )
SETUP
Bars to Setup : Number of consecutive bars needed to complete the Setup phase. ( Default: 9 )
Bars to look back : Defines the bar to which the current Setup count is compared. ( Default: 4 )
Setup compare : Determines whether equal prices should increment the Setup count. ( Default: Without equal )
Count completion weight : Adjusts the font weight of the Setup completion counts displayed above and below the data set. ( Default: Bold )
Setup Perfection : Identifies when Setup Perfection occurs, with the low of the final two Buy Setup counts less than the lows three or four bars prior to completion, and the high of the final two Sell Setup counts greater than the highs three or four bars prior to completion. With the default “Bars to Setup” setting of “9,” Perfection occurs when the low of Buy Setup bar 8 or 9 is less than the lows of bars 6 and 7, and the high of Sell Setup bar 8 or 9 is greater than the highs of bars 6 and 7. ( Default: Enabled )
Enable Setup Risk Level : Displays the Risk Level tied to the Setup. ( Default: On )
Enable Setup Risk Level Zone : Shades the area between the completed Setup and its Risk Level. ( Default: On )
TD SETUP TREND (TDST)
TDST line thickness : Adjusts the thickness of TDST support and resistance lines. ( Default: Standard )
COUNTDOWN (SHARED)
Bars to Countdown : Number of bars needed to complete the Countdown phase. ( Default: 13 )
Bars to look back : Defines the bar to which the current Countdown count is compared. ( Default: 2 )
Countdown comparison value : Output used in the Countdown look back comparison. For Aggressive settings, Low/High is required. ( Default: Close )
Termination Count price value : Allows the final count of the Countdown phase to use a different comparison value for more flexibility. ( Default: Open or Close )
Countdown compare : Determines whether equal prices should increment the Countdown count. ( Default: With equal )
Count completion weight : Adjusts the font weight of the Countdown completion counts displayed above and below the data set. ( Default: Bold )
SEQUENTIAL COUNTDOWN
Enable Intersection : Toggles the Sequential Intersection phase requirement. ( Default: Off )
8 vs. 5 Qualifier : Qualifier requiring the low of the 8 Buy Countdown to be less than the close of the 5 count, and the high of the 8 Sell Countdown to be greater than the close of the 5 count. ( Default: Off )
Last vs. 8 Qualifier : Qualifier requiring the low of the final Buy Countdown count to be less than the close of the 8 count, and the high of the final Sell Countdown to be greater than the close of the 8 count. With the default “Bars to Countdown” setting of “13,” the low of the 13 Buy Countdown would need to be less than the close of the 8 count, and the high of the 13 Sell Countdown would need to be greater than the close of the 8 count. ( Default: On )
Enable Risk Level : Displays the Risk Level tied to the Countdown. ( Default: On )
Enable Risk Level Zone : Shades the area between the completed Countdown and its Risk Level. ( Default: On )
COMBO COUNTDOWN
Combo version : Determines the version of Combo used for the Countdown phase, whether it’s Standard, Conservative or Aggressive. ( Default: Standard )
Enable Risk Level : Displays the Risk Level tied to the Countdown. ( Default: On )
Enable Risk Level Zone : Shades the area between the completed Countdown and its Risk Level. ( Default: On )
RECYCLE
Enable Recycle : Toggles Recycling, replacing the final Sequential and Combo Countdown count with an “R” when its rules are met. With the default “Bars to Countdown” setting of “13,” a recycled 13 count would be replaced with the ‘R’. ( Default: On )
Setup Count : Defines the number of consecutive Setup bars required to trigger a Recycle. ( Default: 22 )
CANCEL
Reverse Setup : Incomplete Countdowns are cancelled when a Setup in the opposite direction is confirmed. ( Default: On )
TDST Rule : Incomplete Buy Countdowns are cancelled when a true low exceeds the Buy Setup’s TDST resistance line, and incomplete Sell Countdowns are cancelled when a true high breaks the Sell Setup’s TDST support line. ( Default: On )
BREAKOUT QUALIFIERS
Enable Breakout Qualifiers : Breakout Qualifier rules will dictate whether TDST and Risk Level line breakouts can be considered qualified or disqualified. Qualified lines are solid and will stop drawing when a breakout or breakdown occurs, suggesting continued momentum. Disqualified lines are dashed, serving as resistance in the case of a false breakout and support in the case of a false breakdown. When Breakout Qualifier rules are disabled, a line becomes solid on any close beyond the level. ( Default: On )
🟡 DISCLAIMER
By subscribing to and or using DeMARK 9-13 or any other DeMARK Indicators on TradingView, you acknowledge that you have read, understood and agree to the DeMARK for TradingView Terms of Service (located in the DeMARK account signature) as well as any updates to those terms which may happen from time-to-time.
The DeMARK Indicators are powerful tools designed to assist the individual process you use to understand financial markets and make investment decisions but they are not trading systems. Any information presented is not, and should not be construed as, financial or investment advice. You should not make any investment decision based solely on the information provided by these tools. The products we offer do not recommend or endorse any specific securities, financial products or investment strategies. Any information, data or analysis presented by any DeMARK products or tools is generic and does not consider your personal financial situation, investment objectives or risk tolerance. All investment decisions are yours alone and are made at your own risk. Those risks include, but are not limited to, potential system errors, data inaccuracies or outages.
From time to time unauthorized and unaffiliated third parties use the DeMARK name or the names of our copyrighted and/or trademarked products in an unapproved, inaccurate and misleading manner. While we do our best to remove these examples, some fake, flawed and fraudulent may exist. The only official and accurate sources of our products are those listed on the DeMARK company website. Unauthorized reproduction, copying, scraping, republishing, distribution, dissemination or any other use of our name, trademarks and/or copyrighted materials (including this script documentation) is prohibited.
Without in any way limiting DeMARK’s exclusive rights under copyright, trademark and all other intellectual property protections, any use of DeMARK products to “train” generative artificial intelligence (AI) technologies to generate text is expressly prohibited. DeMARK reserves all rights to license uses of this work for generative AI training and development of machine learning language or machine learning visual models.
The data and analysis in our products are based on sources believed to be reliable, but DeMARK does not control or guarantee the accuracy, completeness or timeliness of this information.
As a DeMARK subscriber or user, you are responsible for conducting your own research and due diligence before making any investment decisions.
Past performance, including any simulated or historical data, is not indicative of future results.
Bezahltes Script

Simple Candle Countdown TimerDescription:
This lightweight and customizable TradingView indicator displays a real-time countdown timer for the current candle directly on your chart. The timer updates every second and shows the time remaining until the current candle closes, in the format MM:SS.
🔧 Features:
Adjustable X/Y offset to position the timer anywhere on the chart
Customizable text color, background color, and text size
Clear and minimal design for easy visibility
Ideal for scalpers, intraday traders, or anyone who wants precise awareness of candle close timing.

Earnings Date and CountdownOverview:
The Earnings Date & Countdown (EDC) Indicator displays the next earnings date for a stock and a countdown of days remaining until the earnings announcement. This helps traders stay informed about upcoming earnings events and adjust their strategies accordingly.
Features:
- Displays the next earnings date in a customizable format.
- Accurate countdown of days remaining until the earnings event (optional).
- Automatically adjusts for time zones and ensures the correct number of full calendar days.
- Customizable display position for easy visibility on the chart.
Settings:
- Show day of the week: option to toggle the day of the week.
- Date Format: choose between dd mmm, mmm dd, dd/mm or mm/dd.
- Show year: option to toggle the year display.
- Show (countdown): option to toggle the countdown display.
- Indicator position: adjusts the location of the display on the chart.
Why use this indicator?
Earnings reports often cause significant price movements.
This indicator helps traders plan ahead by keeping earnings dates visible and tracking the countdown with precision directly on the chart.

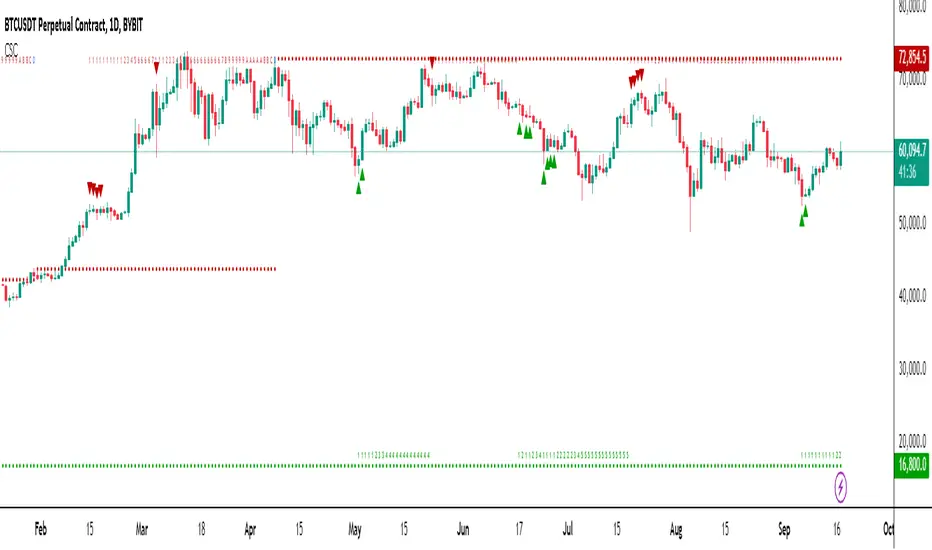
Chronos Sequential Compass (CSC)The Chronos Sequential Compass (CSC) is an advanced technical analysis tool used to identify potential price exhaustion points, trend reversals, and provide a framework for understanding market structure.
Key Components:
Setup Phase:
Bullish Setup: 9 consecutive closes lower than the close 4 bars earlier.
Bearish Setup: 9 consecutive closes higher than the close 4 bars earlier.
Visualized by green (bullish) or red (bearish) triangles on the chart.
Countdown Phase:
Starts after a Setup is completed.
Counts from 1 to 13(D), comparing the close to the low (for bullish) or high (for bearish) two bars earlier.
Displayed as numbers below (bullish) or above (bearish) the price bars.
Setups:
A Setup is complete when the low of bars 6 and 7 in a bullish Setup are exceeded by the low of bar 9.
For bearish Setups, the high of bars 6 and 7 must be exceeded by the high of bar 9.
Risk Levels:
Established when a Countdown reaches 13(D).
Acts as a reference point for potential trend reversals.
Countdown Delayed:
Indicated by a '+' symbol.
Occurs when a Countdown reaches 13(D) but doesn't meet specific criteria for completion.
Recycling:
Resets the Countdown if a strong opposite trend emerges during the Countdown phase.
How to Use the CSC:
Trend Identification:
Consecutive Setups in one direction indicate a strong trend.
Look for potential trend exhaustion when Setups start appearing in the opposite direction.
Potential Reversal Points:
Pay attention when a Countdown reaches 13, especially if it coincides with other technical factors (support/resistance, chart patterns, etc.).
A completed Countdown doesn't guarantee a reversal but suggests increased probability.
Risk Management:
Use Risk Levels as potential stop-loss points or profit-taking levels.
Be cautious of trades against the trend when price is far from the Risk Level.
Confluence with Price Action:
Look for candlestick patterns or chart formations at key Sequential levels for higher probability setups.
Timeframe Coordination:
Consider using CSC on multiple timeframes for a more comprehensive market view.
Higher timeframe signals often carry more weight.
Delayed Countdowns:
A delayed Countdown (indicated by '+') suggests the trend might continue.
It can provide opportunities for trend continuation trades.
Setup:
Setups often provide stronger signals and may lead to more significant moves.
Reversals should occur within 4 bars of setup signals
Completed Countdowns:
Reversals should occur within 12 bars of completed countdowns
4C Data Table SuiteOverview
The 4C Data Table Suite is a versatile TradingView indicator, designed for traders who focus on the critical role of prior bar levels in their strategy. By highlighting the high and low points of previous bars, this tool aids in pinpointing crucial support and resistance zones, which often act as psychological triggers for market participants. The unique feature of this indicator is its dual-color coding: it colors bars green for bullish closes and red for bearish closes in the Prior Bar Table, and for the current timeframe, it highlights whether the current price is above (green) or below (red) these levels.
Concepts
1 — This sophisticated indicator is not just about visual cues; it provides a rich tableau of data including:
• Current timeframe countdown to bar close
• GMT-adjusted clock for precise trade timing
• Real-time updates on market internals and volatility measures such as the NYSE TICK and ATR
2 — The configuration is highly customizable, allowing users to:
• Adjust the table's positioning and text size
• Choose color settings for text, background, and borders to suit their visual preference
• Toggle the display of various data components based on their trading needs
3 — The Prior Bar Table is particularly valuable for:
• Traders using prior bar levels as triggers for trade entries and exits
• Quick visual assessment of market sentiment
• Real-time decision-making supported by dynamic color coding based on current price movements relative to prior highs and lows
Features
• Prior Bar Levels Table: Visualizes high and low levels of prior bars with intuitive color coding, aiding traders in assessing market trends.
• Dynamic Color Coding: Updates colors based on the closure of the previous bar and current price positions relative to the past bar's highs and lows.
• Comprehensive Market Data: Includes a suite of essential data such as market internals, the prior bar’s range, and the latest price information.
• Customizable Visuals: Offers extensive options for customizing the appearance and data presented, ensuring the tool fits seamlessly into any trader's strategy.
How to Use
1. To add the indicator, search for "4C Data Table Suite" under indicators on TradingView and apply it to your chart.
2. Navigate to the indicator settings to customize the display properties, including table position, color schemes, and which data points to display.
3. Utilize the toggles within the "Prior Bar Levels Table" settings to adjust the visibility and behavior of the table, depending on your trading approach.
Limitations
• This indicator is optimized for use on time-based charts and may not perform as intended on tick charts or non-standard timeframes.
• The color coding is based on the closure of bars, which may not always reflect intrabar movements, potentially affecting real-time decision-making in highly volatile markets.
Notes
• Ensure your TradingView interface is set to the correct timezone settings to align the GMT clock accurately.
• The dynamic color updates are designed to provide at-a-glance insights but should be used in conjunction with other analysis tools for best results.
*If you find that the indicator is blocking some of the candles at the bottom of the screen, go to (Chart) Settings, Canvas, and then adjust the Bottom/Top margin by increasing the % Amount.
Thanks
Special thanks to the TradingView community and developers whose feedback and insights have helped refine the functionalities of the 4C Data Table Suite. Your collaborative spirit is what makes continuous improvement possible.

DaysToEarningsAn useful tool for investors/traders who want to keep track of upcoming earnings event.
Here's a breakdown of the indicator and its features:
Functionality:
#1 Displays the next earnings date for a company and additionally shows the number of days remaining until the earnings event.
#2 Offers three display modes:
Default: In this view both the earnings date and the number of days left is displayed
Head-less: A compact view without the headers
Mini-Mode: Super compact view, showing only the number of days
#3 Allows setting a custom baseline number of days. Based on this value the background color if the number of days in the indicator changes - red (if days remain is less than the number of days provided) else a gradient color in the shades of green.
As many stocks shows a drastic increase in volatility near the earnings date, this feature is very useful for visually being reminded of the days left.
***Lastly the footprint is very small making this important event reminder available on the chart without much fuss.***
Internals:
To calculate the days remaining until the earnings report, it uses the tv built-in variable "earnings.future_time" and uses a custom function for color grading.
How to use:
Once the indicator is applied on the chart you can input a custom number as reference day value. Based on this value the color coded background is generated for the days remaining to produce a visual impact - red (actual days remaining less than reference days) else its shades of green (gradient from lime to teal)
Next, choose the display modes (for default both "Head-less" and "Mini-Mode" is unchecked)
Finally choose the placement Top/Middle/Bottom + Center/Left/Right combination as per your convenience from the table options section.
I hope this tiny script adds value to your trading! Cheers :)

itradesize /\ Remaining Time - Candle close countdown A simple tool that displays the remaining time of M15, H1, H4, and D candles until they close.
Moreover, It works on all timeframes with all the exact data of the desired timeframe.
It can be such a useful tool when you using OHLC, AMD, and other theories. As you do not need to scrub back and forth through different timeframes to look for a bar close.
Notes:
• The Remaining Time Table only works in real time. It will show a “-“ sign, when you are in a replay mode.
This indicator has a Watermark section too where you can add your name/title/etc.. additionally, it shows the symbol, current timeframe, current date and you are able to customise them.

HTF Bar Close CountdownThis simple indicator displays a countdown for the amount of time left until a bar of your chosen timeframe closes.
Displays up to 5 different HTF countdowns.
Fully Customizable to fit any style, change the text colors, background colors, frame colors, display size and border & frame widths.
Flat display option for a sleek look to mesh with your charts.
Notes/Tips:
Higher Time Frames only! This is only intended to view HTF countdowns, will not work when trying to use a timeframe lower than your current chart's.
Some weird timeframes do not work, you'll know when.
Only works on live charts! Will display "Closed" when on an inactive chart.
Does not work for replay! A countdown is pretty pointless on a replay that is not real-time anyways...
Enjoy!
TWP Next Bar Close Countdown█ OVERVIEW
This script displays the time remaining for your charts current timeframe.period or a higher timeframe with the ability to create alerts that ping on the opening of the new bar that you have selected. It can be very easy to get bogged down in the charts when day trading on smaller timeframes and forgetting that it is the wave of longer timeframe traders that are setting the tone. This script was born out of this pitfall that I was noticing in my own trading.
█ CONCEPTS
The script uses a series of functions to get produce the time remaining and texts for the top and bottom rows within the table display.
█ FEATURES
1 — Resolution
• Auto / Manual selection
• There is tooltip explains how the automatic time selection operates (see below)
AUTO_TIMEFRAME_TOOLTIP = "When the Auto option is selected, the timeframe of the indicator is chosen automatically based on the chart timeframe. The Timeframe dropdown is ignored. The automated timeframes are:
'10 minutes' for any chart timeframes below '1 minute'
'1 hour' for any chart timeframes starting from '1 minute' up to '5 minutes'
'4 hours' for any chart timeframes starting from '5 minutes' up to '60 minutes'
'1 day' for any chart timeframes starting from '1 hour' up to '4 hours'
'1 week' for any chart timeframes starting from '4 hours' up to '1 day'
'1 month' for any timeframes starting from '1 day' up to '1 week'
'3 months' for any timeframes starting from '1 week' up to '1 month'
'12 months' for any timeframes above '1 month'"
2 — Text
• Size selection
• Color selection
3 — Display
• Frame color selection
• Display position selection
4 — Alerts
• Market session selection
█ HOW TO USE
• Add it to your chart, select your timeframe, change up your colors, and enjoy yourself
█ NOTES
• We have no control over when realtime updates occur. A realtime bar can open, and then no realtime updates can occur until the open of the next realtime bar. The time between updates can vary considerably. For more please check out Pine's execution model and bar states.
• As a reminder, I did make this script for myself so if you find that you are using a 2-hour alert or countdown the formatting for the words may not be succinct as they should be. We will write that loss off to my growing pine skills
█ LIMITATIONS
• You will not be able to retrieve the time from a timeframe smaller than what is currently selected for the chart.
