АЗЪ 3.610 - Squeeze Momentum + ADX + FastTF + Alerts + PnLStrata genius squeeze momentum + tester + adx +fast tf
Concept

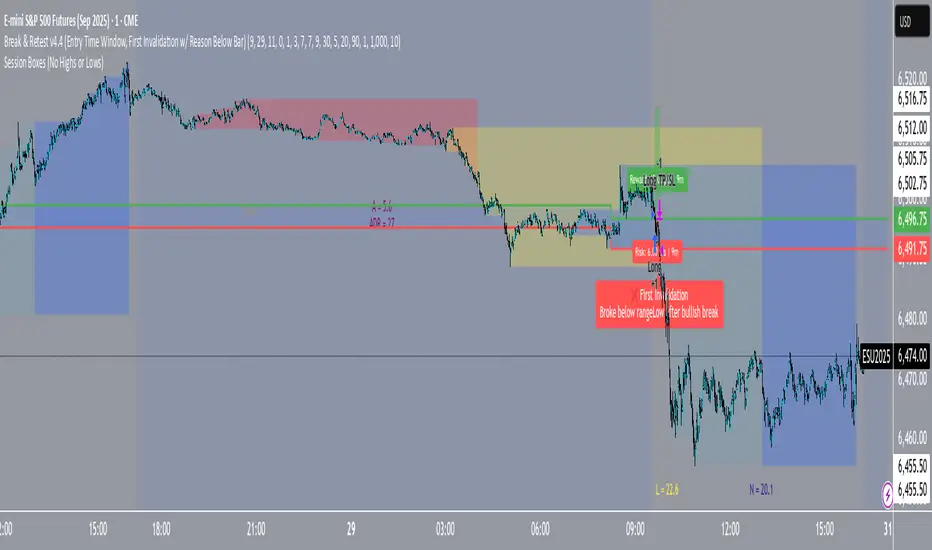
Break & Retest of ORB (Backtesting)Break & Retest v4.5 — What it does
Goal: Trade a single “break + retest” of the configurable Opening Range (OR) during a specific time window, with clean risk/return control and optional volume and side filters.
1) Define today’s Opening Range
You choose the OR start time (Eastern Time) and the OR length in minutes (e.g., 9:30–9:45 ET).
At the first bar of that OR window (on the chosen OR resolution), the script captures:
Range High (ORH) and Range Low (ORL).
The OR is drawn with configurable line and fill colors.
2) Detect the first clean break
After the OR is set, the script waits for the first breakout past ORH or ORL.
The break must move at least minBreakPts and at most maxBreakPts beyond the boundary (keeps out tiny pokes and runaway moves).
If price first breaks above ORH, we mark a bullish break.
If price first breaks below ORL, we mark a bearish break.
3) Wait for the retest (entry signal)
From the breakout bar, a retest window opens for a fixed number of 1-minute bars: between minRetestBars and maxRetestBars.
Inside that window:
Long setup (after bullish break): we require a bar whose low trades back into the range (between ORL and ORH). That is the “retest”.
Short setup (after bearish break): we require a bar whose high trades back into the range.
Entries can be restricted to a custom entry time window (ET) and optionally gated by a minimum volume.
You can enable/disable longs or shorts independently.
4) Invalidation (one-time alert)
If a bullish break later sees price dip below ORL, or a bearish break later sees price pop above ORH, the script flags a “First Invalidation” and prints a label once (with the reason).
This is informational; it doesn’t auto-lock the system, but it’s a strong “structure broken” signal.
5) Risk & reward
Stop loss (points) can be:
Default: (ORH − ORL) + 1 point, capped at stopLossCap, or
Custom fixed number of points.
Take profit (points) can be:
Default: RR × SL (not less than minTPpts), or
Custom fixed (capped by maxTPpts logic in the input).
When a trade fires, the script draws risk/reward boxes from the entry candle forward and (optionally) shows live R:R labels updating over time.
6) Limits and session management
Daily entry cap: At most maxRetestsPerDay retest entries per day.
Forced exit: Close any open position at a custom ET time (e.g., 12:00 ET).
Daily reset: At 00:00 ET, the strategy resets its internal state for the new session (drawings remain on the chart).
7) Visuals & alerts
OR high/low lines and the fill are color-configurable.
Risk/Reward boxes and their transparency are configurable.
A one-time alert fires on the first invalidation of the day.
TL;DR workflow
Build the OR at your chosen time and length.
Wait for the first valid break (not too small/large).
Look for a timely retest back into the range (long: bar low inside range; short: bar high inside range), within your entry window and volume filter.
Enter with your chosen SL/TP scheme; track boxes and (optionally) live R:R labels.
Respect the daily cap and force-exit time; reset at midnight ET.

US100 Liquidity Precision StrategyScalping strategy 5-10 point sl / 17 points tp
Automatic BE
Consistent money over time

Elliott Wave Oscillator + PSAR + VolumeStrategy Logic
1. Indicators
Elliott Wave Oscillator (EWO): This oscillator measures the difference between a 5-period and a 35-period exponential moving average (EMA). It's used to identify momentum shifts and potential wave structures. A buy signal is triggered when the EWO crosses above its signal line (a 5-period simple moving average). A sell signal is triggered when it crosses below.
Parabolic SAR (PSAR): This indicator shows potential reversals in price direction. A buy signal requires the PSAR to be below the current price, indicating an uptrend. A sell signal requires the PSAR to be above the current price, indicating a downtrend.
Volume: The strategy checks for significant changes in volume compared to its 20-period simple moving average (SMA). A buy signal requires a volume increase of at least 20% above the SMA. A sell signal requires a volume decrease of at least 20% below the SMA.
EMA 200: This long-term moving average is used to determine the overall market trend. A buy signal is only considered when the EMA 200 is rising (uptrend). A sell signal is only considered when the EMA 200 is falling (downtrend).
2. Entry and Exit Conditions
Long (Buy) Entry: A long position is entered if all of the following conditions are met:
EWO crosses its signal line upwards.
PSAR is below the price.
Volume has increased significantly.
The EMA 200 is rising.
The current candle is a bullish candle (close > open).
Short (Sell) Entry: A short position is entered if all of the following conditions are met:
EWO crosses its signal line downwards.
PSAR is above the price.
Volume has decreased significantly.
The EMA 200 is falling.
The current candle is a bearish candle (close < open).
Exit Conditions: Both long and short positions have a fixed 1% take profit and a 1% stop loss to manage risk.
In summary, the strategy only enters trades when a combination of momentum (EWO), trend (PSAR, EMA 200), and volume indicators align in the same direction, with strict risk management in place.

ARSI – (VWAP & ATR) 3QKRAKThe ARSI Long & Short – Dynamic Risk Sizing (VWAP & ATR) indicator combines three core components—an adjusted RSI oscillator (ARSI), Volume‐Weighted Average Price (VWAP), and Average True Range (ATR)—so that entry/exit signals and position sizing are always tailored to current market conditions. ARSI, plotted from 0 to 100 with clearly marked overbought and oversold zones, is the primary signal driver: when ARSI falls below the lower threshold it indicates an excessive sell‐off and flags a long opportunity, whereas a break above the upper threshold signals overextended gains and foreshadows a short. A midpoint line at 50 can serve as an early exit or reduction signal when crossed against your position.
VWAP, showing the volume‐weighted average price over the chosen period, acts as a trend filter—long trades are only taken when price sits above VWAP, and shorts only when it’s below—ensuring each trade aligns with the prevailing market momentum. ATR measures current volatility and is used both to set safe stop‐loss levels and to dynamically size each position. In practice, this means positions automatically shrink in high‐volatility environments and grow in quieter markets, all while risking a fixed percentage of your capital.
Everything appears on a single chart: the ARSI pane below the price window with its reference levels; VWAP overlaid on the price; and the ATR‐based stop‐loss distances graphically displayed. Traders thus get a comprehensive, at-a-glance view of entries, exits, trend confirmation, and exactly how large a position they can safely take. The indicator runs in real time, removing the need for manual parameter calculations and letting you focus on strategic decision-making.

Gold Pro StrategyHere’s the strategy description in a chat format:
---
**Gold (XAU/USD) Trend-Following Strategy**
This **trend-following strategy** is designed for trading gold (XAU/USD) by combining moving averages, MACD momentum indicators, and RSI filters to capture sustained trends while managing volatility risks. The strategy uses volatility-adjusted stops to protect gains and prevent overexposure during erratic price movements. The aim is to take advantage of trending markets by confirming momentum and ensuring entries are not made at extreme levels.
---
**Key Components**
1. **Trend Identification**
- **50 vs 200 EMA Crossover**
- **Bullish Trend:** 50 EMA crosses above 200 EMA, and the price closes above the 200 EMA
- **Bearish Trend:** 50 EMA crosses below 200 EMA, and the price closes below the 200 EMA
2. **Momentum Confirmation**
- **MACD (12,26,9)**
- **Buy Signal:** MACD line crosses above the signal line
- **Sell Signal:** MACD line crosses below the signal line
- **RSI (14 Period)**
- **Bullish Zone:** RSI between 50-70 to avoid overbought conditions
- **Bearish Zone:** RSI between 30-50 to avoid oversold conditions
3. **Entry Criteria**
- **Long Entry:** Bullish trend, MACD bullish crossover, and RSI between 50-70
- **Short Entry:** Bearish trend, MACD bearish crossover, and RSI between 30-50
4. **Exit & Risk Management**
- **ATR Trailing Stops (14 Period):**
- Initial Stop: 3x ATR from entry price
- Trailing Stop: Adjusts to lock in profits as price moves favorably
- **Position Sizing:** 100% of equity per trade (high-risk strategy)
---
**Key Logic Flow**
1. **Trend Filter:** Use the 50/200 EMA relationship to define the market's direction
2. **Momentum Confirmation:** Confirm trend momentum with MACD crossovers
3. **RSI Validation:** Ensure RSI is within non-extreme ranges before entering trades
4. **Volatility-Based Risk Management:** Use ATR stops to manage market volatility
---
**Visual Cues**
- **Blue Line:** 50 EMA
- **Red Line:** 200 EMA
- **Green Triangles:** Long entry signals
- **Red Triangles:** Short entry signals
---
**Strengths**
- **Clear Trend Focus:** Avoids counter-trend trades
- **RSI Filter:** Prevents entering overbought or oversold conditions
- **ATR Stops:** Adapts to gold’s inherent volatility
- **Simple Rules:** Easy to follow with minimal inputs
---
**Weaknesses & Risks**
- **Infrequent Signals:** 50/200 EMA crossovers are rare
- **Potential Missed Opportunities:** Strict RSI criteria may miss some valid trends
- **Aggressive Position Sizing:** 100% equity allocation can lead to large drawdowns
- **No Profit Targets:** Relies on trailing stops rather than defined exit targets
---
**Performance Profile**
| Metric | Expected Range |
|----------------------|---------------------|
| Annual Trades | 4-8 |
| Win Rate | 55-65% |
| Max Drawdown | 25-35% |
| Profit Factor | 1.8-2.5 |
---
**Optimization Recommendations**
1. **Increase Trade Frequency**
Adjust the EMAs to shorter periods:
- `emaFastLen = input.int(30, "Fast EMA")`
- `emaSlowLen = input.int(150, "Slow EMA")`
2. **Relax RSI Filters**
Adjust the RSI range to:
- `rsiBullish = rsi > 45 and rsi < 75`
- `rsiBearish = rsi < 55 and rsi > 25`
3. **Add Profit Targets**
Introduce a profit target at 1.5% above entry:
```pine
strategy.exit("Long Exit", "Long",
stop=longStopPrice,
profit=close*1.015, // 1.5% target
trail_offset=trailOffset)
```
4. **Reduce Position Sizing**
Risk a smaller percentage per trade:
- `default_qty_value=25`
---
**Best Use Case**
This strategy excels in **strong trending markets** such as gold rallies during economic or geopolitical crises. However, during sideways or choppy market conditions, the strategy might require manual intervention to avoid false signals. Additionally, integrating fundamental analysis—like monitoring USD weakness or geopolitical risks—can enhance its effectiveness.
---
This strategy offers a balanced approach for trading gold, combining trend-following principles with risk management tailored to the volatility of the market.

TDGS Dynamic Grid Trading Strategy [CoinFxPro]Advanced Dynamic Grid Trading Strategy
Logic and Working Principle:
This strategy uses a dynamic grid system to support both long and short trades. Grid trading aims to capitalize on price fluctuations within a predefined range by executing buy and sell orders systematically. The system calculates grid levels based on a base price and dynamically trades within these levels.
Grid Levels:
Grid levels are calculated based on the initial price and the user-defined grid spacing percentage.
Long Mode: Buys when the price decreases and sells when the price increases.
Short Mode: Sells when the price increases and buys when the price decreases.
Grid Updates:
Grid levels are recalculated based on the market price when the price moves by a user-defined update percentage.
For example;
In Long mode, when the price shows an upward trend, that is, when it rises by the Grid Update Percentage specified by the user, Grid levels are recreated and trades are made according to the new grid levels. While the price and grid levels are updated according to the new price, the Stop level is also updated upwards and the stop is followed with the TrailingStop logic.
In short mode, the same system operates with reverse logic. In other words, as prices decrease downwards, the grids are updated downwards when the Grid update percentage determined by the user decreases. The stop level is also updated accordingly.
The difference of the strategy from other Gridbots is that the grid levels are automatically updated and the levels are recreated with the price percentage difference determined by the user. Old levels can be tracked on the chart.
As the price updates, the self-updating grid levels are updated upwards in long mode and downwards in short mode.
The number of buying lots and selling lots are separated, allowing both trading within the position and the opportunity to collect lots and increase the position.
When trading with the grid trading logic, when buying and selling between grids, there is no repeated purchase at the same level unless there is a sale at the upper grid level. In this way, each level will be traded within itself.
For example, in a long condition, when the price is going up, after deducting the selling lot from the buying lot at each level, the remaining lots will be collected while the price is going up and an opportunity will be provided from the price rise.
Different preferences have been added to the profit taking conditions, allowing the robot to continue or stop after profit taking, if desired.
The system, which acts entirely according to user parameters, constantly updates itself as long as it moves in the direction determined by itself, and in these conditions, transactions are carried out according to profit or stop conditions.
Parameters:
Grid Parameters:
Settings such as buy lot size, sell lot size, grid count, and grid spacing percentage allow flexibility and customization.
Risk Management:
Stop loss (%) and take profit (%) levels help limit potential losses and secure profits at predefined thresholds.
Objective:
The goal of this strategy is to systematically capitalize on market price fluctuations through automated grid trading. This method is particularly effective in volatile markets where the price oscillates within a specific range.
The strategy works with a complete algorithm logic, and in appropriate instruments (especially instruments with depth and transaction volume should be preferred), buying and selling transactions are made according to the parameters determined at the beginning, and if the conditions go beyond the conditions, the stop is made, and when the profit taking conditions are met, it takes profit and prices according to the determined value. When it is updated, the values are updated again and the parameter works algorithmically.
Risk Management Recommendations:
Initial Capital: Grid trading involves frequent transactions, so sufficient initial capital is essential.
Stop Loss: Always set stop loss levels to prevent significant losses.
Grid Count and Spacing: A higher number of grids provides more trading opportunities but using grids that are too close may increase transaction costs due to small price movements.
First of all, it is important for risk management that you choose instruments that have depth and high transaction volume.
Strategy results may differ as a result of the parameters entered. Therefore, before trading in your real account, it is recommended that you start real transactions after backtesting with different parameters.
If you are stuck on something, you can mention it in the comments.

DCA Alpha 1.0 Trading Tool for Dollar-Cost Averaging
Description:
DCA Alpha 1.0 is a precision-engineered trading tool designed to assist traders and investors in accumulating assets during market downturns. Using proprietary algorithms that combine momentum decay, extreme price deviation metrics, trend dynamics, divergence analysis, and mean regression, it identifies potential bottom extreme zones in various asset classes such as indices, stocks, crypto, and commodities.
This indicator highlights market conditions where assets are oversold, undervalued, or experiencing capitulation—providing disciplined, unleveraged dollar-cost averaging (DCA) opportunities. Ideal for long-term growth strategies, DCA Alpha 1.0 helps cut through market noise, pinpointing moments of peak fear and maximum reward potential.
Whether navigating volatile crypto markets, timing corrections in indices, or accumulating commodities, DCA Alpha 1.0 serves as a vital tool for mastering the art of buying low and building your assets up strategically.
Instructions:
Getting Started:
Add the Indicator:
Install DCA Alpha 1.0 on your TradingView chart.
Select your preferred asset class: stocks, indices, crypto, or commodities.
Choose an appropriate timeframe (e.g., daily or weekly for long-term DCA strategies).
Customize Inputs: Adjust the following settings to align with your strategy:
Percentage of Equity to Trade: Define the portion of your portfolio to allocate per signal (default: 1% equity).
Profit Target Percentages: Set thresholds for locking in gains (default: 50% on lower timeframes, 500% on higher timeframes).
Zones and Signals:
Extreme Negative Zones:
What It Represents:
These zones highlight conditions where prices are deeply oversold, indicating extreme bearish sentiment. The market is likely nearing a bottom, offering high-probability buying opportunities.
Entry Signals:
When the price enters these extreme negative zones, visual markers (e.g., green triangles or other indicators) will signal a potential buying opportunity. These moments are indicative of market exhaustion, signaling that a reversal could be imminent.
Momentum Decay & Divergence:
Momentum decay occurs when price movement slows over time. In extreme negative zones, if prices continue to fall but at a diminishing rate (e.g., decreased volume or a fading oscillator), it suggests weakening bearish momentum. This, coupled with bullish divergence (oscillator forming higher lows while price makes lower lows), signifies a reversal, making it an ideal point to consider dollar-cost averaging into the asset.
Neutral Zones:
What It Represents:
The neutral zone is a state of market equilibrium, where prices are neither overbought nor oversold. The market is in a balanced state, with no strong trend emerging.
Mean Regression:
In a neutral zone, the market is reverting to its mean or average price after overreacting in either direction. A price transition from extreme zones (overbought/oversold) to the neutral zone suggests a reversion to the market's long-term average, making this a period of reduced volatility and uncertainty.
Entering or Exiting Neutral Zones:
Traders should avoid entering or exiting positions during neutral zone conditions unless transitioning from an extreme zone (negative or positive). Transitioning from an extreme negative zone to neutral may suggest an opportunity to accumulate assets gradually, while a shift from neutral to an extreme negative zone may indicate a deeper correction and warrant caution.
Momentum Decay & Divergence (Exiting Neutral Zone):
If prices are rising but the oscillator shows lower highs (bearish divergence), and momentum is fading, this could signal a pullback. A transition out of the neutral zone in this context may prompt traders to hold off on new positions or consider profit-taking.
Extreme Positive Zones:
What It Represents:
Markets can also become overbought or overvalued. When price enters extreme positive zones, the asset may be overvalued, suggesting potential selling or a waiting period.
Exit Signals:
Red triangle indicators signal potential exit points when prices reach overbought conditions, signaling a time to lock in profits and reduce exposure.
Momentum Decay & Divergence (Exiting Positive Zone):
When prices are making new highs but momentum is weakening (momentum decay) and the oscillator is showing lower highs (bearish divergence), this could indicate a faltering rally. Such conditions represent an ideal time to reduce exposure or exit positions.
Key Inputs for Customization:
Percentage of Equity to Trade:
This setting allows you to allocate a portion of your total portfolio per buy signal. By default, 1% of equity is used per signal, but this can be adjusted based on your risk tolerance and strategy.
Profit Target Percentages:
These thresholds help lock in gains once the price moves a set percentage in your favor.
Lower Timeframes: Default profit target of 50%.
Higher Timeframes: Default profit target of 500%.
These settings can be customized for specific risk/reward preferences.
Warning!!! : Aggressive Mode
Aggressive Mode is an advanced feature designed for traders who want to increase the frequency of signals during periods of market volatility. This mode will trigger more frequent entries, even into slightly less extreme zones, capturing short-term reversals.
What Aggressive Mode Does:
It amplifies signals by allowing the tool to identify more frequent price reversals, including brief market corrections, increasing trade frequency. While this can offer more trading opportunities, it also exposes you to higher risk.
Warning:
Aggressive Mode should be used only by experienced traders familiar with short-term volatility. The increased frequency of signals could lead to higher risk exposure. Ensure robust risk management practices, such as stop-loss orders and profit-taking strategies, are in place before activating this mode.
Default Setting:
Aggressive Mode is disabled by default. It can be activated at your discretion based on your experience level and risk appetite.
Best Practices:
Focus on High-Quality Assets: Prioritize assets with strong recovery potential (e.g., major indices, blue-chip cryptocurrencies).
Use Longer Timeframes: Minimize market noise and optimize your DCA strategy by focusing on higher timeframes (e.g., daily or weekly charts).
Review Trading Inputs: Regularly adjust your inputs to ensure they align with your financial goals and risk tolerance.
Implement Risk Management: Use stop-loss orders and profit targets to manage risk, especially when using Aggressive Mode.
Disclaimer:
DCA Alpha 1.0 is designed specifically for unleveraged, long-term dollar-cost averaging strategies. It is not intended for day trading or leveraged positions. The tool excels at identifying market dips but cannot guarantee success. Users are fully responsible for their own risk management, including the use of stop-losses, profit targets, and position sizing.
Aggressive Mode increases trade frequency and may lead to higher exposure and potential losses. Only experienced traders should consider using this mode. Always understand the risks involved before incorporating this tool into your trading strategy.

TrendGuard Scalper: SSL + Hama Candle with Consolidation ZonesThis TradingView script brings a powerful scalping strategy that combines the SSL Channel and Hama Candles indicators with a special twist—consolidation detection. Designed for traders looking for consistency in various markets like crypto, forex, and stocks, this strategy highlights clear trend signals, risk management, and helps filter out risky trades during consolidation periods.
Why Use This Strategy?
Clear Trend Detection:
With the SSL Channel, you’ll know exactly when the market is in an uptrend (green) or downtrend (red), giving you straightforward entry points.
Short-Term Trend Precision with Hama Candles:
By calculating unique EMAs for open, high, low, and close, the Hama Candles show the strength and direction of short-term trends. Combined with the Hama Line, it gives you a solid confirmation on whether the trend is strong or about to reverse, allowing for precise entries and exits.
Avoiding Choppy Markets:
Thanks to ATR-based consolidation detection, this strategy identifies low-volatility periods where the market is “choppy” and less predictable. During these times, a yellow background appears on the chart, warning you to hold off on trades, reducing the likelihood of entering losing trades.
Built-In Risk Management:
With adjustable Take Profit and Stop Loss levels based on price movements, you can set and forget your trades, with a safety net if the market turns against you. The strategy automatically closes positions if the price returns to the Hama Candle, keeping your risk low.
How It Works:
Long Position: When both the SSL and Hama indicators show a green trend, and the price is above the Hama Candles, the strategy opens a long position. Take Profit triggers at your chosen risk-to-reward ratio, while Stop Loss protects you just below the Hama Line.
Short Position: When both indicators align in red and the price is below the Hama Candles, the strategy opens a short. Similar to longs, Stop Loss is set just above the Hama Line, and Take Profit is at your defined level.
Start Trading Confidently
Test this strategy with different settings and discover how it can perform across various assets. Whether you're trading Bitcoin, forex pairs, or stocks, this system has the flexibility and robustness to help you spot profitable trends and avoid risky zones. Try it today on a 30-minute timeframe to see how it aligns with your trading goals, and let the consolidation detection guide you away from false signals.
Happy trading, and may the trends be with you! 📈

Hurst Future Lines of Demarcation StrategyJ. M. Hurst introduced a concept in technical analysis known as the Future Line of Demarcation (FLD), which serves as a forward-looking tool by incorporating a simple yet profound line into future projections on a financial chart. Specifically, the FLD is constructed by offsetting the price half a cycle ahead into the future on the time axis, relative to the Hurst Cycle of interest. For instance, in the context of a 40 Day Cycle, the FLD would be represented by shifting the current price data 20 days forward on the chart, offering an idea of future price movement anticipations.
The utility of FLDs extends into three critical areas of insight, which form the backbone of the FLD Trading Strategy:
A price crossing the FLD signifies the confirmation of either a peak or trough formation, indicating pivotal moments in price action.
Such crossings also help determine precise price targets for the upcoming peak or trough, aligned with the cycle of examination.
Additionally, the occurrence of a peak in the FLD itself signals a probable zone where the price might experience a trough, helping to anticipate of future price movements.
These insights by Hurst in his "Cycles Trading Course" during the 1970s, are instrumental for traders aiming to determine entry and exit points, and to forecast potential price movements within the market.
To use the FLD Trading Strategy, for example when focusing on the 40 Day Cycle, a trader should primarily concentrate on the interplay between three Hurst Cycles:
The 20 Day FLD (Signal) - Half the length of the Trade Cycle
The 40 Day FLD (Trade) - The Cycle you want to trade
The 80 Day FLD (Trend) - Twice the length of the Trade Cycle
Traders can gauge trend or consolidation by watching for two critical patterns:
Cascading patterns, characterized by several FLDs running parallel with a consistent separation, typically emerge during pronounced market trends, indicating strong directional momentum.
Consolidation patterns, on the other hand, occur when multiple FLDs intersect and navigate within the same price bandwidth, often reversing direction to traverse this range multiple times. This tangled scenario results in the formation of Pause Zones, areas where price momentum is likely to temporarily stall or where the emergence of a significant trend might be delayed.
This simple FLD indicator provides 3 FLDs with optional source input and smoothing, A-through-H FLD interaction background, adjustable “Close the Trade” triggers, and a simple strategy for backtesting it all.
The A-through-H FLD interactions are a framework designed to classify the different types of price movements as they intersect with or diverge from the Future Line of Demarcation (FLD). Each interaction (designated A through H by color) represents a specific phase or characteristic within the cycle, and understanding these can help traders anticipate future price movements and make informed decisions.
The adjustable “Close the Trade” triggers are for setting the crossover/under that determines the trade exits. The options include: Price, Signal FLD, Trade FLD, or Trend FLD. For example, a trader may want to exit trades only when price finally crosses the Trade FLD line.
Shoutouts & Credits for all the raw code, helpful information, ideas & collaboration, conversations together, introductions, indicator feedback, and genuine/selfless help:
🏆 @TerryPascoe
🏅 @Hpotter
👏 @parisboy

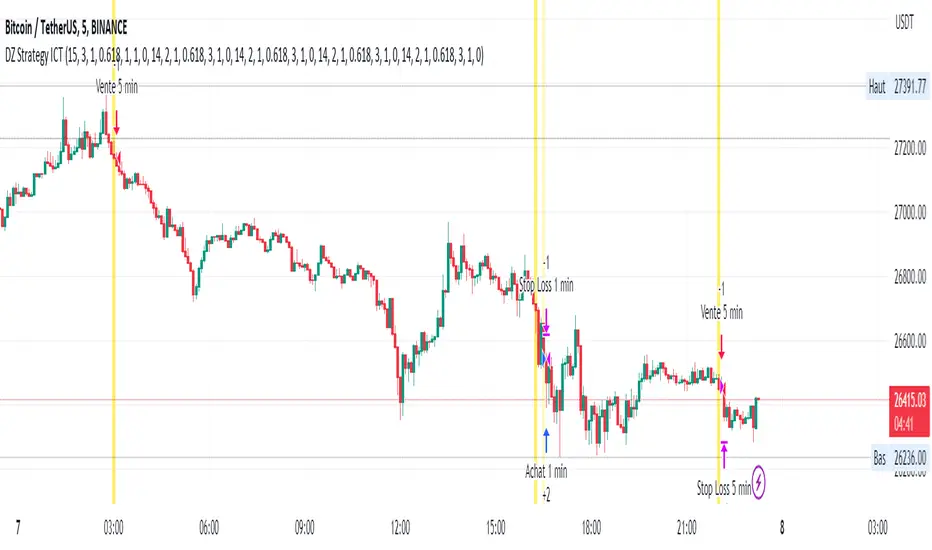
DZ Strategy ICTThe script presented is a trading strategy called "Breaker Block Strategy with Price Channel". This strategy uses multiple time frames (1 minute, 5 minutes, 15 minutes, 1 hour, and 4 hours) to detect support and resistance areas on the chart.
The strategy uses parameters such as length, deviations, multiplier, Fibonacci level, move lag and volume threshold for each time frame. These parameters are adjustable by the user.
The script then calculates support and resistance levels using the simple moving average (SMA) and standard deviation (STDEV) of closing prices for each time frame.
It also detects "Breaker Blocks" based on price movement from support and resistance levels, as well as trade volume. A Breaker Block occurs when there is a significant breakout of a support or resistance level with high volume.
Buy and sell signals are generated based on the presence of a Breaker Block and price movement from support and resistance levels. When a buy signal is generated, a buy order is placed, and when a sell signal is generated, a sell order is placed.
The script also plots price channels for each time frame, representing resistance and support levels.
Profit limit levels are set for each time range, indicating that the price levels assigned to positions should be closed with a profit. Stop-loss levels are also set to limit losses in the event of canceled price movements.
In summary, this trading strategy uses a combination of Breaker Block detection, support and resistance levels, price channels and profit limit levels to generate buy and sell signals and manage positions on different time ranges.
Anton ttt +Использовать при средней волатильности, просто наложив на график в учет взят фактор АТР а также движение относительной силы цены. Использовать внимательно не как основной инструмент торговли

[D] Dudu 95 Strategy Template ver.1.1.Hello Guys! Nice to meet you all!
This is my Second script after changing My Profile Name!
I updated my strategy template before - I added some filter conditions (EMA, ADX, DMI).
If there's something to update, I will update this script!
Thank you!
-----
I made this based on the open source strategies by jason5480, kevinmck100, myncrypto.
Thank you All!
### Filter
1. Can Choose whether to use filter.
2. Filters Based on ATR, EMA, ADX, and DMI are ready to use.
### StopLoss
1. Can Choose Stop Loss Type: Percent, ATR, Previous Low / High.
2. Can Chosse inputs of each Stop Loss Type.
### Take Profit
1. Can set Risk Reward Ratio for Take Profit.
- To simplify backtest, I erased all other options except RR Ratio.
- You can add Take Profit Logic by adding options in the code.
2. Can set Take Profit Quantity.
### Risk Manangement
1. Can choose whether to use Risk Manangement Logic.
- This controls the Quantity of the Entry.
- e.g. If you want to take 3% risk per trade and stop loss price is 6% below the long entry price,
then 50% of your equity will be used for trade.
2. Can choose How much risk you would take per trade.
### Plot
1. Added Labels to check the data of entry / exit positions.
2. Changed and Added color different from the original one. (green: #02732A, red: #D92332, yellow: #F2E313)

[fpemehd] Strategy TemplateHello Guys! Nice to meet you all!
This is my fourth script!
This is the Strategy Template for traders who wants to make their own strategy.
I made this based on the open source strategies by jason5480, kevinmck100, myncrypto. Thank you All!
### StopLoss
1. Can Choose Stop Loss Type: Percent, ATR, Previous Low / High.
2. Can Chosse inputs of each Stop Loss Type.
### Take Profit
1. Can set Risk Reward Ratio for Take Profit.
- To simplify backtest, I erased all other options except RR Ratio.
- You can add Take Profit Logic by adding options in the code.
2. Can set Take Profit Quantity.
### Risk Manangement
1. Can choose whether to use Risk Manangement Logic.
- This controls the Quantity of the Entry.
- e.g. If you want to take 3% risk per trade and stop loss price is 6% below the long entry price,
then 50% of your equity will be used for trade.
2. Can choose How much risk you would take per trade.
### Plot
1. Added Labels to check the data of entry / exit positions.
2. Changed and Added color different from the original one. (green: #02732A, red: #D92332, yellow: #F2E313)

[Strategy Alert Webhook Demo] Buy One Sell One Buy One Sell One
Two Options to send Alert Order via Webhook
1. Order fill events with `alert_message` on strategy.close(), strategy.entry(), strategy.exit() and strategy.order()
NOTE: Need to fill the Alert Creation box with `{{strategy.order.alert_message}}`
2. Send Alert through `alert()`

Martingale LOOKSUSDT 30MIN StrategyMy dear !
In the strategy itself:
The entry is made as a percentage of the deposit by price action.
The strategy will calculate the recent k-bar chart and place multiple orders according to the status of the bar。
There are additional purchases, they are set from the entry price for a given percentage in the opposite direction of the transaction.
The distance in percentage from the entry price, on which the additional purchase is exposed, is set in the Minopen parameter.
The Minopen parameter increases the initially purchased amount of the base traded cryptocurrency in each additional purchase.
The essence of the strategy is to trade a large number of pairs in order to diversify risks and obtain a stable income.
It is desirable to enter each trading pair with a small percentage of the deposit.
The optimization result shows the trading result for the period of 4800 bars (the platform does not give more history) on 5 of the deposit for the first transaction, the addition will also take place on initially bought amount of base traded cryptocurrency, multiplied by the martingale parameter, raised by the number of addition.

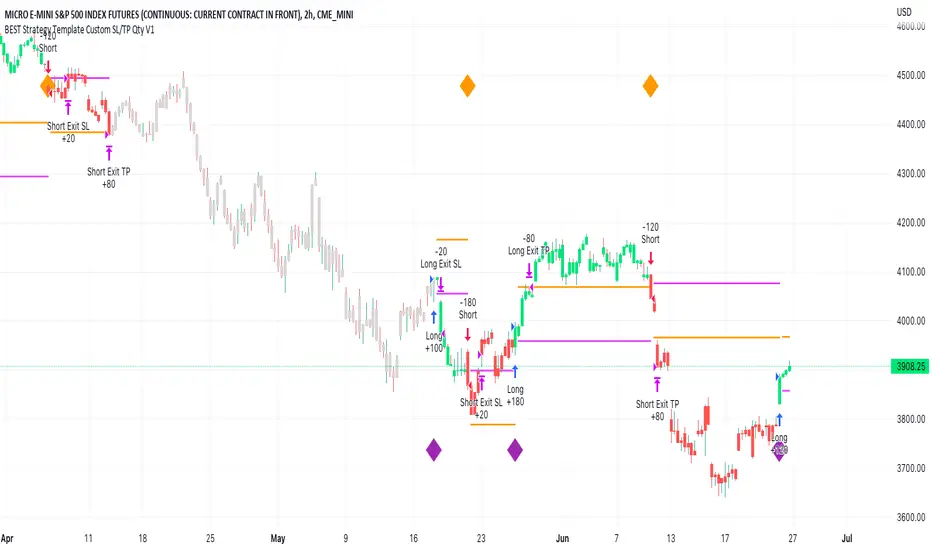
BEST Strategy Template w/ Custom SL/TP Size - EducationalHello traders
I'm getting this question at least once per week: "how to define a custom exit quantity for my stop loss and a different one for my take profit"
Instead of answering every day the same question in my DMs, I've decided to publish an educational strategy template script using this
Features
- Select to use or not the SL and/or TP
- Define how many pips/USD the SL/TP should be set at from the entry
- Define what quantity percentage you want to close at SL and/or at TP (lines 301 to 320 in the code)
- Classical custom trailing stop where the SL is moved to breakeven once the TP is hit
- Get real-time backtesting stats based on the options you've selected
Update
You might not know it yet but from last week (or maybe the week before), the qty/qty_percent from the strategy.exit function refers now to the initial position size (and not the remaining position size like before)
For example:
strategy.exit("EX1", qty_percent = 50, stop = constant)
strategy.exit("EX2", qty_percent = 20, stop = constant)
What happened before
After "EX1" reaches SL levels, "EX2" exits 20% from the % of the remaining position size.
If the initial position size = 100 contracts
EX1 exits 50 contracts
EX2 exits 20% of 50 contracts = 10 contracts
What's happening now
After "EX1" reaches SL levels, "EX2" exits 20% from the % of the original position size.
If the initial position size = 100 contracts
EX1 exits 50 contracts
EX2 exits 20 (20% of 100 contracts) contracts
I think this is an improvement and I really enjoy this new behavior.
See you in a few days with another post :)
ALL THE BEST
Dave