BlackCompositIndicator4OverlayThis is not new indicator.
// Candle Patterns Indicator created by Robert N. 030715
// Volume Indicator @author LazyBear
// Updated and translated by Blyayshman
Это не новый индикатор - это компиляция нескольких для удобства одновременного отображения и экономии разрешенных индикаторов.
Эта версия для отображения на главном экране, вместе с графиком.
Можно отобразить до 4-х MA, 2-х EMA и анализатор паттернов японских свечей.
Пожелания и предложения приветствуются.
Composite
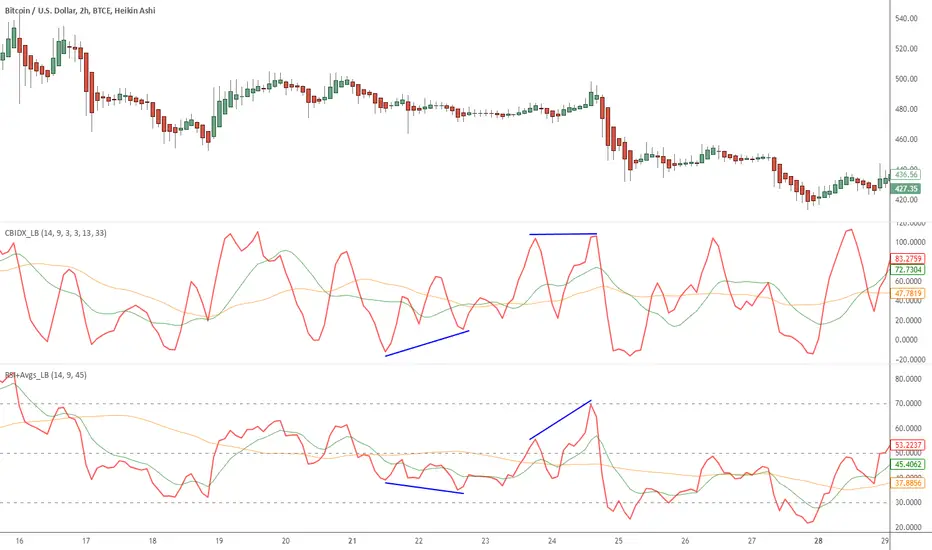
Indicators: Constance Brown Composite Index & RSI+AvgsI am a big fan of Constance Brown. Her book "Technical Analysis for Trading Professionals" is an absolute classic (get the 2nd edition).
I have included here 2 of the indicators she uses in all her charts.
Composite Index
----------------------------------------
This is a formula Ms Brown developed (Cardwell may not agree!) to identify divergence failures with in the RSI. This also highlights the horizontal support levels with in the indicator area.
This index removes the normalization range restrictions in RSI. This means it is not bound with in 0-100 range. Also, this has embedded momentum calculation in it.
The fine nuances of this indicator are not documented well enough, if you find some good documentation, do let me know. Always use this with RSI (like the next one).
RSI+Avgs
----------------------------------------
This is plain 14 period RSI with a 9-period EMA and 45-period SMA overlaid.