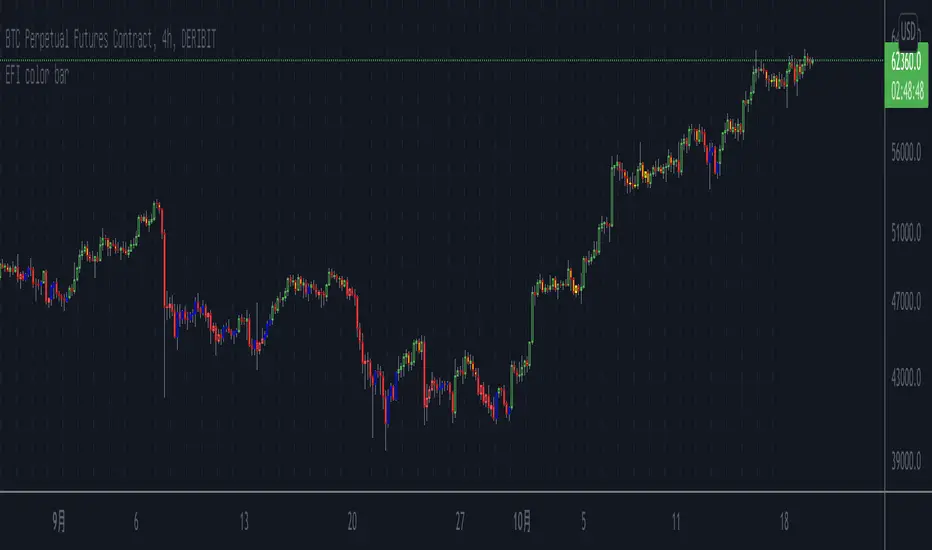
Elder's Force Index Color BarBased on the Elder's Force Index (EFI) , +/- of the EFI and its ema is used to describe the rise, fall or possible reversal of the market, and finally shown by bar color.
The green bar represents a strong bull and the red bar represents a strong bear;
The blue bar indicates that the downtrend is exhausted and may rise. Likewise the yellow bar.
Of course, it is difficult to buy the bottom and sell the top at any time. This indicator needs to be judged together with the pattern or other indicators that predict reversals in order to increase the win rate.
Happy Trading.
根据Elder's Force Index修改而成,取消了幅图指标,仅用bar color来表现上涨,下跌和转折。
绿色k线代表上涨动能充足,红色k线表示下跌动能充足;
蓝色k线表示下跌力竭,可能会上涨;
黄色k线表示上涨力竭,可能会下跌。
当然,任何时候抄底摸顶都是困难的,该指标需要和形态或者其他预测反转的指标一起判断才能增加成功率。
祝交易愉快。
緑は上昇トレンドで、赤は下落トレンドです;
青は下落が尽きて上昇する可能性があることを示すことで、黄色は上昇が終わり、下落の可能性があることを示しています。
成功率を高めるためには、パターンや反転を予測する他の指標と合わせて判断する必要があります。
Happy Trading。
Colorbar
Heatmap Volume ColorBar trial v7FTJR20 This indicator is a heatmap of financial volume by repainting the candlesticks, I use three different ways to define the heatmap separating it into 3 phases:
Phase A: low volume
Phase B: average volume
Phase C: high volume
Don't worry about this data, the trial indicator is configured to auto-interpret the information.
The heat map uses the following colors and specifications
Red = Ultra High Volume
Orange = High volume
Yellow = Average Volume (balance)
Blue = Low volume
White = Volume below average
The heat map compares the phases to identify if it finds a standard deviation over time, that is, it is possible to see a smaller volume with the same red bar as before, because the aggressions are updated in real time.
I also created a trend line moved by the accumulated volume x the average price, there will always be an important zone, where the long/short can defend or not their position.
Tutorial:
1.0 - It is necessary that you have the minimum knowledge of waves, a quick explanation is that the market always works in 5 (1 to 5) or in 3 waves (ABC).
1.1- The Concept: When identifying the 3 wave or the C wave with a red cadle and a spread 2 to 3x larger than the average, mark the bottom and top of this red cadle.
-Note that in the example I marked it and named it "Support 3"
Note 1: Note that I had already marked the "Support 1" line from the moment the asset went down.
This candlestick is important for two reasons, it is a red candlestick with ultra volume and it was the beginning of the bullish impulse, if there was a place for the buyer to defend it was there.
Note 2: We don't know if the top or bottom of the candle was a support or resistance, check, be patient, watch the movement inside this red cadle and what the color of the cadles will be in the movements.
1.2 - see that the market makes several zig zags within our marking, and the color of the cadles turned white and blue (low volumes) someone was acting passively (probably who absorbed the red bar, we don't know yet).
1.3 - see that the price comes very close to the trend line and as it approaches the price drops with an aggression at the end, see that the cadle turned orange, even with the aggression the price goes back up, at this moment we already see that there is someone buying and defending the position.
Note: red, orange and yellow candles are aggressors.
1.4 - In the marking of point , see that the price falls in the region of the orange bar...
*remember, aggression bars are important regions, tick!
Note that the price drops with blue and white bars, breaks the previous bottom without aggression, see that the bars are blue, the seller has been absorbed and the buyer starts to attack.
On this occasion, see how many factors led you to believe that there was institutional defense there, be patient and study the attitudes within the chart.
1.5 - look at point 2 we see the price breaking the trend line,
there was a resistance there was a lot of money, so another red bar, the market from the sequence on the high and stops exactly at the line marked with "support 3", there was a region to protect the operation, my stop is below the red bar near 35k , where there is defense.
1.6 - Sequence market in the move and test the "resistance 1" and feel offer, see the perfection of the corrective zig zag in (ABC) on top of the red bar "the biggest red bar" of that move in point 4.
-see market tests 2x the top of "support 3" and takes the bear out of the game.
1.7 - From point 4 onwards, the market of the bullish sequence with aggression an orange bar and at point 5 we have another red bar, that is, we are close to a new resistance, "resistance 2", at this time the market is above this red bar from point 5, it is still bullish, below it, it may seek the trendline and its breakout may seek the "support 1" line.
- I like your feedback and leave your settings and experiences in the comments.

Volatility BeltThe Volatility Belt is a Premium indicator which plots in the price chart a simple-to-read volatility color bar.
The indicator allows plotting multiple Volatility Studies, including:
Squeeze
Bollinger Bands Volatility
Volatility Index
TTM Squeeze
Historical Volatility
Additional volatility studies might be included down the road.
If you're interested in this one, please PM me.

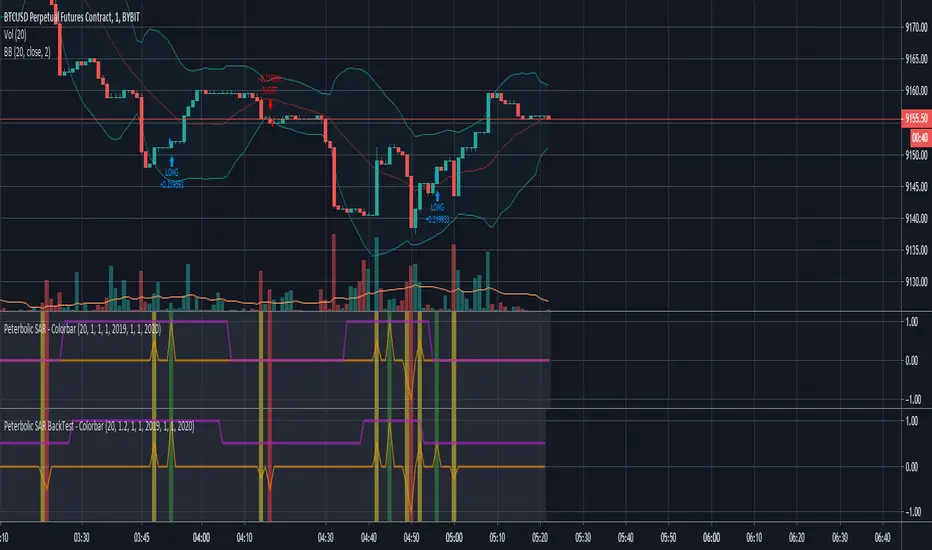
Peterbolic SAR - ColorbarIndicator with buy/sell alerts for setup/trigger conditions
Built upon Peterbolic SAR current version as of publishing

PB SAR BackTest - ColorbarIndicator with buy/sell alerts for setup/trigger conditions
Built upon Peterbolic SAR current version as of publishing
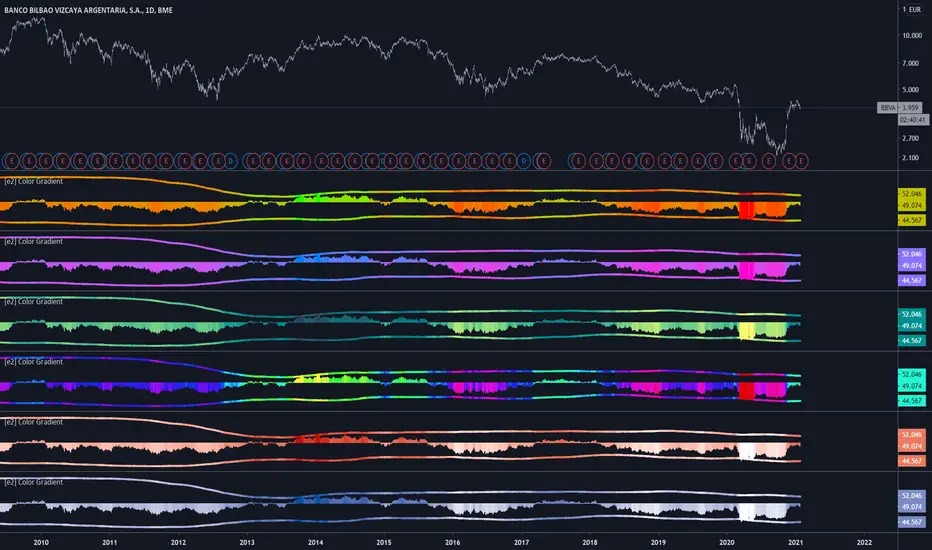
[e2] Color Gradient Function20 step red/green gradient function
The color gradient function allow colorize any source in 5% steps.
Define the source, minimum and maximum value (constant or , for example, bb (or any other channel)).
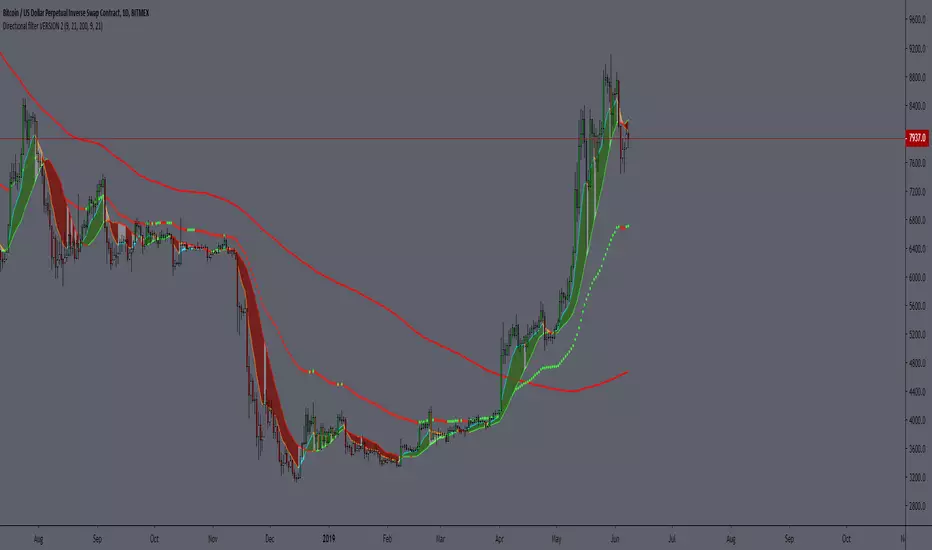
Directional filter VERSION 2The idea is to make it more visible if the moment is to seek buying or selling, based on moving averages, being SMA 21 and EMA 9.
best BUYBAR has the EMA9 and SMA21 rising and closing above them. "relevance A"
best SELLBAR has the EMA9 and SMA21 dropping and closing below them. "relevance A"
Conditions for all colors of the candlesticks:
BuyBar A = price closes above EMA9 and SMA21 with EMA9 and SMA21 rising.
BuyBar B = price closes above SMA21 with SMA21 rising OR price closes above EMA9 and SMA21.
BuyBar C = price closes above EMA9 with EMA9 rising and SMA21 falling.
BuyBar Neutral = close> open.
SellBar A = price closes below EMA9 and SMA21 with EMA9 and SMA21 falling.
SellBar B = price closes below SMA21 with SMA21 falling OR price closes below EMA9 and SMA21.
SellBar C = price closes below EMA9 with EMA9 falling and SMA21 rising.
SellBar Neutral = close abertura.
SellBar A = preço fecha abaixo de EMA9 e SMA21 com EMA9 e SMA21 caindo.
SellBar B = preço fecha abaixo de SMA21 com SMA21 caindo OU preço fecha abaixo de EMA9 e SMA21.
SellBar C = preço fecha abaixo de EMA9 com EMA9 caindo e SMA21 subindo.
SellBar Neutral = fechamento < abertura.
As medias moveis também alteram de acordo com a direção em que estão:
EMA 9 subindo = azul
EMA 9 caindo = laranja
SMA 21 subindo = verde
SMA21 caindo = vermelho