Climax Absorption Engine [AlgoPoint]Overview
Have you ever noticed that during a sharp, fast-moving trend, the single candle with the highest volume often appears right at the end, just before the price reverses? This is no coincidence. It's the footprint of a Climax Event.
This indicator is designed to detect these critical moments of maximum panic (capitulation) and maximum euphoria (FOMO). These are the moments when retail traders are driven by emotion, creating a massive pool of liquidity. The "Climax Absorption Engine" identifies when Smart Money is likely absorbing this liquidity to enter large positions against the crowd, right before a potential reversal.
It's a tool built not just on mathematical formulas, but on the principles of market psychology and smart money activity.
How It Works: The 3-Step Logic
The indicator uses a sequential, three-step process to identify high-probability reversal setups:
1. Momentum Move Detection: First, the engine identifies a period of strong, directional momentum. It looks for a series of consecutive, same-colored candles and confirms that the move is backed by a steeply sloped moving average. This ensures we are only looking for climactic events at the end of a significant, non-random move.
2. Climax Candle Identification: Within this momentum move, the indicator scans for a candle with abnormally high volume—a volume spike that is significantly larger than the recent average. This candle is marked on your chart with a diamond shape and is identified as the Climax Candle. This is the point of peak emotion and the primary area of interest. No signal is generated yet.
3. Absorption & Reversal Confirmation: A climax is a warning, not a signal. The final signal is only triggered after the market confirms the reversal.
- For a BUY Signal: After a bearish (red) Climax Candle, the indicator waits for a subsequent green candle to close decisively above the midpoint of the Climax Candle. This confirms that the panic selling has been absorbed by buyers.
- For a SELL Signal: After a bullish (green) Climax Candle, it waits for a subsequent red candle to close decisively below the midpoint. This confirms that the euphoric buying has evaporated.
How to Interpret & Use This Indicator
- The Diamond Shape: A diamond shape on your chart is an early warning. It signifies that a climax event has occurred and the underlying trend is exhausted. This is the time to pay close attention and prepare for a potential reversal.
- The BUY/SELL Labels: These are the final, actionable signals. They appear only after the reversal has been confirmed by price action.
- A BUY signal suggests that capitulation selling is over, and buyers have absorbed the pressure.
- A SELL signal suggests that FOMO buying is over, and sellers are now in control.
Key Settings
- Momentum Detection: Adjust the number of consecutive bars and the EMA slope required to define a valid momentum move.
- Climax Detection: Fine-tune the sensitivity of the volume spike detection using the Volume Multiplier. Higher values will find only the most extreme events.
- Confirmation Window: Define how many bars the indicator should wait for a reversal candle after a climax event before the setup is cancelled.
Climax

New Momentum H/LNew Momentum H/L shows when momentum, defined as the rate of price change over time, exceeds the highest or lowest values observed over a user-defined period. These events shows points where momentum reaches new extremes relative to that period, and the indicator plots a column to mark each occurrence.
Increase in momentum could indicate the start of a trend phase from a low volatile or balanced state. However in developed trends, extreme momentum could also mark potential climaxes which can lead to trend termination. This reflects the dual nature of the component.
This indicator is based on the MACD calculated as the difference between a 3-period and a 10-period simple moving average. New highs are indicated when this value exceeds all previous values within the lookback window; new lows when it drops below all previous values. The default lookback period is set to 40 bars, which corresponds with two months on a daily chart.
The indicator also computes a z-score of the MACD line over the past 100 bars. This standardization helps compare momentum across different periods and normalizes the values of current moves relative to recent history.
In practice, use the indicator to confirm presence of momentum at the start of a move from a balanced state (often following a volatility expansion), track how momentum develops inside of a trend structure and locate potential climactic events.
Momentum should in preference be interpreted from price movement. However, to measure and standardize provides structure and helps build more consistent models. This should be used in context of price structure and broader market conditions; as all other tools.

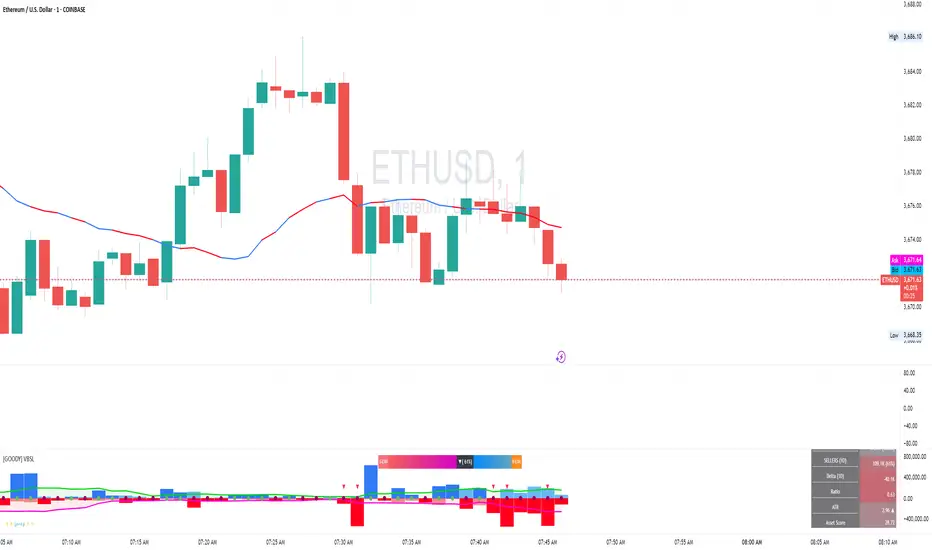
Volume Buyer-Seller [GOODY]This indicator was designed to analyze buying and selling pressure through volume calculations, providing insights into market dynamics. It can be used to determine whether buyers or sellers dominate the market at any given time.
Key Features
1. Volume Calculations: This indicator calculates the volume attributable to buyers and sellers for each bar, then represents it as buying and selling columns on the chart. It also provides the average volume over a specified period for context.
2. Dominance Logic: By comparing the buying and selling volumes, the indicator determines which side (buyers or sellers) has dominance. If the difference between the two is within a specified threshold, the market is considered indecisive.
3. Dominance Marker: Circles or squares appear on the chart to indicate the dominant force, helping traders quickly assess market sentiment. The colors of these markers can be customized.
4. Label Display: The indicator displays a comprehensive label on the chart with information like total volume, buyer/seller percentages, average volume, ratio, and ATR (Average True Range) details. This label can show current or past data depending on user preference.
5. Ratio and Control: A critical component is the ratio, calculated as the proportion of buying volume to selling volume. This ratio is a key indicator of market sentiment, with an appended symbol to denote whether buyers or sellers are in control.
How to Use
• Settings: Adjust the settings to align with your trading strategy. You can modify the length for average volume, ATR, and other parameters to suit your trading style.
• Volume Analysis: Monitor the buying and selling columns to determine market activity. The larger columns indicate higher volume, suggesting a strong buying or selling pressure.
• Dominance: Pay attention to the dominance markers. Green markers indicate buying dominance, while red markers signify selling dominance. If the market is indecisive, the marker will be gray.
• Ratio: A ratio above 1 suggests buying dominance, while a ratio below 1 indicates selling dominance. The ratio's appended color tag helps quickly identify which side is in control.
• Labels: The labels provide a snapshot of key data, including total volume, buyer/seller percentages, average volume, ratio, and ATR. This information is helpful in understanding overall market conditions.
Reading the Indicator
• Buying and Selling Columns: These represent the respective volumes for each side. Positive columns are buying volumes, and negative columns are selling volumes.
• Dominance Circles: A circle appears at the zero baseline to show which side is currently dominant. A blue circle indicates buying dominance, while a red circle indicates selling dominance.
• Ratio with Dominance: The label includes a ratio with a tag showing who is in control. A green tag indicates buyers, and a red tag indicates sellers.
• ATR and Average Volume: The label provides additional context with ATR and average volume, helping you understand volatility and relative volume.
Volume Gauge Addition : Introduced a volume gauge display option to visualize the relative strength of buying vs. selling volumes. Users can toggle this feature on or off according to their analysis needs.
Total Volume
Metric: Displays "Total Vol."
Value: Shows the total trading volume for the current bar, formatted in a human-readable format (K for thousands, M for millions). Additionally, it shows the percentage of this volume relative to the average volume, aiding in understanding volume spikes or drops.
Usage: Compare current volume to historical averages to identify unusual market activity.
Average Volume
Metric: Displays "Avg Vol."
Value: Shows the simple moving average of the volume over a user-defined period, formatted similarly to Total Volume.
Usage: Helps determine if current volume is above or below average, indicating potential interest or disinterest in the asset.
Buyers
Metric: Displays "BUYERS."
Value: Shows the volume of buying calculated from the upward price movements within the bar, along with its percentage of the total volume.
Usage: Spot dominance in buying activity which might suggest bullish conditions.
Sellers
Metric: Displays "SELLERS."
Value: Shows the volume of selling calculated from the downward price movements within the bar, along with its percentage of the total volume.
Usage: Spot dominance in selling activity which might suggest bearish conditions.
Delta
Metric: Displays "Delta."
Value: Shows the difference between buying and selling volumes, providing a quick snapshot of which side of the market is exerting more pressure.
Usage: Use to gauge overall market sentiment and potential price direction.
Ratio
Metric: Displays "Ratio."
Value: Shows the ratio of buying volume to selling volume, providing insight into the relative strength of buyers vs. sellers.
Usage: Ratios significantly above or below 1 can indicate strong market biases.
ATR (Average True Range)
Metric: Displays "ATR."
Value: Shows the current ATR value to gauge volatility, with an arrow indicating the direction of change from the previous bar’s ATR.
Usage: Utilize to assess market volatility and potentially adjust trading strategies or risk management settings.
Dynamic Background Colors
The table employs dynamic background colors for certain metrics to visually represent data intensity or significance:
Total Volume: Changes color based on the percentage relative to the average volume.
Buyers/Sellers: The background color indicates whether buying or selling is dominant.
Delta and Ratio: Colors change based on their calculated values to reflect market conditions quickly.
What is Volume Delta?
Volume delta, also known as volume difference or volume delta divergence, refers to the difference between buying (accumulation) and selling (distribution) volumes within a given time period. It provides a quantitative measure of the net buying or selling pressure in the market.
How to Use Volume Delta:
Identifying Market Sentiment:
Positive delta values indicate that buying volume exceeds selling volume, suggesting bullish sentiment.
Negative delta values indicate that selling volume exceeds buying volume, suggesting bearish sentiment.
Confirming Price Movements:
Volume delta can be used to confirm price movements. For example, if prices are rising and volume delta is positive, it may suggest that the uptrend is supported by strong buying interest.
Conversely, if prices are falling and volume delta is negative, it may suggest that the downtrend is supported by strong selling pressure.
Spotting Divergence:
Divergence between price and volume delta can signal potential trend reversals. For example, if prices are rising but volume delta is declining (or vice versa), it may indicate weakening momentum and a possible reversal in trend.
Confirming Breakouts:
Volume delta can help confirm breakout moves. For instance, a breakout accompanied by increasing positive delta values may suggest strong buying interest and validate the breakout.
In summary, volume delta provides valuable insights into market sentiment and can be used alongside price action analysis to make more informed trading decisions.
Max distance from weekly averageAfter extended advances, stocks occasionally have a last surge higher and form what is known as a climax top. One way to gauge this is to study what distance the stock is, in percentage terms, vs a moving average. However, most indicators use the close of the bar rather than the high of the bar for this calculation. Stocks that have big reversals may not show to be overextended when looking at a weak closing price. therefore, this tool looks at the high of the week vs the 10-week moving average so that the closing price does not affect comparisons between different weeks.

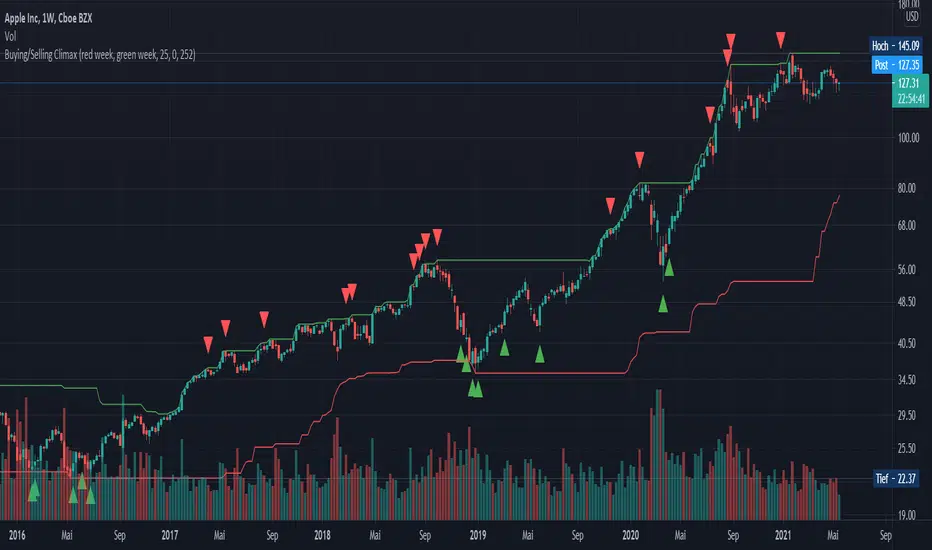
Buying/Selling ClimaxEnglish:
This indicator is designed for the stock market and marks potential buying or selling climaxes. If a "buying climax" or "selling climax" is marked, the probability is high that this price level will not be exceeded or undershot quickly. The indicator is used exclusively on the weekly time level.
Conditions for a "Buying Climax":
- New 52-week high
- The week closes in the loss "red week”
Alternative: The week closes below the opening price of the previous week
Conditions for a "Selling Climax":
- New 52-week low or crash (in the stock).
- The week closes in profit "green week”
- The 2 previous weeks are losing weeks
Alternative: The week closes above the opening price of the previous week
Deutsch:
Dieser Indikator ist für den Aktienmarkt ausgelegt und markiert potenzielle Kauf-/ bzw. Verkaufs-Höhepunkte. Wird ein „Buying-Climax“ bzw. „Selling-Climax“ markiert, ist die Wahrscheinlichkeit hoch, dass dieses Preisniveau nicht so schnell überschritten bzw. unterschritten wird. Der Indikator wird ausschließlich auf der wöchentlichen Zeitebene eingesetzt.
Bedingungen für einen „Buying Climax“:
- Neues 52-Wochen Hoch
- Die Woche schließt im Verlust „red week“
Alternative: Die Woche schließt unterhalb des Eröffnungspreises der Vorwoche
Bedingungen für einen „Selling Climax“:
- Neues 52-Wochen Tief oder Crash (in der Aktie)
- Die Woche schließt im Gewinn „green week“
- Die 2 Vorangegangenen Wochen sind Verlustwochen
Alternative: Die Woche schließt oberhalb des Eröffnungspreises der Vorwoche
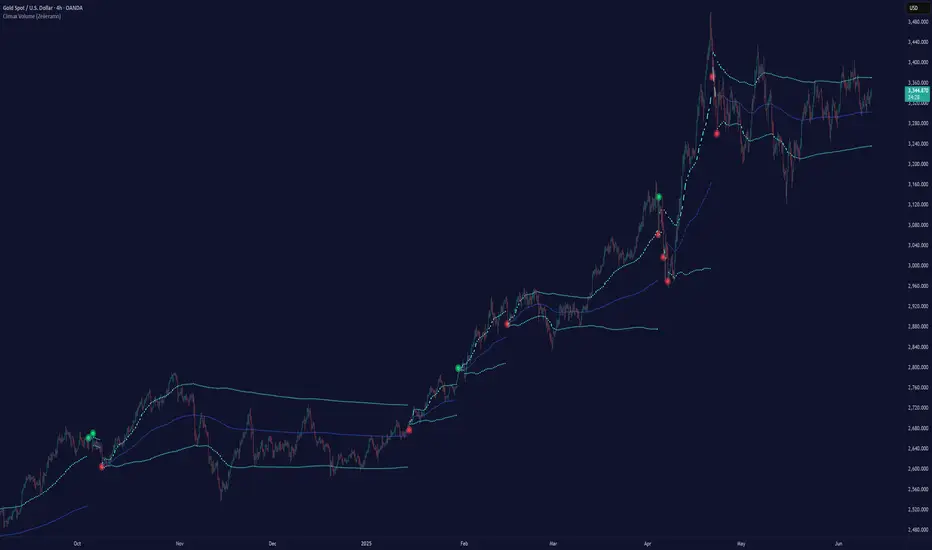
Climax Volume (Zeiierman)█ Overview
Climax Volume (Zeiierman) isolates extreme participation events to pinpoint when price action reaches exhaustion. These moments of volume climax often precede reversals, pauses, or key balance shifts, offering traders an early read on changing market dynamics. Instead of treating volume as a passive tally, it locates climax bars, abnormally large activity bursts, and anchors a Point of Control (PoC) that tracks where post-climax transactions concentrate. The result is a clear read on when participation is peaking, where value re-centers afterward, and how far price can reasonably deviate before reverting.
This tool is designed for multi-context use, such as intraday execution, swing confirmation, or structural bias analysis, offering a precise view of where volume matters, not just how much.
⚪ Why This One Is Unique
Unlike conventional volume-spike indicators, Climax Volume (Zeiierman) integrates adaptive extremum detection, a dynamic PoC core, and multi-layer deviation envelopes that evolve in real time with market context.
Internally, it fuses bid–ask volume delta modeling with re-normalized dispersion mapping to measure the directional imbalance driving each climax event. The system continuously evaluates delta asymmetry between buying and selling pressure to refine the detection of true participation extremes. This allows the engine to differentiate between constructive volume expansion (trend continuation) and exhaustive volume spikes (potential reversals).
█ Main Features
⚪ Climax Volume
The Climax Volume Engine isolates statistically significant bursts in participation that indicate potential turning points or exhaustion phases. It identifies climax bars—instances where volume reaches regime-level extremes relative to recent activity—and classifies them as bullish (green) or bearish (red) based on directional dominance. These events highlight where aggressive activity peaks and often mark the start of structural imbalance, providing early cues for reversal, absorption, or renewed continuation.
⚪ Point of Control (PoC)
Each climax event dynamically re-anchors a Point of Control (PoC)—the evolving price center of post-climax volume distribution. The PoC tracks where transaction density stabilizes after an extreme burst, forming the reference core of a control zone. From this anchor, the system projects upper and lower tolerance bands to define acceptable deviation ranges, contextualizing how far the price can travel before reverting or rebalancing.
█ How to Use
⚪ Trend Following
Use the Volume Point of Control (PoC) as a dynamic guide to assess directional bias. The PoC effectively acts as a moving equilibrium line, continuously updating to reflect where trading volume and market influence are concentrated.
When price holds above the PoC, it signals sustained bullish sentiment and active accumulation.
When the price remains below, it confirms bearish control and ongoing distribution.
⚪ Trend Continuation Retests
The slope of the PoC reflects the strength and persistence of market momentum. The steeper the PoC slope, the stronger the active momentum. A flat or neutral PoC typically signals consolidation or low conviction — conditions better avoided for trend trades.
In a bullish scenario , watch for the price to retest the PoC or the lower tolerance band after a pullback. A successful rejection of that zone often signals that buyers are defending control, providing a high-probability continuation entry.
In a bearish scenario , when the PoC slopes downward, wait for the price to retest it from below. If the market fails to reclaim that level, it indicates that sellers remain dominant, and downside momentum is likely to continue.
⚪ Reversals
Climax Points — the color-coded circles that appear during moments of extreme volume. These signals indicate that the market may soon pause, reverse, or rotate back toward the PoC equilibrium.
🟢 Bullish Climax Points emerge when heavy buying reaches unsustainable levels, often signaling a buyer exhaustion event or a possible local top formation.
🔴 Bearish Climax Points form during high-intensity selling bursts, warning of seller exhaustion and potential bottoming conditions.
⚪ Confirm Breakouts
High-volume breakouts confirmed by Climax Volume signals often mark the initiation of strong directional moves. When climax confirmation aligns with a structural break, it validates that the breakout is backed by genuine participation — not just thin volatility spikes — increasing the probability of follow-through and trend expansion.
Identify a key support or resistance zone manually or with your preferred structural tool.
Wait for a climax signal to coincide with a break beyond that level.
For bullish breakouts , a green climax point appearing as price pushes above resistance confirms that buyers are stepping in with conviction.
For bearish breakouts , a red climax point forming as price drops through support indicates that real selling pressure is driving the move.
█ How It Works
⚪ Climax Detection
Identifies participation surges within a dynamic volume–price field to isolate genuine activity extremes rather than simple bar-size anomalies.
Calculation: Utilizes adaptive extremum detection on a re-normalized volume–delta composite with regime-sensitive thresholds and variance filters to extract statistically valid climax events.
⚪ Point of Control (PoC)
Defines the evolving price centroid where post-climax transactions cluster, continuously adapting to shifting participation density.
Calculation: Employs a volume-weighted delta balance framework with incremental accumulation and curvature-preserving smoothing, ensuring stability while maintaining local reactivity to order-flow asymmetry.
⚪ Tolerance Bands
Outlines a probabilistic corridor around the PoC that distinguishes expected fluctuation from meaningful deviation.
Calculation: Implements variance-aware dispersion modeling with contextual weighting derived from real-time delta gradients, projecting symmetric envelopes scaled by adaptive multipliers.
-----------------
Disclaimer
The content provided in my scripts, indicators, ideas, algorithms, and systems is for educational and informational purposes only. It does not constitute financial advice, investment recommendations, or a solicitation to buy or sell any financial instruments. I will not accept liability for any loss or damage, including without limitation any loss of profit, which may arise directly or indirectly from the use of or reliance on such information.
All investments involve risk, and the past performance of a security, industry, sector, market, financial product, trading strategy, backtest, or individual's trading does not guarantee future results or returns. Investors are fully responsible for any investment decisions they make. Such decisions should be based solely on an evaluation of their financial circumstances, investment objectives, risk tolerance, and liquidity needs.
Bezahltes Script
Better X-Trend / VolumeBetter Volume Indicator no tickvolume
EasyLanguage Code Version 19 August 2012 Copyright www.Emini-Watch.com All rights reserved
Better Volume Indicator
emini-watch.com
emini-watch.com
Thx to @sal157011 for his code, a just add icons to work easier with my setup
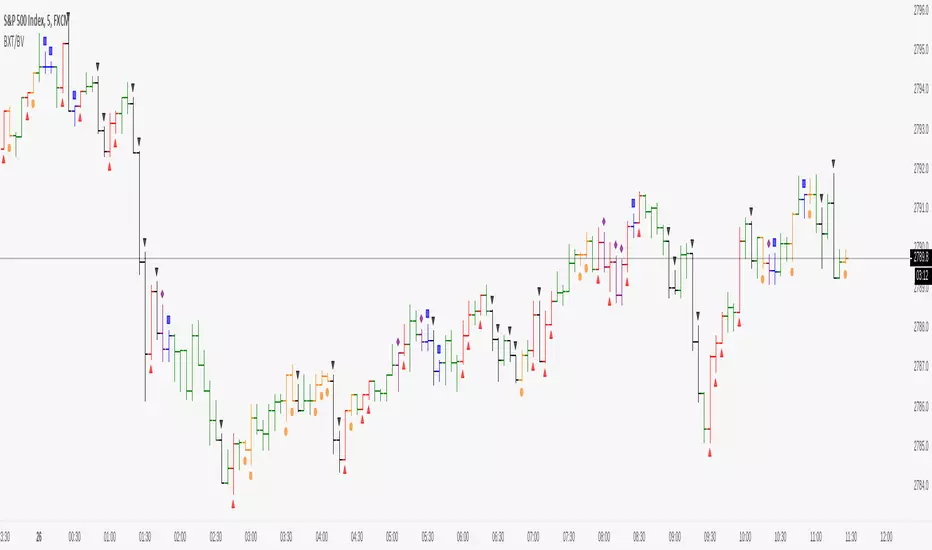
TCG Price Shear PlusThe Chart Guys Price Shear and Abnormal Volume Alerts all rolled into 1 FREE indicator
Based on TCG Price Shear V2 by urisma and Volume Spikes by OstapChester
This powerful script combines Abnormal Volume Alerts with Price Shear which can be based on either ATR or % deviation from an ema, which intern can also be filtered by Abnormal Volume for less false signals.
Look out for my next indicator which will be called TCG Price Shear Plus Scanner which will scan and alert you for several different assets at once!
Enjoy
