Daily Bias Trade Manager [MarkitTick]💡 The Daily Bias Trade Manager is a sophisticated technical analysis suite designed to automate the identification of high-probability intraday setups based on liquidity concepts and structural shifts. By synthesizing Previous Day High/Low (PDH/PDL) interactions with momentum confirmation and strict risk management protocols, this tool assists traders in navigating the "Daily Bias." It moves beyond simple signal generation by offering a complete trade management visualization system, projecting entries, stop losses, and take-profit levels directly onto the chart in real-time.
✨ Originality and Utility
This script distinguishes itself by integrating institutional price action theory—specifically Liquidity Sweeps and Change in State of Delivery (CISD)—with mechanical filtering. While many indicators simply highlight highs and lows, the Daily Bias Trade Manager validates these levels by analyzing what happens *after* price tests them.
It solves a common problem for intraday traders: "Analysis Paralysis." By automating the detection of structure breaks (MSS) and Fair Value Gaps (FVG) following a sweep of daily liquidity, it provides an objective framework for entry. Furthermore, the built-in "Position Box" feature removes the guesswork from trade execution by instantly calculating risk-to-reward ratios and visualizing them, allowing traders to see the feasibility of a trade before execution.
🔬 Methodology and Concepts
The core logic operates on a sequential detection model:
Liquidity Identification: The script first plots the Previous Day High (PDH) and Previous Day Low (PDL). These are critical institutional reference points where stop-loss orders (liquidity) often reside.
The Sweep: A "Sweep" is confirmed when price breaches a PDH/PDL but fails to sustain the breakout, closing back inside the previous day's range. This suggests a "Fake-out" or liquidity grab, often a precursor to a reversal.
Change in State of Delivery (CISD): Following a sweep, the script monitors local market structure. It looks for a decisive close past a recent swing point (Swing High for shorts, Swing Low for longs) within a user-defined bar window. This confirms that the counter-trend move has momentum.
Confluence Filtering: To reduce false positives, the engine applies optional filters:
RVOL (Relative Volume): Ensures the sweep occurred on significant volume (Climax behavior).
RSI Momentum: Verifies that momentum supports the reversal direction.
Trend Filter: Uses a long-term EMA to ensure trades align with the broader market direction.
Entry Model: Upon validation, the script calculates an entry at the close (or optionally at a Fair Value Gap), places a Stop Loss at the sweep extreme, and projects three Take Profit targets based on configurable R:R ratios.
🎨 Visual Guide
The indicator uses a distinct color-coded system to keep the chart clean yet informative:
● Liquidity Levels & Sweeps
Orange/Blue Lines: Represent the PDH (Previous Day High) and PDL (Previous Day Low).
Teal Shaded Zones: Indicate a "Buy-Side Sweep" (Price took highs and rejected).
Red Shaded Zones: Indicate a "Sell-Side Sweep" (Price took lows and rejected).
● Position Management Boxes
When a signal triggers, a structured box appears:
Solid Gray Line: The theoretical Entry Price.
Solid Red Line: The Stop Loss (SL), typically placed at the swing high/low of the sweep.
Dashed Blue Lines: Represent TP1, TP2, and TP3 targets based on Reward-to-Risk settings.
Labels: Data tags on the right side of the box show exact price coordinates for Entry, SL, and Targets.
● Signals & Clouds
Green "BUY" Labels: Appear below the bar when a bullish sweep and structural shift are confirmed.
Red "SELL" Labels: Appear above the bar when a bearish sweep is validated.
Yellow Clouds: Highlight Fair Value Gaps (FVG) used for entry confluence or retests.
● Multi-Timeframe (MTF) Dashboard
A panel (default: Top Right) displays the status of up to three higher timeframes.
Trend: Shows "BULL" or "BEAR" based on EMA alignment.
Liquidity: Indicates if the timeframe is "Taking Buy Liq", "Taking Sell Liq", or "Inside Range".
📖 How to Use
● Bullish Reversal Setup
Wait for price to drop below the Blue PDL Line.
Look for a Red Sell-Side Sweep Zone to form, indicating price has rejected lower prices.
Wait for the Green BUY Signal . This confirms a shift in structure (CISD) back to the upside.
Observe the Position Box. If the Risk/Reward is favorable (targets are within reasonable reach), consider the trade.
Optional: Use the "Dynamic Targets" setting to target the previous swing high instead of a fixed ratio.
● Bearish Reversal Setup
Wait for price to rally above the Orange PDH Line.
Look for a Teal Buy-Side Sweep Zone .
Wait for the Red SELL Signal confirming the rejection.
Ensure the dashboard shows alignment (e.g., Higher Timeframe Trend is Bearish) for higher probability.
● Trade Management
Enable the "ATR Trailing Stop" in settings to have the Stop Loss line dynamically adjust as price moves in your favor, locking in potential gains.
⚙️ Inputs and Settings
● General & Display
Show Daily Liquidity: Toggles the PDH/PDL lines.
Max Signals/Zones: Limits the visual clutter by restricting historical shapes.
● Detection Logic
Swing Detection Length: Controls the sensitivity of pivot points. Higher numbers = fewer, more significant swings.
CISD Window: How many bars after a sweep are allowed for the structure shift to occur.
Use FVG Entry: If true, the signal waits for a retest of a gap rather than entering immediately at the close.
● Filters
Volume (RVOL): Requires the sweep candle volume to be X times larger than average.
Trend Filter: Only allows Buy signals above the EMA and Sell signals below it.
Session Filter: Restricts signals to specific hours (e.g., New York Killzone).
● Targets & Management
Target R:R: Sets the multiplier for TP1, TP2, TP3 relative to the stop loss distance.
Use Dynamic Targets: Targets structural liquidity (Previous Highs/Lows) instead of fixed math ratios.
ATR Trailing Stop: Activates the trailing stop mechanism.
🔍 Deconstruction of the Underlying Scientific and Academic Framework
This indicator is grounded in the principles of Market Microstructure and Mean Reversion theory .
1. Liquidity Pools & Stop Runs:
Academic literature on market microstructure suggests that order flow clusters around obvious visual references (PDH/PDL). Large market participants often utilize this "resting liquidity" to fill large block orders with minimal slippage. The "Sweep" logic detects this absorption phase.
2. Volatility Breakout vs. Fake-out:
The script differentiates between a genuine breakout and a mean-reverting "fake-out" by analyzing the Close relative to the Range . A close back within the prior day's range after a breach signifies a failure of auction in the new territory, statistically increasing the probability of a reversion to the mean (equilibrium).
3. Momentum Validation (RSI & RVOL):
By integrating Relative Volume (RVOL) and RSI, the script applies statistical significance testing to the price action. High volume at a range extreme without price progress (the sweep) indicates "Stopping Volume" or absorption, a key concept in Volume Spread Analysis (VSA).
🙏 Gratitude
I would like to express my gratitude to harry040708 for sharing the insightful idea that made this script possible.
⚠️ Disclaimer
All provided scripts and indicators are strictly for educational exploration and must not be interpreted as financial advice or a recommendation to execute trades. I expressly disclaim all liability for any financial losses or damages that may result, directly or indirectly, from the reliance on or application of these tools. Market participation carries inherent risk where past performance never guarantees future returns, leaving all investment decisions and due diligence solely at your own discretion.
Circle

D-Shape Breakout Signals [LuxAlgo]The D-Shape Breakout Signals indicator uses a unique and novel technique to provide support/resistance curves, a trailing stop loss line, and visual breakout signals from semi-circular shapes.
🔶 USAGE
D-shape is a new concept where the distance between two Swing points is used to create a semi-circle/arc, where the width is expressed as a user-defined percentage of the radius. The resulting arc can be used as a potential support/resistance as well as a source of breakouts.
Users can adjust this percentage (width of the D-shape) in the settings ( "D-Width" ), which will influence breakouts and the Stop-Loss line.
🔹 Breakouts of D-Shape
The arc of this D-shape is used for detecting breakout signals between the price and the curve. Only one breakout per D-shape can occur.
A breakout is highlighted with a colored dot, signifying its location, with a green dot being used when the top part of the arc is exceeded, and red when the bottom part of the arc is surpassed.
When the price reaches the right side of the arc without breaking the arc top/bottom, a blue-colored dot is highlighted, signaling a "Neutral Breakout".
🔹 Trailing Stop-Loss Line
The script includes a Trailing Stop-Loss line (TSL), which is only updated when a breakout of the D-Shape occurs. The TSL will return the midline of the D-Shape subject to a breakout.
The TSL can be used as a stop-loss or entry-level but can also act as a potential support/resistance level or trend visualization.
🔶 DETAILS
A D-shape will initially be colored green when a Swing Low is followed by a Swing High, and red when a Swing Low is followed by a Swing High.
A breakout of the upper side of the D-shape will always update the color to green or to red when the breakout occurs in the lower part. A Neutral Breakout will result in a blue-colored D-shape. The transparency is lowered in the event of a breakout.
In the event of a D-shape breakout, the shape will be removed when the total number of visible D-Shapes exceeds the user set "Minimum Patterns" setting. Any D-shape whose boundaries have not been exceeded (and therefore still active) will remain visible.
🔹 Trailing Stop-Loss Line
Only when a breakout occurs will the midline of the D-shape closest to the closing price potentially become the new Trailing Stop value.
The script will only consider middle lines below the closing price on an upward breakout or middle lines above the closing price when it concerns a downward breakout.
In an uptrend, with an already available green TSL, the potential new Stop-Loss value must be higher than the previous TSL value; while in a downtrend, the new TSL value must be lower.
The Stop-Loss line won't be updated when a "Neutral Breakout" occurs.
🔶 SETTINGS
Swing Length: Period used for the swing detection, with higher values returning longer-term Swing Levels.
🔹 D-Patterns
Minimum Patterns: Minimum amount of visible D-Shape patterns.
D-Width: Width of the D-Shape as a percentage of the distance between both Swing Points.
Included Swings: Include "Swing High" (followed by a Swing Low), "Swing Low" (followed by a Swing High), or "Both"
Style Historical Patterns: Show the "Arc", "Midline" or "Both" of historical patterns.
🔹 Style
Label Size/Colors
Connecting Swing Level: Shows a line connecting the first Swing Point.
Color Fill: colorfill of Trailing Stop-Loss

Auto Order Block by D. BrigagliaThis indicator finds trend following engulfings, and draws order blocks based on the 1st candle's range (the first candle of the engulfing pattern).
It does filter the trend with simple moving averages of 21 and 55 periods, but it doesn't filter for retracements in the trend (you should consider only the order blocks that are coming from engulfings after a retracement)

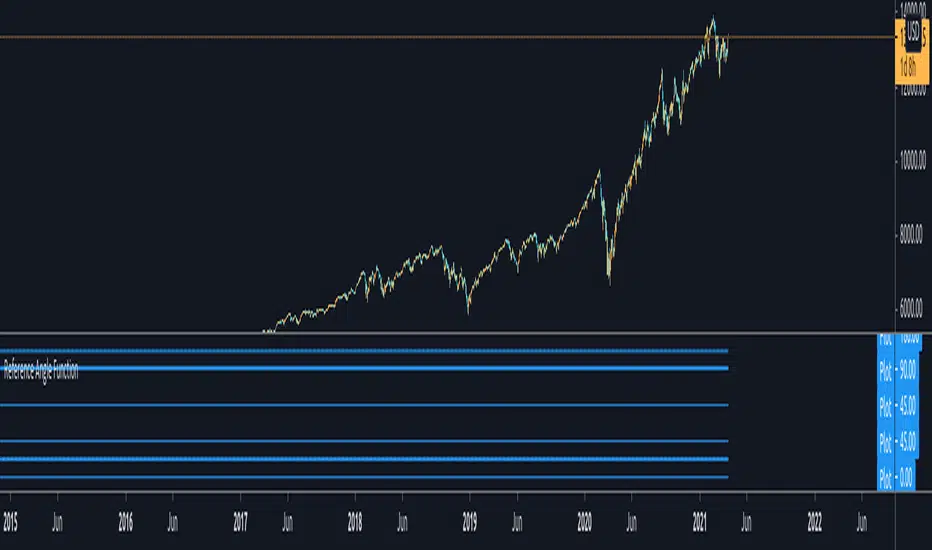
Reference Angle Function - for developers█ OVERVIEW
This function should give you a correct output in a circle of 360°. It is meant to be used by developers/pine-script-coders to figure out reference angles.
Conditions :
1. If the angle given to this function is in between 0-360 then it would give you the same angle without any modifications
2. If the angle given is greater than 360° - for example : 540°, - then it would output 180° which is the angle after a complete revolution.
3. If the angle given is negative, then it would go counter clockwise and give you the angle.
4. If the angle is negative and less than -360°, then it would also give you the actual correct degree after counting the revolution and flipping it to positive.
Feel free to play with it or use it if you need to. I already included some test inputs to show you how it would work.
Periodic EllipsesThe following script periodically plot ellipses to the chart, where the maximum height of the ellipses is determined by the price high of the user-selected time frame while the price low determines the minimum height of the ellipses.
The selected time frame affects the frequency at which the ellipses are plotted, for example, a selected time frame of 1 week will plot an ellipse every week
Note that time frames that are close to the one used in the main chart can return noncircular shapes
Here the main time frame is 15 minutes, while the time frame in the script is 1 hour.
By default the script uses future data, and as such repaint which makes it only useful in offline (non-real time) situations, you can make the script use only past data by deselecting the "repaint" option.
Interpretation And Construction
In terms of usages and interpretation ellipses are similar to bands indicators, as such we can use ellipses in a breakout methodology, where a closing price crossing over the upper bound indicating an uptrend and a closing price crossing under the lower bound indicating a downtrend.
By default, the color of the plots are based on a gradient determined by the position of the closing price relative to the ellipse, with a closing price closer to the upper bound of the ellipse returning a blue color and a closing price closer to the lower bound returning a red color, the intermediate color is violet. When repainting mode is deactivated a blue color indicates an up-trend, while a red color indicates a down-trend, violet colors on the other hand indicate a ranging market.
The ellipses can also determine possible retracements, as such the upper bound of the ellipse can act as a support in an uptrend while the lower bound can act as a resistance in a downtrend.
Construction
Peoples might be interested in the construction of ellipses, this task is not complicated. We can construct circular shapes by using the equation of a semi-circle described as follows:
C = √(1 - x*x)
with 1 ≥ x ≥ -1 , values of x greater than 1 or lower than -1 will return na . In the script, the variable basis creates a line starting at -1 and ending at 1, we then only need to apply the previous equation to this line to have a semi-circle. This semi-circle is in a range of (0,1), so we need to rescale it in a useful range, let's define the highest high of the selected time frame as H and the lowest low as L , the upper and lower bound of the ellipse are calculated as follows:
upper = avg(H,L) + C*(H - avg(H,L))
lower = avg(H,L) - C*(avg(H,L) - L)
Summary
A script plotting ellipses has been proposed, we have seen that the signals that can be generated are similar to the one generated by band indicators, note however that the script has not been made to be a serious indicator, it would be more advisable to use regular band indicators instead.
Thx to @freds_view for the question.
