The Bar Counter Trend Reversal Strategy [TradeDots]Overview
The Bar Counter Trend Reversal Strategy is designed to identify potential counter-trend reversal points in the market after a series of consecutive rising or falling bars.
By analyzing price movements in conjunction with optional volume confirmation and channel bands (Bollinger Bands or Keltner Channels), this strategy aims to detect overbought or oversold conditions where a trend reversal may occur.
🔹How it Works
Consecutive Price Movements
Rising Bars: The strategy detects when there are a specified number of consecutive rising bars (No. of Rises).
Falling Bars: Similarly, it identifies a specified number of consecutive falling bars (No. of Falls).
Volume Confirmation (Optional)
When enabled, the strategy checks for increasing volume during the consecutive price movements, adding an extra layer of confirmation to the potential reversal signal.
Channel Confirmation (Optional)
Channel Type: Choose between Bollinger Bands ("BB") or Keltner Channels ("KC").
Channel Interaction: The strategy checks if the price interacts with the upper or lower channel lines: For short signals, it looks for price moving above the upper channel line. For long signals, it looks for price moving below the lower channel line.
Customization:
No. of Rises/Falls: Set the number of consecutive bars required to trigger a signal.
Volume Confirmation: Enable or disable volume as a confirmation factor.
Channel Confirmation: Enable or disable channel bands as a confirmation factor.
Channel Settings: Adjust the length and multiplier for the Bollinger Bands or Keltner Channels.
Visual Indicators:
Entry Signals: Triangles plotted on the chart indicate potential entry points:
Green upward triangle for long entries.
Red downward triangle for short entries.
Channel Bands: The upper and lower bands are plotted for visual reference.
Strategy Parameters:
Initial Capital: $10,000.
Position Sizing: 80% of equity per trade.
Commission: 0.01% per trade to simulate realistic trading costs.
🔹Usage
Set up the number of Rises/Falls and choose whether if you want to use channel indicators and volume as the confirmation.
Monitor the chart for triangles indicating potential entry points.
Consider the context of the overall market trend and other technical factors.
Backtesting and Optimization:
Use TradingView's Strategy Tester to evaluate performance.
Adjust parameters to optimize results for different market conditions.
🔹 Considerations and Recommendations
Risk Management:
The strategy does not include built-in stop-loss or take-profit levels. It's recommended to implement your own risk management techniques.
Market Conditions:
Performance may vary in different market environments. Testing and adjustments are advised when applying the strategy to new instruments or timeframes.
No Guarantee of Future Results:
Past performance is not indicative of future results. Always perform due diligence and consider the risks involved in trading.
Channelbreak

IsAlgo - Manual Channel► Overview:
Manual Channel is a strategy that allows traders to manually insert channel lines and set the lines’ width. Trades are opened when the price hits one of the lines and bounces back, with the expectation that it will move towards the opposite line. This strategy offers flexibility in configuring channel lines and trading behavior.
► Description:
The Manual Channel strategy is based on the use of manually defined channel lines to guide trading decisions. Traders start by marking four key points on the chart to create the channel. The first two points share the same time but different prices, and the last two points also share the same time but different prices. This method allows traders to place the channel lines precisely based on their analysis and insights. Additionally, the strategy allows for adjusting the width of the channel lines, which acts as a buffer zone around the main lines.
Once the channel is established, the strategy continuously monitors the price movements in relation to these lines. When the price touches one of the channel lines, the strategy opens a trade with the expectation that the price will bounce back and move towards the opposite line. For example, if the price hits the lower channel line, a long trade (buy) might be opened with the anticipation that the price will rise to the upper channel line. Conversely, if the price hits the upper channel line, a short trade (sell) might be opened expecting the price to fall to the lower channel line.
The strategy offers several options for managing trades. Traders can choose to close a trade when the price reaches the opposite channel line, capturing the expected movement within the channel. Additionally, if the price breaks outside the channel, traders have the option to close trades immediately or stop further trade executions to avoid potential losses.
↑ Channel Example:
↓ Channel Example:
► Features and Settings:
⚙︎ Channel: Define the time and prices of the four main points of the channel lines, and set the lines’ width.
⚙︎ Entry Candle: Specify the minimum and maximum body size and the body-to-candle size ratio for entry candles.
⚙︎ Trading Session: Define specific trading hours during which the strategy operates, restricting trades to preferred market periods.
⚙︎ Trading Days: Specify active trading days to avoid certain days of the week.
⚙︎ Backtesting: Perform backtesting for a selected period to evaluate strategy performance. This feature can be deactivated if not needed.
⚙︎ Trades: Configure trade direction (long, short, or both), position sizing (fixed or percentage-based), maximum number of open trades, and daily trade limits.
⚙︎ Trades Exit: Set profit/loss limits, specify trade duration, or exit based on channel breaks.
⚙︎ Stop Loss: Choose from various stop-loss methods, including fixed pips, ATR-based, or highest/lowest price points within a specified number of candles. Trades can also be closed after a certain number of adverse candle movements.
⚙︎ Break Even: Adjust stop loss to break even once predefined profit levels are reached, protecting gains.
⚙︎ Trailing Stop: Implement a trailing stop to adjust the stop loss as the trade becomes profitable, securing gains and potentially capturing further upside.
⚙︎ Take Profit: Set up to three take-profit levels using methods such as fixed pips, ATR, or risk-to-reward ratios. Alternatively, specify a set number of candles moving in the trade’s direction.
⚙︎ Alerts: Comprehensive alert system to notify users of significant actions, including trade openings and closings. Supports dynamic placeholders for take-profit levels and stop-loss prices.
⚙︎ Dashboard: Visual display on the chart providing detailed information about ongoing and past trades, aiding users in monitoring strategy performance and making informed decisions.
► Backtesting Details:
Timeframe: 15-minute EURUSD chart
Initial Balance: $10,000
Order Size: 10 units
Commission: 0.05%
Slippage: 5 ticks
This strategy opens trades around a manually drawn channel, which results in a smaller number of closed trades.

IsAlgo - CandleWave Channel Strategy► Overview:
The CandleWave Channel Strategy uses an exponential moving average (EMA) combined with a custom true range function to dynamically calculate a multi-level price channel, helping traders identify potential trend reversals and price pullbacks.
► Description:
The CandleWave Channel Strategy is built around an EMA designed to identify potential reversal points in the market. The channel’s main points are calculated using this EMA, which serves as the foundation for the strategy’s dynamic price channel. The channel edges are determined using a proprietary true range function that measures the distance between the highs and lows of price movements over a specific period. By factoring in the maximum distance between highs and lows and averaging these values over the period, the strategy creates a responsive channel that adapts to current market conditions. The channel consists of five levels, each representing different degrees of trend tension.
The strategy continuously monitors the price in relation to the channel edges. When a candle closes outside one of these edges, it indicates a potential price reversal. This outside-close candle acts as a signal for a possible trend change, prompting the strategy to prepare for a trade entry. Upon detecting an outside-close candle, the strategy triggers an entry. The logic behind this is that when the price moves outside the defined channel, it is likely to revert back within the channel and move towards the opposite edge. The strategy aims to capitalize on this reversion by entering trades based on these signals.
Traders can adjust the channel’s length, levels, and minimum distance to tailor it to different market conditions. They can also define the characteristics of the entry candle, such as its size, body, and relative position to previous candles, to ensure it meets specific conditions before triggering a trade. Additionally, the strategy permits the specification of trading hours and days, enabling traders to focus on preferred market periods. Exit can be configured based on profit/loss limits, trade duration, and band reversal signals or other criteria.
How it Works:
Channel Calculation: The strategy continuously updates the channel edges using the EMA and true range function.
Signal Detection: It waits for a candle to close outside the channel edges.
Trade Entry: When an outside-close candle is detected, the strategy enters a trade expecting the price to revert to the opposite channel edge.
Customization: Users can define the characteristics of the entry candle, such as its size relative to previous candles, to ensure it meets specific conditions before triggering a trade.
↑ Long Trade Example:
The entry candle closes below the channel level, indicating a potential upward reversal. The strategy enters a long position expecting the price to move towards the upper levels.
↓ Short Trade Example:
The entry candle closes above the channel level, signaling a potential downward reversal. The strategy enters a short position anticipating the price to revert towards the lower levels.
► Features and Settings:
⚙︎ Channel: Adjust the channel’s length, levels, and minimum distance to suit different market conditions and trading styles.
⚙︎ Entry Candle: Customize entry criteria, including candle size, body, and relative position to previous candles for accurate signal generation.
⚙︎ Trading Session: Define specific trading hours during which the strategy operates, restricting trades to preferred market periods.
⚙︎ Trading Days: Specify active trading days to avoid certain days of the week.
⚙︎ Backtesting: backtesting for a selected period to evaluate strategy performance. This feature can be deactivated if not needed.
⚙︎ Trades: Configure trade direction (long, short, or both), position sizing (fixed or percentage-based), maximum number of open trades, and daily trade limits.
⚙︎ Trades Exit: Set profit/loss limits, specify trade duration, or exit based on band reversal signals.
⚙︎ Stop Loss: Choose from various stop-loss methods, including fixed pips, ATR-based, or highest/lowest price points within a specified number of candles. Trades can also be closed after a certain number of adverse candle movements.
⚙︎ Break Even: Adjust stop loss to break even once predefined profit levels are reached, protecting gains.
⚙︎ Trailing Stop: Implement a trailing stop to adjust the stop loss as the trade becomes profitable, securing gains and potentially capturing further upside.
⚙︎ Take Profit: Set up to three take-profit levels using methods such as fixed pips, ATR, or risk-to-reward ratios. Alternatively, specify a set number of candles moving in the trade’s direction.
⚙︎ Alerts: Comprehensive alert system to notify users of significant actions, including trade openings and closings. Supports dynamic placeholders for take-profit levels and stop-loss prices.
⚙︎ Dashboard: Visual display on the chart providing detailed information about ongoing and past trades, aiding users in monitoring strategy performance and making informed decisions.
► Backtesting Details:
Timeframe: 30-minute GBPJPY chart
Initial Balance: $10,000
Order Size: 500 units
Commission: 0.02%
Slippage: 5 ticks

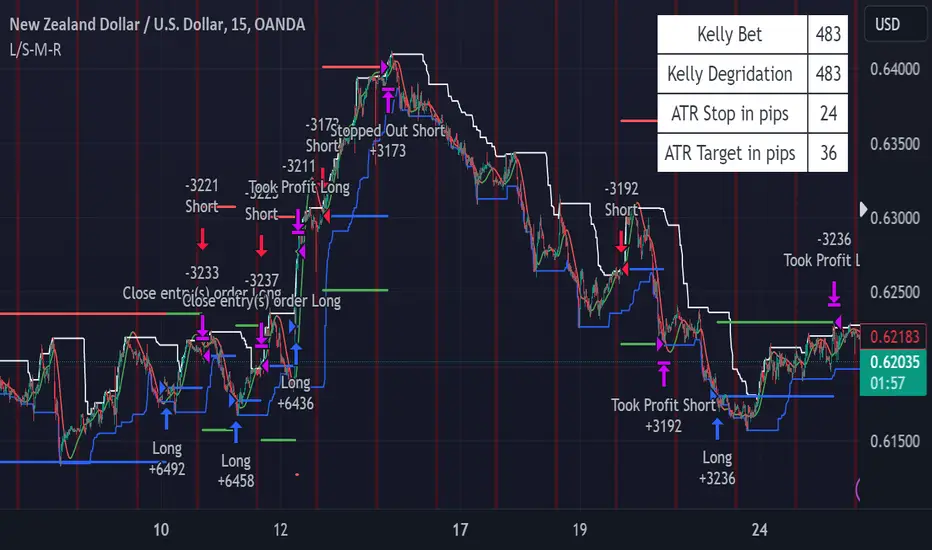
PRICE CHANNEL MEAN REVERSIONThis script is a Fully Automated trading script meant to be used with "Oanda" broker and the plug-ins for algorithmic trading automation.( FOREX ONLY)
This script is meant to capture "MEAN REVERSION " for intraday charts (1hour) preferably and will hold for days / weeks .trading on forex markets.
(The combination of indicators includes a high and low price channel along with a fast moving average)
This script is original in the description of Alan Hulls moving average combined with the high and low closing of price action.
The concept of this mean reversion strategy is to try and capture price exhaustive moves . The moving average is fast and most times remains in the channel. when the moving average overshoots the channel the average price of the instrument is thought to be rising or falling faster then average, indicating a possibility that the instrument may revert (pull back) this strategy aims to capture that pull back.
This strategy uses a higher risk than reward profile to jump in front of market moves (4 risk to 1 reward)
in the likelihood the instrument will revert back (example) 25 pips before it continues 100 pips in the current direction.
This strategy should only be used in markets that you believe are mean reverting at the time of trading otherwise you will be jumping Infront of a possible trend and the price can continue in the trending direction for an unknown specified amount of time.
This script uses a (user defined period) fast moving average ( green/red color) and (user defined period) price channel (White/Blue) chosen in the indicator settings menu.
The default parameters are 55 with a (minimum of 1 and maximum of 10000) for the moving average and 50 with a (minimum of 1 and maximum of 10000) for the price channel , the default parameters = roughly 2 days of price action on the (1 hour) chart.
"The default parameters should be kept unless you fully understand the complete strategy"
the upper band (white line) is the highest close of the specified period and the lower band (blue line) is the lowest close of the same period.
When the fast moving average over shoots the price channel (exits) then crosses back into the price channel (enters) it will trigger a long or short trade.
The long signal is given when the the moving average crosses below the low band then crosses back above the low band . The trade long trade will be entered and the trade will exit if the stop loss or profit targets are hit or if the short signal is given the trade will close then reverse.
The short trade will be entered if the fast moving average crosses above the upper band (white line) then crosses back down through the upper band (white line) The trade short trade will be entered and the trade will exit if the stop loss or profit targets are hit or if the long signal is given the trade will close then reverse.
When the trade is entered a red , a blue and green horizontal dotted line will appear on the chart.
the blue line is the strategy entry price , the red line is the stop loss price , and the green line is the take profit price . the colors will invert if the trade is long or short.
(Setting alerts should be done in the indicator settings menu, and the parameters you chose will determine the stop loss/target and the amount of "units = (position size)" you wish to trade for the (forex only) markets. using "alert() function calls only" is the only alert that should be used with this strategy.
(note : when "alert() function calls only" is set two messages will be sent, one closing any open position in the opposite direction and one placing the new order regardless if you are currently in a trade or not)
Trade targets , stoploss and trade position size are a user defined variables entered in the indicator settings menu. (target pips minimum 0 and a maximum of 1000)(stop pips minimum of 0 and maximum of 1000)
Back test date range is included in the script for back testing different data periods.
the back ground will be colored a transparent navy blue if the period you are looking trading is with in the date range( note: to place live trades the end date will need to be in the future)
this is also adjustable in the settings menu
The avoid spread filter is a user defined time in which the spread is typically higher than average, applying this filter avoids trades in the specified time. When this filter is applied there will be a transparent red back ground color in the specified time.
Back test default setting are equivocal to OANDA:NZDUSD
at the time of this publication placing trades with the "Oanda" broker are as follows , NZD units = 3250 equal 2000 USD position size . "Oanda" current leverage is 33.3 to 1 for this particular pair and commission is paid in spread (1.7) pips = 0.55 USD per trade , Margin required for the trade is 60.50 USD , Position sizing = 6.5% of a 1000 USD account. OANDA:NZDUSD
HHLL Strategy This is simple Highest high and Lowest low strategy.
Buy when break HH+offset
Sell when break LL+offset
Offset = (HH-LL)/2

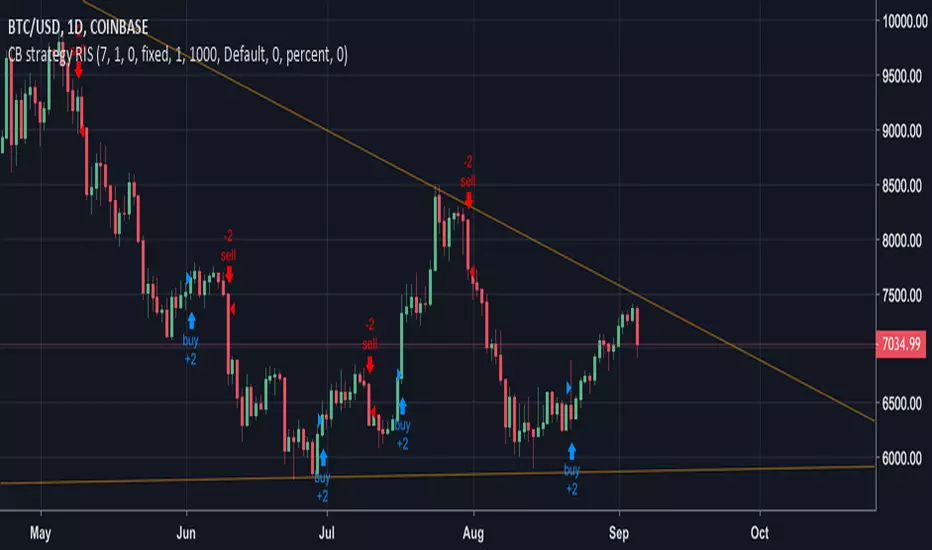
CB strategy RISChannel Break strategy with a default channel of 7 candles.
The channel length can be adjusted by the user for each pair and timeframe to have better results.
Text me if interested.
----------------------------------------------------
Estrategia de ruptura de canal con un canal preestablecido de 7 velas.
La longitud del canal puede ser ajustada por el usuario para mejores resultados según el par y el timeframe.
LinearRegressionChannelBreakoutMy first idea about the linear regression channel... It is free and available for everybody.

cooltoyz: The Turtle SurferThis strategy applies the old tested turtle trading strategy, defining a channel and riding the trend, but
It has some twists tough, to make it adapt on the fly to changes in market conditions.
Since all parameters can be adjusted from the inputs, the strat can (and needs) to be fine tuned for the current values of an asset. for example, for gold values, it works good for years. for btc, it breaks for dates with values under 1500$. that's because 1% of 800 is not the same as 1% of 2400$..... Yeah, data fitting, i know all that....
Some of the parameters work well only for low volatility markets, others are designed exactly to capture volatility. So the parameters must be tested, turned on-off to see how well they do. The default values ARE NOT a generic good for all, most surely.
The Turtle Surfer moves slowly, but it's prepared to rabbit jump in/out if some moon/doom event shows up without invitation :)
If you want to play with the strat, start with all checkboxes off, then turn on/off each one and see the results for the asset you want.
I have had good results in xau, btc and eth
