Dankland Playground DCAing multi-strategy OPThis is essentially a script that I made for myself before deciding it may be good enough for you all as well.
How it works basically is this... you have 18 oscillators which can all be used as independently as you wish. That means there are 20 groups which they can be split amongst as you choose.
When in separate groups they should not be able to sell eachothers positions without triggering a stop loss. Every single oscillator has its own position sizing and exit sizing which can be stated as either a percent of balance or a flat amount of contracts. Each oscillator has a minimum amount of profit you can tell it to sell it, which is calculated from the average cost of your current position, which does include all groups. This works out to help you average out better entry and exit prices, essentially a method of DCAing.
You can set the minimum sale amount, which is to keep it from placing orders below your exchanges minimum dollar trade cost.
The included oscillators are as follows:
Chande Momentum cross
Moving Average Cross
MACD cross
%B Bollinger cross
Stochastic cross + region filter
Stochastic RSI cross + region filter
SMII cross and region
Three RMIs
Standard RSI
LSMA-smoothed RSI
Know Sure Thing
RSI of KST
Coppock Curve
RSI of Curve
PPO
RSI of PPO
Trix
RSI of Trix
So the idea is that this is essentially multiple strategies combined into one backtestable house. Balance is calculated for all position sizes in order to try to prevent false entries that plague so many scripts (IE, you set pyramiding to 2, each buy $1000, initial balance $1000, and yet it buys two orders off the bat for $2000 total and nets 400% profit because the second was considered free)/
You tune each side and position size them so that they work together as well as you can and in doing so you are able to create a single backtest that is capable of running a bot, essentially, between multiple strategies - you can run a slower Moving Average cross, a faster SMI cross or MACD, or Bollinger that grabs big moves only, all the while having MACD trade small bonuses along the way. This way you can weight the Risk to Reward of each against eachother.
I will not try to claim this is something you can open and with no work have the best bot on the planet. This scripts intention is to take a lot of relatively common trading strategies and combine them under on roof with some risk management and the ability to weigh each against eachother.
If you are looking for a super advanced singular algorithm that tries to capture every peak and valley exactly on the dot, this is not for you. If you are looking for a tool with a high level of customizability, with a publisher who intends to update it to the best of his ability in accordance to seeking to make the best product that I personally can make for both myself and the community (because I will be using this myself of course!) that was specifically designed with the intention of performing well in spot markets by averaging low entry costs and high exit costs, this is for you! That is the exact intention here.
I do not trade margin currently, I trade spot. I am sure this script can be tuned to work on margin but this is not my intention or area so if this is you and there is something you need for margin specifically implemented, ask, because I likely don't know what you need yet.
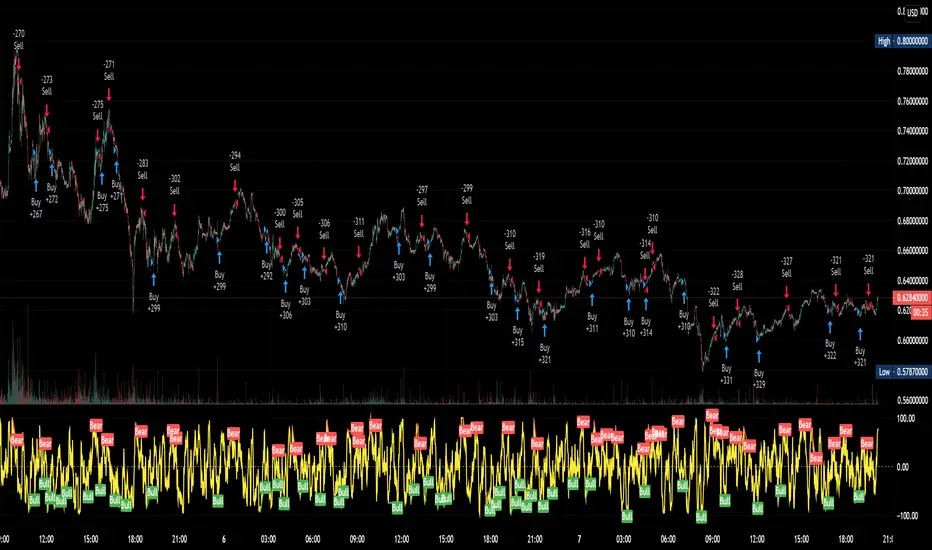
The current backtest shown is hand-optimized by myself for BTC/USD 1hr market with NO stop loss enabled and all sales weighed to be around 0% minimum profit from the total average entry cost.
I chose to run it myself with no stop losses because Bitcoin is so bullish to me. The stop losses can still be very profitable, but not 1495% net profit. This style of automation is not for everyone as when running with no stop loss and the requirement every sale is somewhat profitable, or at least no very noticeable loss, you wind up relying on yourself to manually stop out if things crash too much and the bot has to stop trading to wait for market to go back up. The thing to do here if you are playing without a stop loss is to have your own alerts set at your fear level, a % drop in a period of time or something like that, and when you reach that point I would consider resetting the bot so it continues to take trades. I personally will accept a temporary drop in USD as long as I can keep my BTC holdings up overall as the goal should always be to have as many BTC as possible by the start and end of the bull run.
Zentrische Oszillatoren

Combo Backtest 123 Reversal & MovROC (KST indicator) This is combo strategies for get a cumulative signal.
First strategy
This System was created from the Book "How I Tripled My Money In The
Futures Market" by Ulf Jensen, Page 183. This is reverse type of strategies.
The strategy buys at market, if close price is higher than the previous close
during 2 days and the meaning of 9-days Stochastic Slow Oscillator is lower than 50.
The strategy sells at market, if close price is lower than the previous close price
during 2 days and the meaning of 9-days Stochastic Fast Oscillator is higher than 50.
Second strategy
This indicator really is the KST indicator presented by Martin Pring.
the KST indicator is a weighted summed rate of change oscillator that
is designed to identify meaningful turns. Various smoothed rate of change
indicators can be combined to form different measurements of cycles.
WARNING:
- For purpose educate only
- This script to change bars colors.
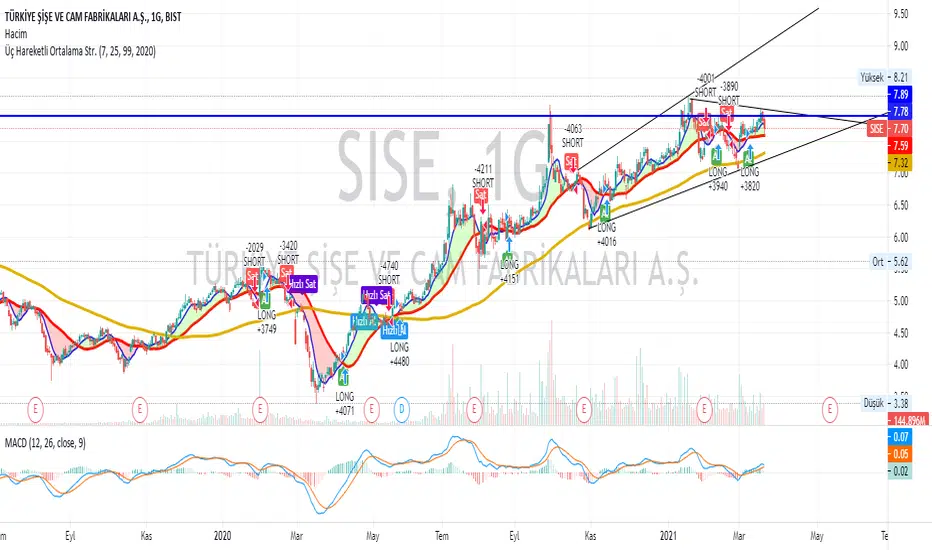
Three moving average strategies
If the short term (Default 7) moving average cuts the medium term (default 25) moving average, BUY. Conversely, it generates the SELL signal. If the long term (Default 99) moving average cuts its short term moving average, Quick SELL. Conversely, it can be interpreted as Fast SELL. You can change the moving average and the number of days as you wish, and you can trade in the short or long term. I hope it was useful.
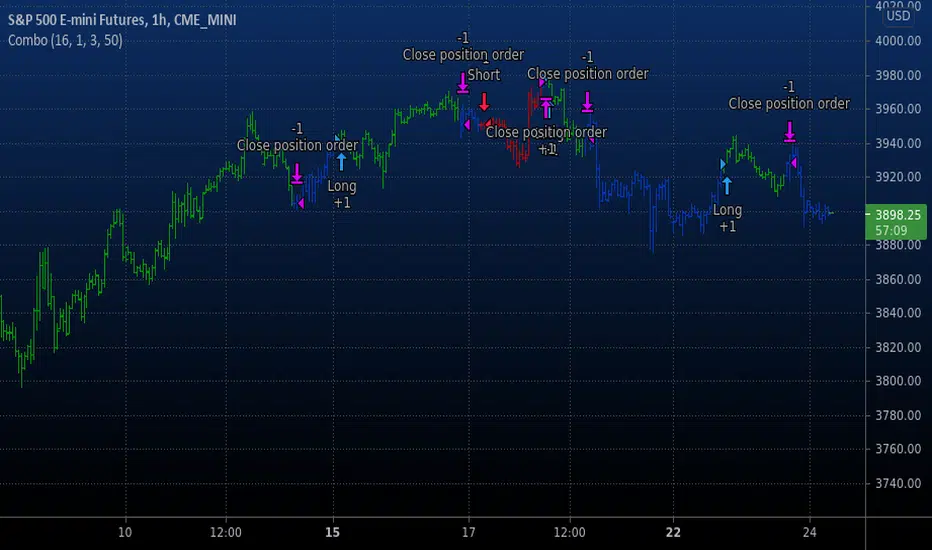
MACD Crossover trend strategy, Long and ShortHey everybody,
This is my first strategy and script I wrote mostly myself. There's tons of content out there to learn how to code in Pinescript and it's exactly what I wanted and needed in this time of my life.
In any case, I made a rather simple MACD crossover strategy that only takes trades in the direction of both EMA and SMA (there are inputs to change the length of the moving averages and lots of other stuff too).
If the MACD line crosses upwards on the signal line, while above the zero point of the histogram and the price is above EMA + SMA , it's a long signal.
If the MACD line cosses downards on the signal line, while below zero on the histogram and the price is below EMA + SMA , it's a short signal.
There are a lot of default variables that make no sense, for basically any symbol you're going to be looking at. You're going to have to adjust the EMA , SMA , backtest date, take profit, stop loss and all that good stuff yourself to find decently profitable parameters.
I made this myself because I couldn't really find a strategy out there that allowed for so much customizing and it's an easy way to get started in Pinescript.
If you have any suggestions, tips or you see a flatout mistake in my code, please let me know. I'm still learning, everyday and I'm enjoying every second of it.

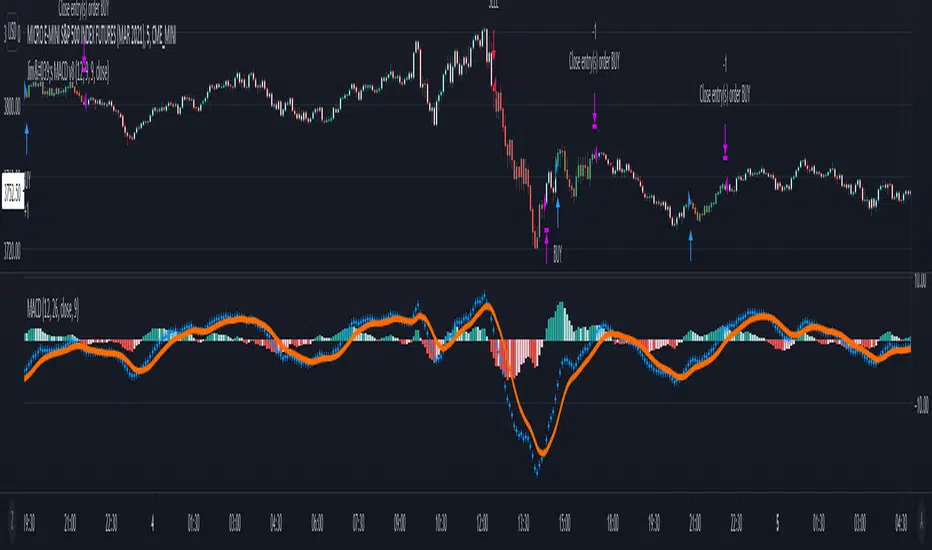
Momentum Strategy (BTC/USDT; 1h) - MACD (with source code)Good morning traders.
It's been a while from my last publication of a strategy and today I want to share with you this small piece of script that showed quite interesting result across bitcoin and other altcoins.
The macd indicator is an indicator built on the difference between a fast moving average and a slow moving average: this difference is generally plottted with a blue line while the orange line is simply a moving average computed on this difference.
Usually this indicator is used in technical analysis for getting signals of buy and sell respectively when the macd crosses above or under its moving average: it means that the distance of the fast moving average (the most responsive one) from the slower one is getting lower than what it-used-to-be in the period considered: this could anticipate a cross of the two moving averages and you want to anticipate this potential trend reversal by opening a long position
Of course the workflow is specularly the same for opening short positions (or closing long positions)
What this strategy does is simply considering the moving average computed on macd and applying a linear regression on it: in this way, even though the signal can be sligthly delayed, you reduce noise plotting a smooth curve.
Then, it simply checks the maximums and the minimums of this curve detecting whenever the changes of the values start to be negative or positive, so it opens a short position (closes long) on the maximum on this curve and it opens a long position (closes short) on the minimum.
Of course, I set an option for using this strategy in a conventional way working on the crosses between macd and its moving average. Alternatively you can use this workflow if you prefer.
In conclusion, you can use a tons of moving averages: I made a function in pine in order to allw you to use any moving average you want for the two moving averages on which the macd is based or for the moving average computed on the macd
PLEASE, BE AWARE THAT THIS TRADING STRATEGY DOES NOT GUARANTEE ANY KIND OF SUCCESS IN ADVANCE. YOU ARE THE ONE AND ONLY RESPONSIBLE OF YOUR OWN DECISIONS, I DON'T TAKE ANY RESPONSIBILITY ASSOCIATED WITH THEM. IF YOU RUN THIS STRATEGY YOU ACCEPT THE POSSIBILITY OF LOOSING MONEY, ALL OF MY PUBBLICATIONS ARE SUPPOSED TO BE JUST FOR EDUCATIONAL PURPOSES.
IT IS AT YOUR OWN RISK WHETHER TO USE IT OR NOT
But if you make money out of this, please consider to buy me a beer 😜
Happy Trading!

Delta-RSI Strategy (with filters)Delta-RSI Strategy (with filters):
This is a version of the Delta-RSI Oscillator strategy with several criteria available to filter entry and exit signals. This script is also suitable for backtesting over a user-defined period and offers several risk management options (take profit and stop loss).
Since the publication of the Delta-RSI Oscillator script, I have been asked many times to make it compatible with the Strategy Tester and add filtering criteria to minimize "false" signals. This version covers many of these requests. Feel free to insert your favorite D-RSI parameters and play around!
ABOUT DELTA-RSI
Delta-RSI represents a smoothed time derivative of the RSI designed as a momentum indicator (see links below):
INPUT DESCTIPTION
MODEL PARAMETERS
Polynomial Order : The order of local polynomial used to interpolate the relative strength index (RSI).
Length : The length of the lookback frame where local regression is applied.
RSI Length : The timeframe of RSI used as input.
Signal Length : The signal line is a EMA of the D-RSI time series. This input parameter defines the EMA length.
ALLOWED ENTRIES
The strategy can include long entries, short entries or both.
ENTRY AND EXIT CONDITIONS
Zero-crossing : bullish trade signal triggered when D-RSI crosses zero from negative to positive values (bearish otherwise)
Signal Line Crossing : bullish trade signal triggered when D-RSI crosses from below to above the signal line (bearish otherwise)
Direction Change : bullish trade signal triggered when D-RSI was negative and starts ascending (bearish otherwise)
APPLY FILTERS TO
The filters (described below) can be applied to long entry, short entry and exit signals.
RELATIVE VOLUME FILTER
When activated, the D-RSI-driven entries and exits will be triggered only if the current volume is greater than N times the average over the last M bars.
VOLATILITY FILTER
When activated, the D-RSI-driven entries and exits will be triggered only if the N-period average true range, ATR, is greater than the M-period ATR. If N < M, this condition implies increasing volatility.
OVERBOUGHT/OVERSOLD FILTER
When activated, the D-RSI-driven entries and exits will be triggered only if the value of 14-period RSI is in the range between N and M.
STOP LOSS/TAKE PROFIT
Fixed and trailing stop loss as well as take profit options are available.
FIXED BACKTESTING START/END DATES
If the checkboxes are not checked, the strategy will backtest all available price bars.

[KL] BOLL + MACD Strategy v2 (published)This strategy will look for opportunities when price touches the lower Bollinger band, then enters Long when it anticipates a MACD crossover signal.
Setup: on 1-day chart interval
Exits when either (a) hitting trailing stop loss, or (b) meeting risk-to-reward, if defined by user.

TSI HMA CCIHi!
This strategy has TSI and CCI indicators with the CCI being based on a HMA instead of the Price.
There is a number of conditions that must combine to create buy or sell signals, but it is basically a couple of MA crossovers.
The strategy opens new orders on each candle if the conditions are met, Either direction, so it is hedging.
It wont open new orders if there is a floating loss, and so is constantly attempting to hold a floating profit (drawup instead of drawdown)
But It has a StopLoss (set by user) for closing of losing orders, and it closes all orders in basket style when account is in profit to users set amount target profit.
Low commission set to simulate swap but Forex pairs generally dont have commission like the crypto exchanges do. So if you use this on cryptos, remember to increase the commission to your brokers amount.
Crypto users will likely find that because this opens so many orders the commission could erase its profits.
So i recommend this for Forex only, and perhaps, only NZDUSD 4H chart. other pairs, change settings for.
The strategy has settings for testing on target time spans, so you could test it on just Jan-Feb 2020 for example, if you want, or from Jan 2020 to present day.
Have Fun! Open Script for copy/paste/edit/publish your own version :)

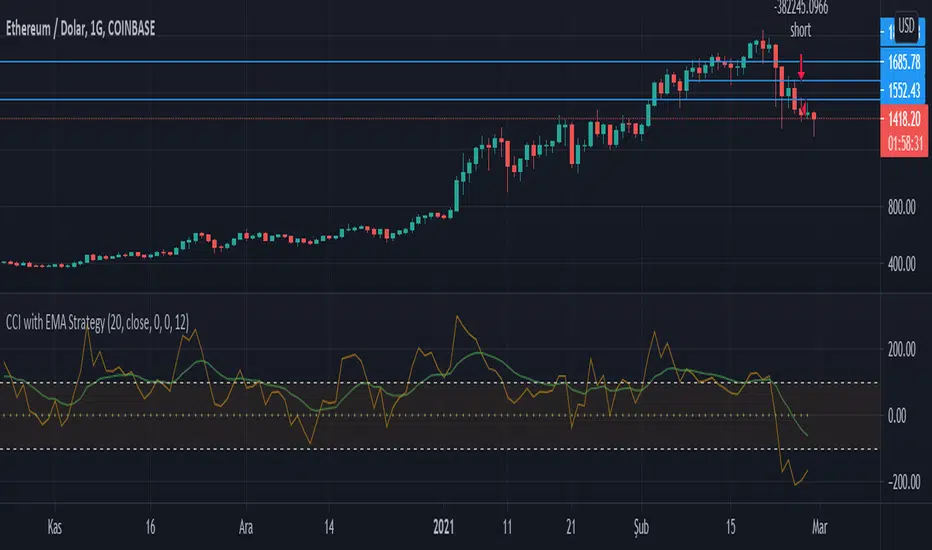
CCI with EMA StrategyI designed it as buy and sell when the cci 0 point cut, but you can optimize it by changing the buy sell points
I used moving average to smooth out cci's movements
Jim's MACDMACD Buy/Sell Strategy
Filters bearish crossovers above the 0 line and bullish crossovers below.
Uses 34 ema to further filter the trades and take only longs above and only shorts below.
Apply at least 2:1 risk to reward ratio to account for losing trades.
Trade at own risk!
RSI-VWAP Indicator %█ OVERALL
Simple and effective script that, as you already know, uses vwap as source of the rsi, and with good results as long as the market has no long-term downtrend.
RsiVwap = rsi (vwap (close), Length)
The default settings are for BTC in a 30 minute time frame. For other pairs and time frames you just have to play with the settings.
█ FEATURES
• The option to start trading from a certain date has been added.
• To make the profit more progressive, a percentage of your equity is used for entries and a percentage of your position is used for closings.
• The option to trade in Spot mode has been added, since, for the TradingView backtest, the money is infinite and if you do not limit it somehow,
it would offer you much better profits than the live trading.
QuantityOnLong = Spot ? (EquityPercent / 100) * ((strategy.equity / close) - strategy.position_size) : (EquityPercent / 100) * (strategy.equity / close)
• The option to stop the system when the drawdown exceeds the fixed limit has been added.
Drawdown, as you already know, is a very important measure of risk in trading systems.
The maximum drawdown will tell us what the maximum loss of a trading system has been during a period. This maximum loss is determined by:
strategy.risk.max_drawdown(Risk, strategy.percent_of_equity)
• Leverage plotted on labels added.
█ ALERTS
To enjoy the benefits of automatic trading, TradingView alerts can be used as direct buy-sell orders on spot, or long-close orders with leverage.
Currently there are Chrome extensions that act as a bridge between TradingView and your Exchange or Broker.
This is an example of syntax for this type of extensions. Copy and paste a message like this into the alert window:
{{strategy.order.action}} @ {{strategy.order.price}} | e = {{exchange}} a = account s = {{ticker}} b = {{strategy.order.action}} {{strategy.order.alert_message}}
█ NOTE
Certain Risks of Live Algorithmic Trading You Should Know:
• Backtesting cannot assure actual results.
• The relevant market might fail or behave unexpectedly.
• Your broker may experience failures in its infrastructure, fail to execute your orders in a correct or timely fashion or reject your orders.
• The system you use for generating trading orders, communicating those orders to your broker, and receiving queries and trading results from your broker may fail.
• Time lag at various point in live trading might cause unexpected behavior.
• The systems of third parties in addition to those of the provider from which we obtain various services, your broker, and the applicable securities market may fail or malfunction.
█ THANKS
Thanks to TradingView, its Pine code, its community and especially those Pine wizards who post their ideas that helps us to learn.
If the world is heading toward a equitable new world economic order, let's get rich first ...
Happy trading!

MA Divergences StrategyThis is the Strategy version of the Study I published. It is a Moving Average that can be applied to any plot to plot divergences on any oscillator, as well as perform backtesting. You'll need a REALLY good oscillator to perform live trades using this alone, but I think it is a valuable tool and had the Strategy hanging around and for some reason didn't upload it yet.
So here it is.
Turn Length to 1 to follow the oscillator without lag. Turn Length up if you are getting too many false signals or tweak the original oscillator settings.
MACD 50x Leveraged Strategy Real Equity Simulation Hello, I wrote this script to merge the two scripts I shared before.
The aim here is to see the real value of the state of the capital as a result of leveraged transactions and to combine both long and short directions.
Scripts :
MACD Long 50x Leverage Strategy :
MACD Short 50x Leverage Strategy :
The parameters have not changed so they are the same as the previous two scripts:
Adding margin: Forbidden or not specified. (Add Margin : No)
Position Size : %1 (0.01) (For each trade)
Stop-Loss : %2 (For each trade)
Long : Crossover(delta,0) (Standard MACD)
Long Exit : Long Stop Level or Short Entry
(In the case of Long Stop, all trades are closed and no positions are opened in short direction.)
Short : Crossunder(delta,0) (Standard MACD)
Short Exit : Short Stop or Long Entry
(In the case of Short Stop, all trades are closed and no positions are opened in the long direction.)
NOTE :
This is a simulation made using standard parameters, showing the state of the balance in very simple rules with leveraged transactions only.
The nice thing here is the direct observation of the results by making modifications on the strategy parameters.
Regards.


MACD Price Projected Bands [MPPB] Strategy for NIFTY / BTC 2 minMACD Price Projected Bands is an intraday NON REPAINTING Strategy to be used over BTCUSD and NIFTY on 2mins charts for optimum results!!
How the Strategy works
The strategy uses MACD with standard configuration as its main component.
The adaptive Bands are calculated over the MACD lookback, and MACD crosses of the adaptive bands are projected over the Price for creating a decision logic
A cyclic Trend Filter is used to calculate the Optimum Entry and Exit Points for the Strategy,
Levels are also plotted over the price projected bands for better visualisation of the targets!
What is used !
Macd_config : { fast:12 , slow:26 , signal:9 }
Lookback Length : 55
The Strategy has Provision for Alerts
You get Two signals
1. MPPBS Buy Signal
2. MPPBS Sell Signal
How the Visual Target System Works and How to trade Using this Strategy
An Adaptive Projected Band is constructed using MACD for traders to get Visual inputs regarding targets!!
The Trading Methodologies are in below Charts
For Short Trades
For Long Trades
Strategy Configurations for Backtest
For Englishmen!
The Backtesting Rules in the Strategy calculates only when order gets filled, the basic pyramiding in the strategy is set to 1, i.e The maximum number of entries allowed in the same direction is set to 1,
Also we trade only 1 quantity of the security with initial capital of 100000USD, and The commission type used in the strategy is set to 0.05 USD that means we pay 0.05USD as commissions in every trade!
For Coders!
{
calc_on_order_fills=true,
pyramiding=1,
default_qty_type=strategy.fixed,
default_qty_value=1,
initial_capital=100000,
currency=currency.USD,
commission_type= strategy.commission.cash_per_order,
commission_value = 0.05
}
How can you get access
Only do private message to me, donot use comment box for requesting access!

RSI of MACD Strategy [Long only]This strategy uses the RSI on MACD indicator.
BUY
====
When RSI indicator crossing over 30 or 35 line and price above slow ema
Note: when the position already taken, you may reenter on the purple candle
Partial Exit
==========
Partial profit taking option is available in settings. If this is selected , 1/3 position exited when RSI indicator crossing down 80 line
Close
=====
When RSI indicator crossing below 15
Stop Loss
=========
I havent used hard stop loss in this strategy. Reason is , when price going down , indicator may go up ... so just wanted to ride along with indicator ...
Stop loss mentioned in the settings is used in calculation of how many units can be be purchased based on risk level
Tested with SPY and QQQ ETFs on hourly chart
Warning
=========
For the eductional purposes only ...
This is not a financial advise. please do your own research before taking any trading decission

MACD Strategy (SL/TP Levels and Risk Management)Strategy based on MACD and EMA.
- Risk/Reward Ratio can be adjusted
- SL level can be slightly adjusted (Takes the last low/high as SL)
- Visual representation of SL and TP levels
- Risk management => 1 % max loss on a trade

Super Momentum StrategyThis is a strategy utilizing multiple of Evergets RMI (thanks to him for permission to publish) and a Chance Momentum.
It buys when 4 of the RMIs are below their thresholds and sells when they are above. There is a 5th one I added last night that works in Reverse - buy when its above and sell when below, which should work better for pyramiding strats by using it at the right rate to set the overall trend.
Very basic sample below, I could have set it up better as my example but just want to publish.

BITCOIN AUTO TRADING STRATEGYBITCOIN AUTO TRADING STRATEGY
This strategy shows buy and sell signal. Designed and optimized only for Bitcoin. You can use it spot or futures markets and 30 minutes time frame. Indicator gives trade points when optimized sma trending but filtered choppinnes index. Profit factor over 3 for all time backtest period. Care using when you set leverage. I recommend maximum 5x leverage for auto trading.
Profitable trade count 119
Lost trade count 115
Profit factor 3
For access message me or go to my web link on my profile.

RMI + Triple HMRSI + Double EVWRSI + TERSI + CMO StrategyThis is a strange experimental strategy WIP that I decided to upload an early version to share some of what I am working on. Just one script of a few.
It combines Chande Momentum with RMI and some weird ones I am experimenting with - Triple Hull MA RSI, Double Exponential + Volume Weighted RSI, Triple Exponential RSI. And to top it off, a final oscillator that combines the THMRSI with the RMI.
The main intention here, currently, is to test the usefulness of each on different timeframes and values. Currently it is considered to buy when all are below their threshold and sell when all are above, with the chande momentum crossing its line as the final confirmation.
For now there is no individual for each of the unique elements included. I am going to likely use this is a working house project to test other experimental indicators in the future.
It may be some of these are better suited for long term but I do think they have valid uses in checking short and long term momentum at the very least.
I copied the RMI from Everget.

Index RobinFull trading strategy for Stocks, Equity ETF’s, and Crypto. Not for FOREX or commodities.
Buy/Sell signals, and money management.
Low drawdown, consistent gains. Equity protection during crashes!
Long strategy for long term bullish assets. Best for Leveraged Long Equity ETF’s.
Index Robin has also performed well on Crypto Assets such as BTCUSD , ETHUSD , and XRPUSD.
Made for daily charts, some markets perform better with 4 hour and 1 hour charts.
Always test all 3 time frames.
The main features of Trading Robin are:
Adjustable risk % per trade
Adjustable minimum % profit target per series of trades
Proprietary buy signals
Proprietary exit signals
The default inputs show great results on the assets listed below but they are also adjustable and may show better results if modified on certain assets so feel free to play around with them.
Some of the markets Index Robin has been tested and performed well on are:
TQQQ
SPXL
SPX
SPY
TNA
UDOW
UPRO
UMDD
URTY
TSLA
AMZN
NFLX
ROKU
MSFT
FB
Even Crypto’s like:
BTCUSD
ETHUSD
XRPUSD
There are many more.
For access, send me a PM on TradingView.
Enjoy.

Combo Backtest 123 Reversal & MACD Crossover with Trail and Stop
This is a modification of @HPotter "Combo Backtest 123 Reversal & MACD Crossover" script.
I've added a trail stop, basic leverage simulation and stop loss.
Below is HPotter's explanation of the script principals.
First strategy
This System was created from the Book "How I Tripled My Money In The
Futures Market" by Ulf Jensen, Page 183. This is reverse type of strategies.
The strategy buys at market, if close price is higher than the previous close
during 2 days and the meaning of 9-days Stochastic Slow Oscillator is lower than 50.
The strategy sells at market, if close price is lower than the previous close price
during 2 days and the meaning of 9-days Stochastic Fast Oscillator is higher than 50.
Second strategy
MACD – Moving Average Convergence Divergence. The MACD is calculated
by subtracting a 26-day moving average of a security's price from a
12-day moving average of its price. The result is an indicator that
oscillates above and below zero. When the MACD is above zero, it means
the 12-day moving average is higher than the 26-day moving average.
This is bullish as it shows that current expectations (i.e., the 12-day
moving average) are more bullish than previous expectations (i.e., the
26-day average). This implies a bullish , or upward, shift in the supply/demand
lines. When the MACD falls below zero, it means that the 12-day moving average
is less than the 26-day moving average, implying a bearish shift in the
supply/demand lines.
A 9-day moving average of the MACD (not of the security's price) is usually
plotted on top of the MACD indicator. This line is referred to as the "signal"
line. The signal line anticipates the convergence of the two moving averages
(i.e., the movement of the MACD toward the zero line).
Let's consider the rational behind this technique. The MACD is the difference
between two moving averages of price. When the shorter-term moving average rises
above the longer-term moving average (i.e., the MACD rises above zero), it means
that investor expectations are becoming more bullish (i.e., there has been an
upward shift in the supply/demand lines). By plotting a 9-day moving average of
the MACD , we can see the changing of expectations (i.e., the shifting of the
supply/demand lines) as they occur.
WARNING:
- For purpose educate only
- This script to change bars colors.

Combo Backtest 123 Reversal & MACD Crossover This is combo strategies for get a cumulative signal.
First strategy
This System was created from the Book "How I Tripled My Money In The
Futures Market" by Ulf Jensen, Page 183. This is reverse type of strategies.
The strategy buys at market, if close price is higher than the previous close
during 2 days and the meaning of 9-days Stochastic Slow Oscillator is lower than 50.
The strategy sells at market, if close price is lower than the previous close price
during 2 days and the meaning of 9-days Stochastic Fast Oscillator is higher than 50.
Second strategy
MACD – Moving Average Convergence Divergence. The MACD is calculated
by subtracting a 26-day moving average of a security's price from a
12-day moving average of its price. The result is an indicator that
oscillates above and below zero. When the MACD is above zero, it means
the 12-day moving average is higher than the 26-day moving average.
This is bullish as it shows that current expectations (i.e., the 12-day
moving average) are more bullish than previous expectations (i.e., the
26-day average). This implies a bullish, or upward, shift in the supply/demand
lines. When the MACD falls below zero, it means that the 12-day moving average
is less than the 26-day moving average, implying a bearish shift in the
supply/demand lines.
A 9-day moving average of the MACD (not of the security's price) is usually
plotted on top of the MACD indicator. This line is referred to as the "signal"
line. The signal line anticipates the convergence of the two moving averages
(i.e., the movement of the MACD toward the zero line).
Let's consider the rational behind this technique. The MACD is the difference
between two moving averages of price. When the shorter-term moving average rises
above the longer-term moving average (i.e., the MACD rises above zero), it means
that investor expectations are becoming more bullish (i.e., there has been an
upward shift in the supply/demand lines). By plotting a 9-day moving average of
the MACD, we can see the changing of expectations (i.e., the shifting of the
supply/demand lines) as they occur.
WARNING:
- For purpose educate only
- This script to change bars colors.
