Buy The F*cking Dip [DotGain]How to Interpret the "Buy The F*cking Dip" (BTFD) Indicator
Main Purpose and Timeframe
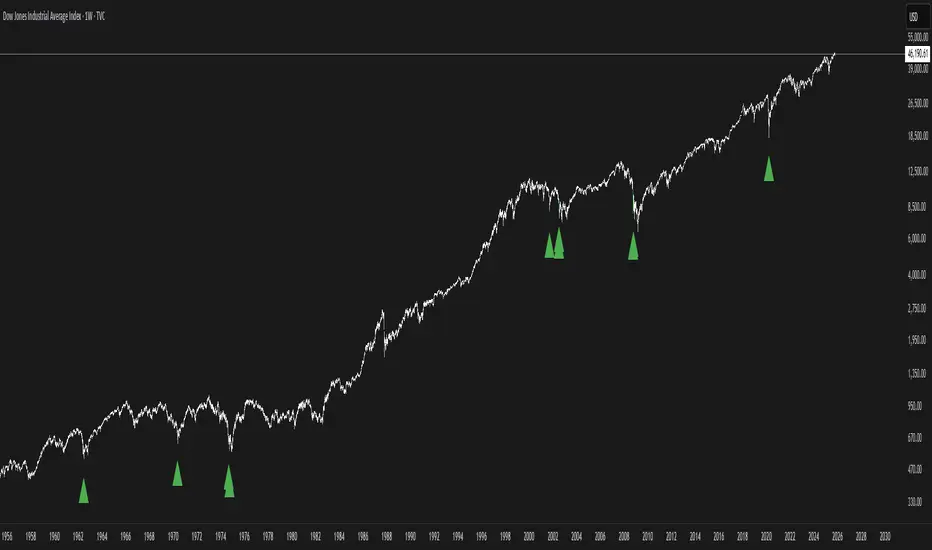
The BTFD indicator is a confluence indicator designed to identify rare moments of extreme capitulation and panic in the market. As the name suggests, its primary focus is identifying significant buying opportunities ("Dips") on high timeframes.
Recommended Timeframes: Minimum Daily chart, ideally Weekly chart.
Primary Signal: The green "Buy" triangle is the default signal to watch for.
The Buy Signal (Green Triangle)
A green "Buy" triangle appears only when all three of the following conditions are met simultaneously. It signals not just a minor pullback, but a potentially macro-level oversold condition.
High Panic (CM Williams Vix Fix): The market is in a state of heightened volatility or "fear." This indicates that sellers are acting out of panic.
Structurally Oversold (Deviation from MA): The price has deviated extremely far (default: >10%) below its long-term moving average (default: 200-period EMA). This signals that the price is "cheap" in the big picture.
Short-Term Overextended (TRMAD): The price has fallen extremely hard and fast relative to its recent volatility (ATR) (default: < -3.0). This signals "maximum pain" on a short-term level.
In summary, a green triangle means: The market is panicky, structurally undervalued, and extremely oversold short-term. These are often the moments when long-term bottoms are formed.
The Sell Signal (Red Triangle)
The indicator can also identify the exact opposite: moments of extreme euphoria or "blow-off tops."
Disabled by Default: The red "Sell" triangle is disabled by default in the settings (display=display.none), as the indicator's focus is on buying.
Meaning (if enabled): It signals that the market (1) has high volatility, (2) is structurally overbought (far above its 200 MA), and (3) is extremely overextended (euphoric) on a short-term basis.
Visual Adjustments (In the "Style" Tab)
By default, only the green "Buy" triangle is active. You can, however, enable other visuals in the indicator's "Style" settings tab:
Buy (Green Triangle): On by default.
Sell (Red Triangle): Off by default.
Signal Bar Color: Colors the candle green/red. Off by default.
Signal Background: Shows a transparent green/red background. Off by default.
Have fun :)
Disclaimer
This "Buy The F*cking Dip" (BTFD) indicator is provided for informational and educational purposes only. It does not, and should not be construed as, financial, investment, or trading advice.
The signals generated by this tool (both "Buy" and "Sell") are the result of a specific set of algorithmic conditions. They are not a direct recommendation to buy or sell any asset. All trading and investing in financial markets involves substantial risk of loss. You can lose all of your invested capital.
Past performance is not indicative of future results. The signals generated may produce false or losing trades. The creator (© DotGain) assumes no liability for any financial losses or damages you may incur as a result of using this indicator.
You are solely responsible for your own trading and investment decisions. Always conduct your own research (DYOR) and consider your personal risk tolerance before making any trades.
Capitulation
MILLION MEN - Capitulation Hunter What it is
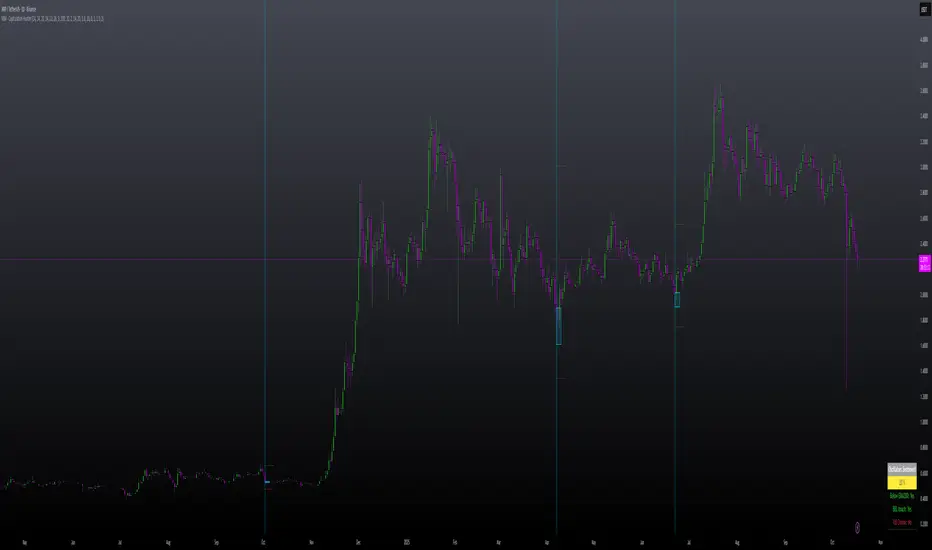
MILLION MEN – Capitulation Hunter detects potential capitulation buy-limits using a confluence of momentum, volatility, and liquidity cues. It combines a 5-oscillator sentiment (RSI / Stoch / CCI / MFI / MACD histogram) with EMA200 trend context, Bollinger lower band proximity, volume climax, and an optional liquidity sweep check. When all filters align, the tool paints a BUY-LIMIT zone and proposes SL/TP levels.
How it works (high-level)
Oscillator sentiment (0–100%): counts how many of the five oscillators are bullish; capitulation candidate = 0%.
Trend & location: price below EMA200 and at/through BB lower band (basis ± mult×σ).
Selling climax: current volume ≥ X × volume SMA.
Liquidity sweep (optional): current low sweeps the prior N-bar low but closes back above it.
Confirmation: optional 0–2 extra bars (close > low and bullish bodies) before validating.
On validation, the script draws: BUY-LIMIT zone, dotted SL = zone bottom − ATR×mult, TP by R:R, and a mini sentiment table.
How to use
Look for zones after fast, extended selloffs into BB-L with volume spike and oscillators at 0%.
Place pending BUY-LIMIT inside the painted zone; use the plotted SL/TP as a starting point.
Works across timeframes; adjust volume multiplier, sweep length, confirmation bars, and ATR×SL to your market.
For added confluence: HTF structure, session/flow, or order-book/liquidity context.
Originality & value
Instead of a generic mashup, this tool enforces a strict confluence: (1) five-oscillator capitulation, (2) location at BB-L under EMA200, (3) volume climax, (4) optional sweep/recapture, and (5) bar-based confirmation—then auto-renders a practical trade plan (zone + SL/TP) and a readable sentiment table. All calculations are manual (no lookahead) and designed for clarity and execution.
Limitations & transparency
Capitulation can persist during strong downtrends; always use structure and risk management.
SL/TP visuals are hints, not orders; adapt to instrument volatility and liquidity.
Non-standard chart types aren’t supported for signals. No future data is used.
This is not financial advice; past performance does not guarantee future results.
(ملخص عربي )
مؤشر يلتقط سيناريوهات الاستسلام البيعي (Capitulation) عبر شروط متشددة: مزاج مؤشرات الزخم = 0%، السعر تحت EMA200 وعند/أسفل BB-L، ذروة فوليوم، واختياري سويب قيعان ثم ارتداد. عند التأكيد يرسم منطقة BUY-LIMIT ويقترح SL/TP. استخدمه مع هيكل السوق وإدارة المخاطر.
Climax Absorption Engine [AlgoPoint]Overview
Have you ever noticed that during a sharp, fast-moving trend, the single candle with the highest volume often appears right at the end, just before the price reverses? This is no coincidence. It's the footprint of a Climax Event.
This indicator is designed to detect these critical moments of maximum panic (capitulation) and maximum euphoria (FOMO). These are the moments when retail traders are driven by emotion, creating a massive pool of liquidity. The "Climax Absorption Engine" identifies when Smart Money is likely absorbing this liquidity to enter large positions against the crowd, right before a potential reversal.
It's a tool built not just on mathematical formulas, but on the principles of market psychology and smart money activity.
How It Works: The 3-Step Logic
The indicator uses a sequential, three-step process to identify high-probability reversal setups:
1. Momentum Move Detection: First, the engine identifies a period of strong, directional momentum. It looks for a series of consecutive, same-colored candles and confirms that the move is backed by a steeply sloped moving average. This ensures we are only looking for climactic events at the end of a significant, non-random move.
2. Climax Candle Identification: Within this momentum move, the indicator scans for a candle with abnormally high volume—a volume spike that is significantly larger than the recent average. This candle is marked on your chart with a diamond shape and is identified as the Climax Candle. This is the point of peak emotion and the primary area of interest. No signal is generated yet.
3. Absorption & Reversal Confirmation: A climax is a warning, not a signal. The final signal is only triggered after the market confirms the reversal.
- For a BUY Signal: After a bearish (red) Climax Candle, the indicator waits for a subsequent green candle to close decisively above the midpoint of the Climax Candle. This confirms that the panic selling has been absorbed by buyers.
- For a SELL Signal: After a bullish (green) Climax Candle, it waits for a subsequent red candle to close decisively below the midpoint. This confirms that the euphoric buying has evaporated.
How to Interpret & Use This Indicator
- The Diamond Shape: A diamond shape on your chart is an early warning. It signifies that a climax event has occurred and the underlying trend is exhausted. This is the time to pay close attention and prepare for a potential reversal.
- The BUY/SELL Labels: These are the final, actionable signals. They appear only after the reversal has been confirmed by price action.
- A BUY signal suggests that capitulation selling is over, and buyers have absorbed the pressure.
- A SELL signal suggests that FOMO buying is over, and sellers are now in control.
Key Settings
- Momentum Detection: Adjust the number of consecutive bars and the EMA slope required to define a valid momentum move.
- Climax Detection: Fine-tune the sensitivity of the volume spike detection using the Volume Multiplier. Higher values will find only the most extreme events.
- Confirmation Window: Define how many bars the indicator should wait for a reversal candle after a climax event before the setup is cancelled.

Smooth Hash RibbonsSame as the popular hash ribbon indicator, but slightly more responsive and with a better smoothing kernel.

Blockchain Fundamentals - MCCD - Miner Capitulation Conv/Div🔗Blockchain Fundamentals - MCCD - Miner Capitulation & Convergence Divergence
(a.k.a. Hash Ribbons)
Intro
Miner Capitulation has been talked about alot recently in the news and on twitter. I wanted to join the in fun and add my own spin on things.
Description
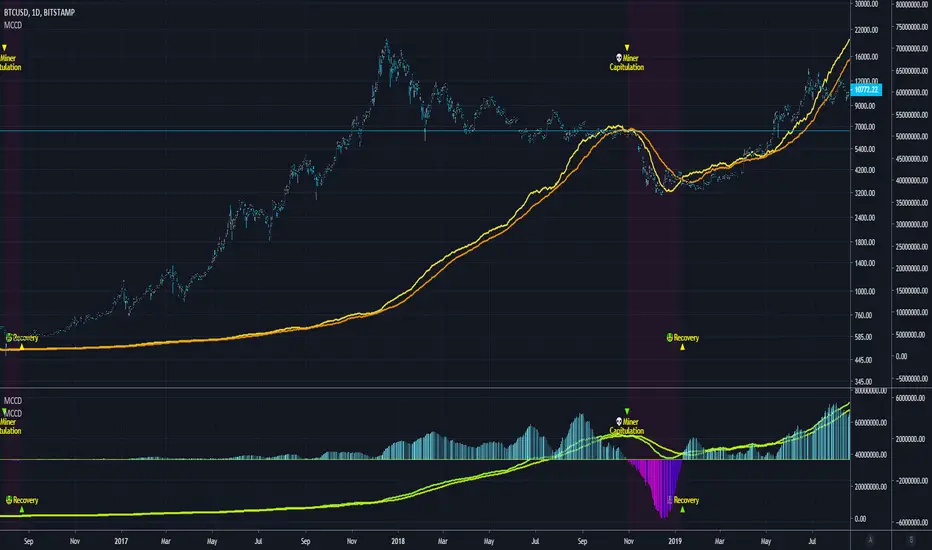
This shows the 30 (yellow) and 60 (orange) day moving average of the hash rate of bitcoin. I added an option to show the convergence/divergence of the two moving averages in a visual manner similar to the MACD.
I also added the ability to select both the length and type of MA used in the calculation of the capitulation so you can experiment.
Other additions include bar coloration by trade state, and background highlighting of capitulation periods.
Editable Capitulation/Recovery plots will show clearly when the crosses happen.
The way to replicate my display is to add the indicator twice below the chart and combine in the same pane. First indicator displays the averages by default. The second one you enable convergence/divergence display option and uncheck the rest.
Last I add the indicator one more time and dragged it on chart. Do not combine the scales into one, of else it will ruin the scale (you want them separate scales). Its just showing you possibilities, use whatever works for you!
👍 We hope you enjoyed this indicator and find it useful! We post free crypto analysis, strategies and indicators regularly. This is our 73rd script on Tradingview!
💬Check my Signature for other information
Emoji Sentiment Analyzer 😜Euphoria, fear, and greed are some aspects of emotional chart analysis. Our Emoji indicator makes tracking emotional traders easy and fun in any market.
Will you go with the herd or counter trade sentiment?
Want to see more Emojis on the chart? Drop us a comment with your request!

Mr Renev Dump alertHere is a script to know when big dumps, and pumps, are happening.
Meant for crypto (I know that's what most people are interested in - it's a mistake) and small caps.
Might work for other things have not checked.
With some random small cap:

Hammer StrikerThis indicator Scans for Divergence and Hammer and inverted Hammer and doji
after the first oversold spike must come with divergence a doji or a hammer is armed depending on the time frame
is the capitulation candle that is collected
u can then buy or sell
