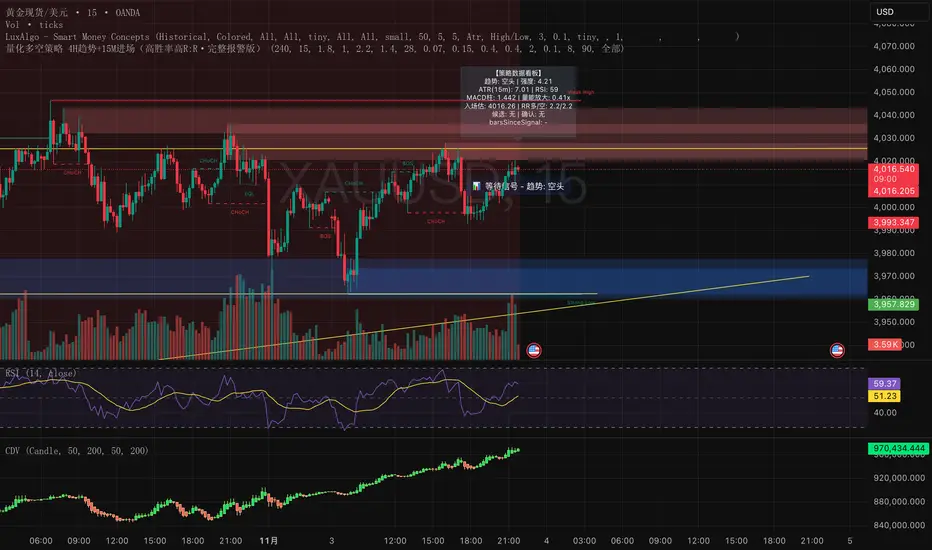
量化多空策略 4H趋势+15M进场(高胜率高R:R·完整报警版)这是一套结合多周期结构(4小时趋势 + 15分钟入场)的量化交易策略,
核心理念是「顺势而为 + 动量二次确认 + 高R:R风险控制」。
策略特点:
• 使用 4H EMA 趋势判定方向
• 结合 15m RSI + MACD 动量信号确认入场
• 二次确认(2~3 根内突破 + 动量共振)过滤假信号
• 自适应止盈止损(基于 ATR 和 ADX)
• 全自动计算 R:R、冷却周期、成交量放大过滤
适用场景
• 加密货币(BTC、ETH、SOL、BNB 等)
• 黄金 / 外汇 / 指数CFD
• 15m~1h短线趋势盯盘
• 适合希望提高信号质量、过滤假突破的交易者
注意事项
• 该策略为研究与教学用途,不构成投资建议
• 实盘前请先在回测与模拟盘验证参数
• 适度调整「确认根数」「R:R」「ADX阈值」以适应不同市场波动性
This is a multi-timeframe quantitative trading strategy combining the 4-hour trend with 15-minute entry signals.
Its core philosophy is “Trend following + Momentum confirmation + High R:R risk control.”
Key Features
• Uses 4H EMA structure to determine market trend
• Combines 15m RSI + MACD momentum for entry confirmation
• Dual confirmation within 2–3 bars (breakout + momentum alignment) to filter false signals
• Adaptive take-profit and stop-loss based on ATR and ADX
• Automatically calculates Risk/Reward ratio, cooldown period, and volume expansion filters
Best Use Cases
• Cryptocurrencies (BTC, ETH, SOL, BNB, etc.)
• Gold / Forex / Index CFDs
• Short-term trend tracking (15m–1h)
• Traders aiming to improve signal quality and avoid false breakouts
Notes
• This strategy is for research and educational purposes only — not financial advice.
• Always backtest and paper trade before live deployment.
• Adjust confirmation bars, R:R ratio, and ADX threshold to suit different market volatilities.
Candlestick analysis
Buy&Hold Profitcalculator in EuroTitle: Buy & Hold Strategy in Euro
Description:
This Pine Script implements a simple yet flexible Buy & Hold strategy denominated in Euros, suitable for a wide range of assets including cryptocurrencies, forex pairs, and stocks.
Key Features:
Custom Investment Amount: Define your invested capital in Euros.
Flexible Start & End Dates: Specify exact entry and exit dates for the strategy.
Automatic Currency Conversion: Supports assets priced in USD or USDT, converting the invested capital to chart currency using the EUR/USD exchange rate.
Single Entry and Exit: Executes a one-time Buy & Hold position based on the defined timeframe.
Profit and Performance Tracking: Calculates total profit/loss in Euros and percentage returns.
Smart Exit Label: Displays a dynamic label at the exit showing final position value, net profit/loss, and return percentage. The label automatically adjusts its position above or below the price bar for optimal visibility.
Visual Enhancements:
Position value and profit/loss plotted on the chart.
Background color highlights the active investment period.
Buy and Sell markers clearly indicate entry and exit points.
This strategy is ideal for traders and investors looking to simulate long-term positions and evaluate performance in Euro terms, even when trading USD-denominated assets.
Usage Notes:
Best used on daily charts for medium- to long-term analysis.
Adjust start and end dates, as well as invested capital, to simulate different scenarios.
Works with any asset, but currency conversion is optimized for USD or USDT-pegged instruments.

Trend Entry_0 [TS_Indie]Trend Entry_0 — Mechanism Overview
The core structure of this strategy is based on a price action reversal pattern, as detailed below:
In the case of a Bullish Trend Reversal:
The price initially moves in a bearish direction. When candle A forms a low lower than the previous low, the high of candle A becomes a key reference point.
If the next candle closes above the high of candle A , it confirms a Bullish Trend Reversal.
* Upon a Bullish signal, a Long position is opened at the opening price of the next candle (candle B).
* When a subsequent Bearish signal occurs, the Long position is closed at the opening price of the next candle (candle C).
In the case of a Bearish Trend Reversal:
The price initially moves in a bullish direction. When candle A forms a high higher than the previous high, the low of candle A becomes a key reference point.
If the next candle closes below the low of candle A , it confirms a Bearish Trend Reversal.
* Upon a Bearish signal, a Short position is opened at the opening price of the next candle (candle B).
* When a subsequent Bullish signal occurs, the Short position is closed at the opening price of the next candle (candle C).
Options
* The start and end dates of the backtest can be customized.
* The swing lines of the trend can be displayed as an optional visual aid.
* The user can choose whether to open only Long or Short positions.
Backtest Results and Observations
Based on the backtesting results of this strategy across various assets and timeframes, it has been observed that this approach works best on trending assets such as Gold, BTC, and stocks.
It also performs well on higher timeframes, starting from the Daily timeframe and above, especially when taking Long positions only.
However, when applied to currency pairs such as EUR/USD, the results tend to be less impressive.
I encourage everyone to try backtesting and further developing this strategy — adding new conditions or filters may potentially lead to improved performance.
Disclaimer
This script is intended solely for backtesting purposes, based on a particular price action pattern.
It does not constitute financial or investment advice.
Backtest results do not guarantee future performance.

AnkeAlgo A68 strategy™ || AnkeAlgo®[16.6]## ✅ Multi-Timeframe Trend Strategy Based on MFI and Momentum Factors
### 📌 Overview
This strategy combines **Money Flow Index (MFI)** and **Momentum** to identify trend continuation and momentum reversal opportunities in the crypto market. It focuses on volume-weighted capital flow and price strength, generating trend-biased signals suitable for swing and intraday traders.
---
### 📊 Technical Indicators Used
| Indicator | Purpose |
|-----------|---------|
| **MFI (Money Flow Index)** | Detects capital inflow/outflow and filters range-bound markets |
| **Momentum Indicator** | Measures price acceleration and confirms breakout strength |
| **Optional: ATR / EMA Filters** | Can be added for volatility stop or trend validation |
---
### ⚙️ Core Logic
- **Trend Confirmation**: MFI exceeds threshold and aligns with price direction
- **Momentum Entry Trigger**: Trades are executed only when momentum crosses a signal level
- **Noise Filter**: Avoids entries when MFI divergence or momentum weakness is detected
- **Position Management**: Supports ATR-based or percentage-based stop-loss systems
---
### 🪙 Market and Asset
✅ Designed for crypto derivatives
**Recommended symbol:** `ETHUSDT.P` (Perpetual Futures)
---
### ⏱️ Recommended Timeframes
- 30-minute
- 45-minute
- 1-hour
> The **45m timeframe** shows the most stable performance in forward testing.
---
### 📈 Strategy Features
- Performs best during trending and high-momentum phases
- Low overfitting risk, adaptable across different volatility environments
- Can be used as a signal engine for grid, martingale, or multi-asset systems
- Easily extendable to BTC, SOL, BNB, and other high-liquidity assets
---
### ⚠️ Risk Disclaimer
- This is **not** a mean-reversion strategy and may produce false signals in sideways markets
- Stop-loss management and position sizing are required for live deployment
- Backtest results do not guarantee live trading performance due to slippage and trading fees
---

Candle Breakout StrategyShort description (one-liner)
Candle Breakout Strategy — identifies a user-specified candle (UTC time), draws its high/low range, then enters on breakouts with configurable stop-loss, take-profit (via Risk:Reward) and optional alerts.
Full description (ready-to-paste)
Candle Breakout Strategy
Version 1.0 — Strategy script (Pine v5)
Overview
The Candle Breakout Strategy automatically captures a single "range candle" at a user-specified UTC time, draws its high/low as a visible box and dashed level lines, and waits for a breakout. When price closes above the range high it enters a Long; when price closes below the range low it enters a Short. Stop-loss is placed at the opposite range boundary and take-profit is calculated with a user-configurable Risk:Reward multiplier. Alerts for entries can be enabled.
This strategy is intended for breakout style trading where a clearly defined intraday range is established at a fixed time. It is simple, transparent and easy to adapt to multiple symbols and timeframes.
How it works (step-by-step)
On every bar the script checks the current UTC time.
When the first bar that matches the configured Target Hour:Target Minute (UTC) appears, the script records that candle’s high and low. This defines the breakout range.
A box and dashed lines are drawn on the chart to display the range and extended to the right while the range is active.
The script then waits for price to close outside the box:
Close > Range High → Long entry
Close < Range Low → Short entry
When an entry triggers:
Stop-loss = opposite range boundary (range low for longs, range high for shorts).
Take-profit = entry ± (risk × Risk:Reward). Risk is computed as the distance between entry price and stop-loss.
After entry the range becomes inactive (waitingForBreakout = false) until the next configured target time.
Inputs / Parameters
Target Hour (UTC) — the hour (0–23) in UTC when the range candle is detected.
Target Minute — minute (0–59) of the target candle.
Risk:Reward Ratio — multiplier for computing take profit from risk (0.5–10). Example: 2 means TP = entry + 2×risk.
Enable Alerts — turn on/off entry alerts (string message sent once per bar when an entry occurs).
Show Last Box Only (internal behavior) — when enabled the previous box is deleted at the next range creation so only the most recent range is visible (default behavior in the script).
Visuals & On-chart Info
A semi-transparent blue box shows the recorded range and extends to the right while active.
Dashed horizontal lines mark the range high and low.
On-chart shapes: green triangle below bar for Long signals, red triangle above bar for Short signals.
An information table (top-right) displays:
Target Time (UTC)
Active Range (Yes / No)
Range High
Range Low
Risk:Reward
Alerts
If Enable Alerts is on, the script sends an alert with the following formats when an entry occurs:
Long alert:
🟢 LONG SIGNAL
Entry Price:
Stop Loss:
Take Profit:
Short alert:
🔴 SHORT SIGNAL
Entry Price:
Stop Loss:
Take Profit:
Use TradingView's alert dialog to create alerts based on the script — select the script’s alert condition or use the alert() messages.
Recommended usage & tips
Timeframe: This strategy works on any timeframe but the definition of "candle at target time" depends on the chart timeframe. For intraday breakout styles, use 1m — 60m charts depending on the session you want to capture.
Target Time: Choose a time that is meaningful for the instrument (e.g., market open, economic release, session overlap). All times are handled in UTC.
Position Sizing: The script’s example uses strategy.percent_of_equity with 100% default — change default_qty_value or strategy settings to suit your risk management.
Filtering: Consider combining this breakout with trend filters (EMA, ADX, etc.) to reduce false breakouts.
Backtesting: Always backtest over a sufficiently large and recent sample. Pay attention to slippage and commission settings in TradingView’s strategy tester.
Known behavior & limitations
The script registers the breakout on close outside the recorded range. If you prefer intrabar breakout rules (e.g., high/low breach without close), you must adjust the condition accordingly.
The recorded range is taken from a single candle at the exact configured UTC time. If there are missing bars or the chart timeframe doesn't align, the intended candle may differ — choose the target time and chart timeframe consistently.
Only a single active position is allowed at a time (the script checks strategy.position_size == 0 before entries).
Example setups
EURUSD (Forex): Target Time 07:00 UTC — captures London open range.
Nifty / Index: Target Time 09:15 UTC — captures local session open range.
Crypto: Target Time 00:00 UTC — captures daily reset candle for breakout.
Risk disclaimer
This script is educational and provided as-is. Past performance is not indicative of future results. Use proper risk management, test on historical data, and consider slippage and commissions. Do not trade real capital without sufficient testing.
Change log
v1.0 — Initial release: range capture, box and level drawing, long/short entry by close breakout, SL at opposite boundary, TP via Risk:Reward, alerts, info table.
If you want, I can also:
Provide a short README version (2–3 lines) for the TradingView “Short description” field.
Add a couple of suggested alert templates for the TradingView alert dialog (if you want alerts that include variable placeholders).
Convert the disclaimer into multiple language versions.

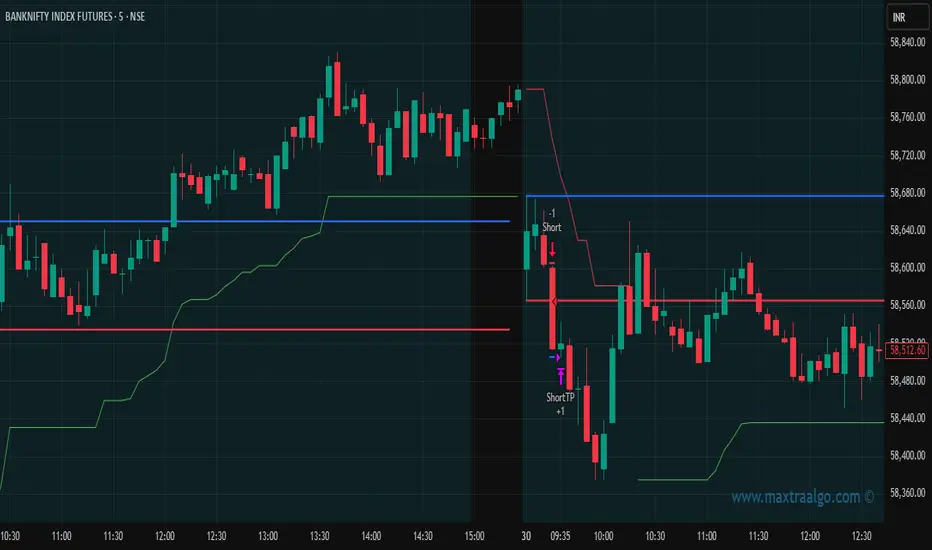
Maxtra Reversal Range Breakout StrategyReversal Range Breakout Strategy
This strategy uses the first candle as a directional filter. If the first candle is green, it anticipates a potential reversal and takes sell trades only. If the first candle is red, it looks for buy opportunities. The logic is to trade against the initial move, expecting a reversal after the early breakout or momentum spike.

Maxtra Range Breakout StrategyRange Breakout Strategy
This strategy identifies periods of price consolidation (range) and enters trades when the price breaks above or below the defined range. A breakout above the range signals a potential uptrend (buy), while a breakout below indicates a potential downtrend (sell). It helps capture strong directional moves following low-volatility phases.
XAUUSD 9-Grid Scalper (9-levels, 3pt TP)📈 Overview
The XAUUSD 9-Grid Scalper is a precision-based intraday strategy designed for gold scalping around key 9-based price zones. Gold (XAUUSD) often reacts strongly to levels that are multiples of 9, and this script builds a dynamic grid of 18 levels around the current price to capture short-term momentum moves.
This strategy uses 9-point take profits (TP) and configurable stop-loss levels, allowing for fast in-and-out scalps within volatile gold sessions. It’s optimized for short-term traders who focus on 1M–5M charts.
⚙️ Core Logic
Dynamic 9-Multiples Grid: Automatically plots 18 nearby levels spaced by multiples of 9.
Entry Signals:
Long when price breaks above a 9-level.
Short when price breaks below a 9-level.
Take Profit: Fixed at 9 points (configurable).
Stop Loss: Adjustable for flexible risk management.
Backtest-Ready: Uses strategy() for full performance analytics (win rate, profit factor, drawdown).
💡 Best Use Cases
Ideal for gold scalpers during London and New York sessions.
Works best on 1M–5M timeframes with high volatility.
Combine with volume or trend filters (e.g., RSI, MA slope) for improved accuracy.
🧠 Customization Options
Number of grid levels (default: 18)
Take profit & stop loss distance (default: 9pt TP)
Display toggle for 9-grid visualization
Optional filters for session time or volatility
⚠️ Disclaimer
This strategy is for educational and research purposes only.
Past performance does not guarantee future results. Always test on demo before trading live.

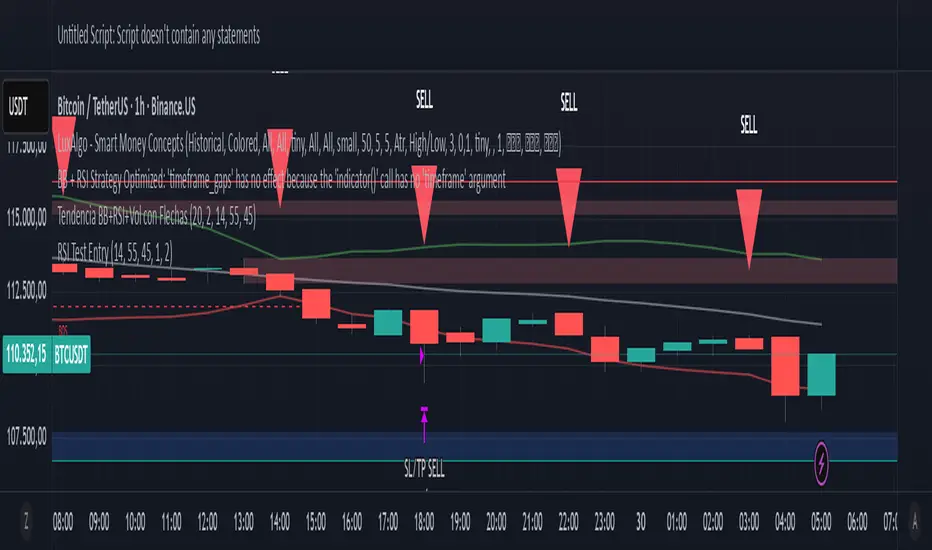
PriceAction & Economic StrategyThis indicator combines price-action logic with macroeconomic data to generate trading signals.
Features:
- Price-action signals: A bullish signal occurs when a candle closes above its open; a bearish signal occurs when a candle closes below its open.
- Signal gap: The indicator includes an input called "Signal Gap (bars)" that defines the minimum number of bars between signals. By default the gap is set to 3, but you can adjust this between 1 and 10 to control signal frequency.
- Alerts: The script defines alert conditions for long and short signals, allowing you to create TradingView alerts that notify you when a new signal occurs.
- Economic data: The script uses TradingView's built-in `request.economic()` function to request U.S. GDP data. The GDP series is plotted in the Data Window for additional macroeconomic context.
How to use:
1. Add the indicator to a chart.
2. Open the indicator's settings and adjust the "Signal Gap (bars)" input to set the minimum bar gap between signals.
3. Look for green triangles plotted below the bars (bullish signals) and red triangles plotted above the bars (bearish signals). These appear only when the gap criterion is met.
4. If you want alerts, click the Alert button in TradingView, select this indicator, and choose either the Long or Short alert conditions.
5. To view the GDP data, open the Data Window; the GDP value will be shown alongside other series for each bar.
6. Use these signals in combination with your own analysis; this indicator is for educational purposes and does not constitute financial advice.

【MasterHSC】CCI Mean Derivative Smart Strategy🧾 Strategy Description (English)
CCI Mean Slope Smart Strategy
This strategy is built on the derivative slope behavior of the Commodity Channel Index (CCI) mean line.
It identifies key turning points or trend continuations based on how the smoothed CCI (mean value) changes direction after reaching overbought or oversold zones.
Core Idea:
When the CCI mean reverses slope after exceeding ±100, it signals a potential mean reversion (range-trading opportunity).
When the CCI mean remains above +100 or below −100 with a consistent slope, it indicates a strong trending phase (momentum continuation).
The strategy dynamically adapts between these two behaviors depending on market conditions.
Modes:
🌀 Range Reversal Mode — Focuses on slope reversals after overbought/oversold conditions.
🚀 Trend Following Mode — Captures strong momentum when the CCI mean stays extended.
🧠 Auto Mode — Automatically switches between Range and Trend logic based on CCI mean volatility.
Key Features:
Dual-direction toggle: Enable or disable long/short entries independently.
Adjustable tolerance: Choose fixed or dynamic thresholds for flexibility.
Automatic mode label and visual buy/sell markers on the chart.
Pure CCI-based system — no external filters or indicators required.
Purpose:
This system is designed to reduce false signals in sideways markets while preventing missed opportunities during strong directional trends, offering a clean balance between precision and adaptability.

RSI potente 2.0rsi mas refinado e indicadores correctos a corto ,mediano y largo plazo .. el mejor indicador
4H TIMEZONE LONGTERM. NINJAXON12S CODEthis strategy is meant for longer time zones. I've been working on this for a while and now i successfully got a 1000% on back testing for 5 years.

Empire OS Trading Fully Automated Prop Firm Ready💎 Prop-Firm-Ready Momentum System v3 — The Gold-Mine Algorithm 💎
Engineered for the same standards that top prop firms demand — minimal drawdown, consistent equity growth, and precision-based execution. This isn’t a basic indicator; it’s a refined momentum engine built for traders who scale capital and manage risk like professionals.
Performance Snapshot
• Profit Factor 2.26 • Win Rate 33 % • Max Drawdown 0.9 % • Total P/L + $447 • W/L Ratio 4.6 : 1
Stress-tested on Gold (XAUUSD) across live-market conditions, it stays composed under volatility and delivers structured, data-driven consistency.
⚡ See it. Test it. Scale it.
Built for prop-firm precision — from $10 K to $300 K and beyond.

Nifty Intraday 9:30- 3 Min Candle By Trade Prime Algo.Nifty Intraday 9:30 – 3 Min Candle Strategy by Trade Prime Algo
This strategy is designed to help traders identify intraday long entries, stop-loss, and multi-target levels on the Nifty Spot / Nifty Futures based on the first 3-minute candle breakout after 9:30 AM.
It automates trade detection, entry marking, target plotting, and trailing stop-loss logic, allowing traders to visualize complete trade flow with clarity and precision.
The system offers:
✅ Auto identification of long entries based on candle breakout logic
✅ Configurable stop-loss, trailing SL, and four partial profit targets
✅ Dynamic plotting of entry, TSL, and targets on chart
✅ Custom alert messages for each event (Entry, TP1–TP4, SL, Close)
✅ Adjustable time session and test periods for backtesting
⚙️ How to Use
1️⃣ Set your desired start time (default: 9:15–9:30 AM).
2️⃣ Choose your stop-loss type — percentage or points.
3️⃣ Adjust target levels (TP1–TP4) and trailing SL settings as per your risk appetite.
4️⃣ Use this strategy for educational backtesting and research only — not for live trading signals.
5️⃣ The tool can be combined with price action zones or higher-timeframe analysis for best results.
⚠️ Disclaimer (SEBI & Risk Disclosure)
This strategy is developed strictly for educational and research purposes.
The creator of this script and Trade Prime Algo are not SEBI-registered advisors.
This tool does not guarantee any specific profit or performance.
Trading involves risk; users may incur partial or total capital loss.
All decisions taken using this indicator or strategy are solely at the user’s discretion and risk.
The creator assumes no liability for profit, loss, or any consequences arising from the use of this script.
Always perform your own due diligence and trade responsibly.

AIBTC Automated Trading Strategy🧠 AIBTC Automated Trading Strategy
Overview:
The AIBTC Automated Trading Strategy is a fully autonomous system designed for 4-hour timeframes (4H). It dynamically identifies support and resistance levels based on price action, and automatically executes trades when valid breakouts occur above resistance or below support. The system adapts in real time to changing market volatility, ensuring stable performance across different market conditions.
⚙️ Strategy Logic
Dynamic Support & Resistance Detection
The strategy uses an adaptive Pivot Point algorithm that adjusts parameters according to market volatility (ATR) and price deviation (Standard Deviation).
When volatility increases, the algorithm automatically widens its detection range and recalibrates channel width for better accuracy.
All support and resistance levels are detected dynamically — no manual configuration is required.
Trend & Volatility Filtering
The system applies ADX (Average Directional Index) to measure trend strength.
When ADX > 25, only strong levels are considered valid to avoid noise during weak trends.
ATR-based volatility adjustments automatically optimize lookback periods and detection sensitivity.
Breakout Signal Detection
A long position is triggered when price breaks above resistance with a valid breakout margin (default filter: 0.1%).
A short position is triggered when price breaks below support with the same breakout filter applied.
This breakout filter effectively minimizes false breakouts and improves signal quality.
Fully Automated Execution
The system is designed for both backtesting and live simulation.
All buy/sell entries are executed automatically without manual input once conditions are met.
🕒 Recommended Timeframe
4-hour (4H) candles
Suitable for short-to-medium term swing trading, balancing signal precision and trade frequency.
📊 Key Features
✅ Fully Automated — Executes long/short positions on valid breakouts
✅ Adaptive Parameters — Automatically adjusts to changing volatility
✅ Trend-Aware Filtering — Uses ADX to avoid false signals in ranging markets
✅ Multi-Asset Compatibility — Works on BTC, ETH, or any high-liquidity instrument
⚠️ Disclaimer
This strategy is a technical and algorithmic tool, not financial advice.
Always backtest and simulate before using it on live markets.
During periods of extreme volatility, signals may delay or show false breakouts — consider using stop-loss mechanisms accordingly.

FVG Donchian Channel strategy30min FVG + Donchian Channel strategy
buy sell by 30min fvg
and stoploss , take profit by Donchian Channel
Run the strategy on the 1min timeframe!

EMA 9/50 News Confirmation Strategy v3 (Trend Aligned 3 bMin) “EMA 9/50 crossover strategy with trend filter and ATR-based targets”)

Wh testThis issue stems from a very specific issue in TradingView: When you make the chart "view-only" (i.e., viewable via a share link), the chart data can stream live, but the indicators' runtime engine is disabled.
I'll explain in detail below why this happens and how to fix it.

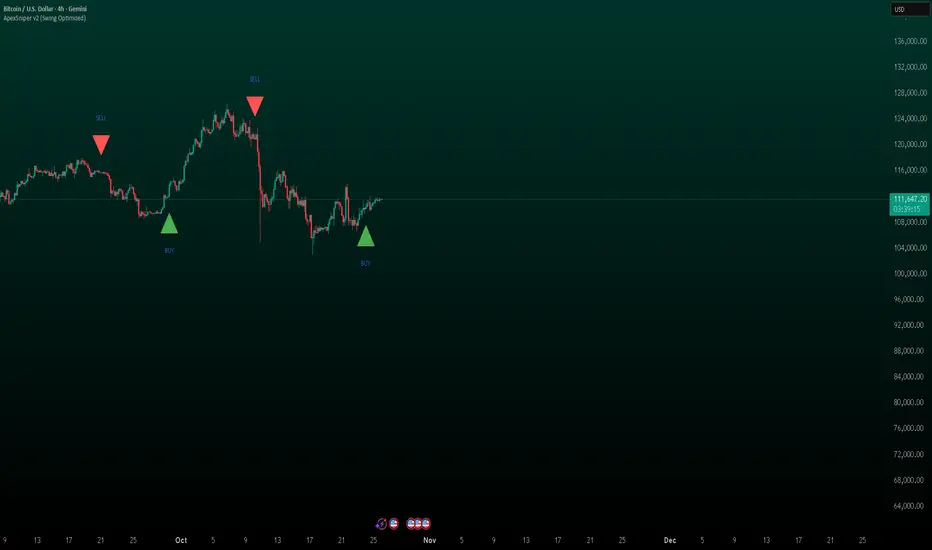
ApexSniper v2 (Swing Optimized)More long term than the original Apex sniper, BETTER FOR SMALLER ACCOUNT SIZES. Scales more long term. trades take 4-8 days, but percent gained is way more.
ApexSniper2.0I have Tested this Indicator Manually for about 2 months now and its been amazing.Ive been working with pine code for a really long time now, took me about 6 months to build this script, hopefully it works well for you.very good for trading. will help you out a lot

ApexSniperI have Tested this Indicator Manually for about 2 months now and its been amazing.Ive been working with pine code for a really long time now, took me about 6 months to build this script, hopefully it works well for you.very good for trading. will help you out a lot

ApexSignalsIve been working with pine code for a really long time now, took me about 6 months to build this script, hopefully it works well for you.very good for trading. will help you out a lot

Cybertrading-Insidebar hunter pro robotThe Cybertrading-Inside Pro strategy is an advanced version of Cyber-Inside.
It automates ATR-based inside-bar trading with optional pullback entries, full risk/reward visualization, time filtering, pending-order handling, and fixed chart watermark branding (“CollegePips / CyberTrading”).
⚙️ Technical Overview
1. Core Structure
Uses ATR(14) to measure volatility and classify candle ranges.
Candles are labeled as Spinning, Standard, Long, or Huge based on their range vs. ATR.
Only valid candles (Standard or Long) qualify to confirm a setup.
2. Inside-Bar Logic
The setup requires the current candle’s high/low to be fully contained inside the previous candle (an inside bar).
A wick-break must occur — the wick slightly breaks the previous inside bar’s range while the body remains inside.
This pattern forms a Pierce-Only signal.
Direction:
Wick down → potential Long entry
Wick up → potential Short entry
3. Timing and Entry Conditions
With the time filter enabled, trades trigger only between defined hours (e.g., 07–22).
If Enable Pullback is on, the entry is placed using a limit order offset by pullbackATR × ATR from the signal candle.
If the pullback entry isn’t triggered within pullbackMaxBars, the pending order is canceled automatically.
You can also enable display-only entries without execution (Enable Entry Without Pullback).
4. Risk & Target Management
Stop loss is placed beyond the second-previous candle’s high/low ± stopBuffer × ATR.
Take-profit is based on the chosen risk/reward multiple (RR) or the previous candle’s high/low.
Position size auto-adjusts to keep total risk equal to riskPercent of equity.
5. Visual Components
Dynamic chart objects include:
Red box: risk zone (entry → stop)
Green/blue box: reward zone (entry → target)
Dotted diagonal line: risk-to-reward path
Arrows: actual fill points
6. Order Management System
Each signal creates a unique order ID (pendingId) and exit ID (planExitId).
On a valid fill (newLong / newShort), real stop, target, and position size are applied.
If an order isn’t filled within the timeout window, it’s canceled and reset automatically.
7. Advantages
✅ Smart inside-bar pattern recognition
✅ Automated risk control and dynamic sizing
✅ Clear visual feedback for analysis
✅ Fully backtest-ready for research or education