Candlestick-Analysen

Engulfing Candles DetectorHello traders
Credit to HPotter for that script
I took his script and added alerts to it. 2 lines lol
But anyway, useful to detect reversals by coloring bullish/bearish engulfing candles :)
Enjoy
David

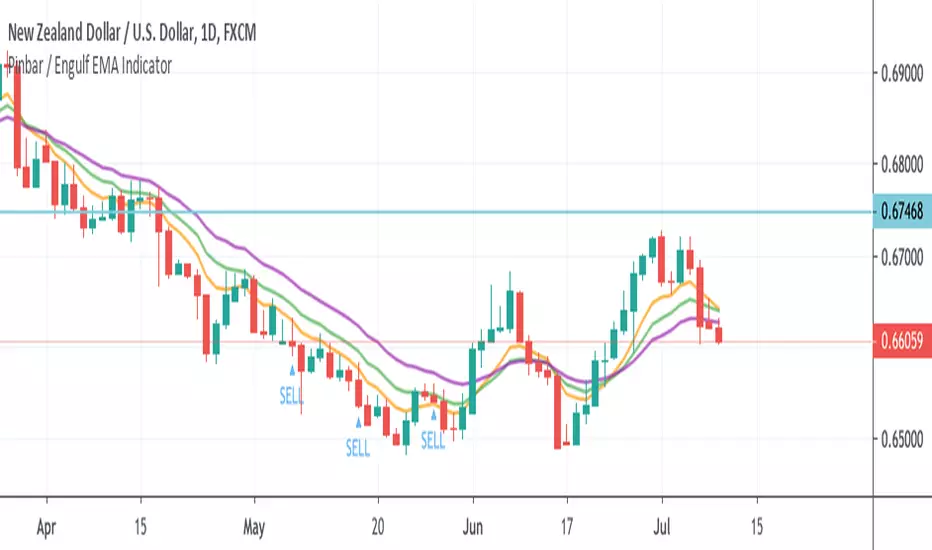
Pinbar / Engulf EMA IndicatorThis indicator is built based on the video by ForexSignals TV (no association on my part with them), published on July 5th, 2019 titled "SIMPLE & PROFITABLE Trend-following Forex Trading Strategy!"
The basic premiss is to use the 8,13,21 EMAs, make sure they have not crossed in the previous 3 bars, then look for engulfing bars or pinbars for the current direction. Meaning if the trend is up, look for bullish engulfer or pinbars, and bearish ones if the trend is down. Also, the pin must have crossed the 8EMA but not the 21EMA.
When determining to act on the signal, the video recommends only executing a buy/sell if the the current trend in the anchor chart is trending in the same direction (trending up only enter buys, trending down, only enter sells).
The script overlays a BUY or SELL tag under the bar that meets the above criteria.
Higher High Lower Low Strategy (With Source Code)This script finds pivot highs and pivot lows then calculates higher highs & lower lows. And also it calculates support/resistance by using HH-HL-LL-LH points.
Generally HH and HL shows up-trend, LL and LH shows down-trend.
If price breaks resistance levels it means the trend is up or if price breaks support level it means the trend is down, so the script changes bar color blue or black. if there is up-trend then bar color is blue, or if down-trend then bar color is black. also as you can see support and resistance levels change dynamically.
If you use smaller numbers for left/right bars then it will be more sensitive.
source code of :

Multi Bar OHLC Compare Panel (Floating Grid)Multi Bar OHLC Compare Panel by RagingRocketBull 2019
version 1.0
This indicator lets you compare OHLCV values from several specified bars. Bars can be dynamic/persistent.
You can also use it as an alternate OHLC panel if you don't like small font of the native TradingView panel.
It uses Pinescript v4 to output data dynamically as string labels in a horiz/vertical grid.
Features:
- Floating Panel with customizable horiz/vertical layout and grid spacing
- Support for up to 5 OHLC bars (highlighted with markers)
- Outputs Bar #/index, OHLCV, Bar Change Value/%, Exchange/Ticker, Timeframe, Timestamp strings
- Dynamic (fixed offset)/Persistent bars (fixed time)
- Show/Hide parts of strings
- Full output string customization, including text size, date/time format and delimiters
- 2 Anchor points for panel offset: cur bar high or range high
- Bar Change can change color
Usage:
- specify at least 1 bar index as OHLC source
- select anchor point to position the panel
- select horiz/vertical grid layout
- adjust horiz/vertical spacing
- customize output strings as needed
Notes:
- this indicator uses Pinescript v3 Compatibity Framework
- both bars 1,2 are required for log scale adjustment to work
- you can't attach the panel to screen's top/bottom and must use offset/anchor because, unlike plotshape, string labels don't support yloc=yloc.top/bottom, only yloc.above/belowbar
- you can't precisely align strings in a grid because there's no label.get_width/height to calculate mid/left points, only get_x/y/text. Alignment will break depending on string length, zoom and change color option on/off
- bar change is rendered as a separate label when change color is enabled (2 panels total) and merged into the main panel when disabled (single panel)
- you can't change the order of strings as playing with the natural order of things isn't the best of ideas
- you can modify the script to compare up to 50 OHLC bars, but do you need that much power? Of course, you do.
- you can't set color/style for string labels in Style UI, so a few extra settings were added.
- bar index is limited to 5000 for free accounts (10000 for paid), will show an error when exceeded, also when it exceeds the total number of bars in history
- in persistent bars mode all bars with index > 0 are considered persistent, bar 0 always remains a dynamic bar
- persistent bars' offset is reset: in replay mode on exit or when price reaches cur bar, or when panel layout is changed from h to v in both replay/realtime modes
- initial pos of each persistent bar relative to the first realtime bar anchor doesn't change during session - new persistent bars introduced during session are attached to the most recent cur bar anchor
P.S. Everything is proceeding as I have foreseen

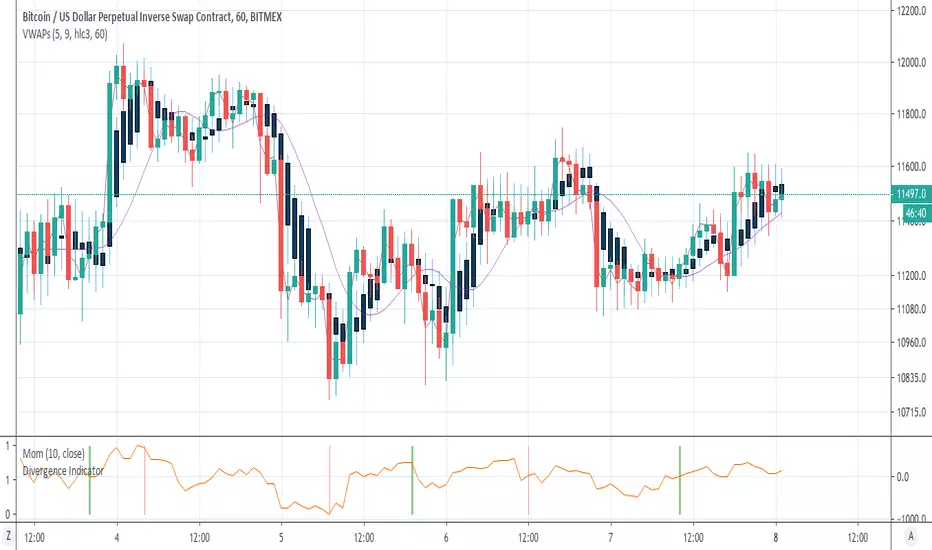
VWAP Candles & MVWAPI was getting sick of the useless VWAP indicator on Trading View and wrote something that is more comprehensive and quite interesting, in fact: candles for VWAP.
It uses the original open/high/low/close and combines them as you would the original hlc3 calculation, but separately, to draw the candles as a shadow of the current price.
There are a few parameters to make it more flexible: source, resolution timeframe, volume length, and moving average length.
Volume Length (default: 5) will determine the candle calculations, cumulative sum of the past X bars.
Moving Average Length (default: 9) will determine the simple moving average (sma) length for the true VWAP (hlc3*volume/cumulative volume)
Source will change the Moving Average VWAP from hlc3 to whatever you want.
Resolution will attune the candles and Moving Average VWAP line to a different periodicity.
Just to be a pain, I also included the old VWAP from Trading View, as a comparison. You can disable it from the Style settings.
Enjoy and happy trading!
Noro's Crypto PatternsFor
- symbols: crypto/usd or crypto/usdt (or any stablecoins)
- timeframe: 1 hour
Signals - quantity of signals (arrows)
Accuracy - as many such transactions were profitable

Noro's Crypto Pattern for H1This indicator shows to the user a pattern. This pattern is drawn on graphics.
For:
- Any crypto
- H1


bitFlyer DeviationbitFlyer price deviation percent between FXBTCJPY and BTCJPY.
bitFlyerのBTCFXとBTC現物の価格乖離(%)を表示します。

weekend rally bloody mondayTracks the gain-loss of the price on Mondays and the range gain-loss from Monday (configurable) to Sunday. Then, it identifies Sunday's pumps that end with a Monday dump.

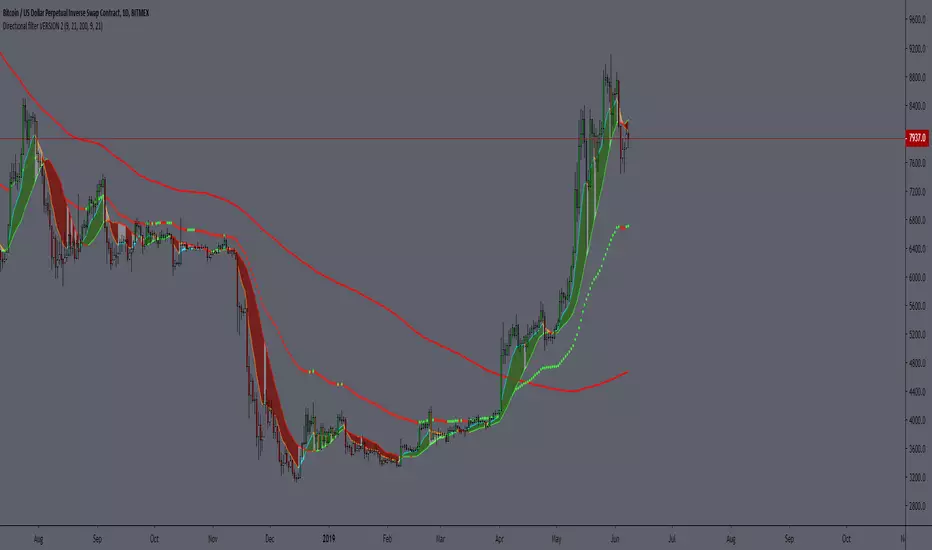
Directional filter VERSION 2The idea is to make it more visible if the moment is to seek buying or selling, based on moving averages, being SMA 21 and EMA 9.
best BUYBAR has the EMA9 and SMA21 rising and closing above them. "relevance A"
best SELLBAR has the EMA9 and SMA21 dropping and closing below them. "relevance A"
Conditions for all colors of the candlesticks:
BuyBar A = price closes above EMA9 and SMA21 with EMA9 and SMA21 rising.
BuyBar B = price closes above SMA21 with SMA21 rising OR price closes above EMA9 and SMA21.
BuyBar C = price closes above EMA9 with EMA9 rising and SMA21 falling.
BuyBar Neutral = close> open.
SellBar A = price closes below EMA9 and SMA21 with EMA9 and SMA21 falling.
SellBar B = price closes below SMA21 with SMA21 falling OR price closes below EMA9 and SMA21.
SellBar C = price closes below EMA9 with EMA9 falling and SMA21 rising.
SellBar Neutral = close abertura.
SellBar A = preço fecha abaixo de EMA9 e SMA21 com EMA9 e SMA21 caindo.
SellBar B = preço fecha abaixo de SMA21 com SMA21 caindo OU preço fecha abaixo de EMA9 e SMA21.
SellBar C = preço fecha abaixo de EMA9 com EMA9 caindo e SMA21 subindo.
SellBar Neutral = fechamento < abertura.
As medias moveis também alteram de acordo com a direção em que estão:
EMA 9 subindo = azul
EMA 9 caindo = laranja
SMA 21 subindo = verde
SMA21 caindo = vermelho

Inside BarsMark Inside Bars with a triangle above the calendar. This indicator supports having different colors and alerts for 1, 2 or 3 consecutive inside bars.
