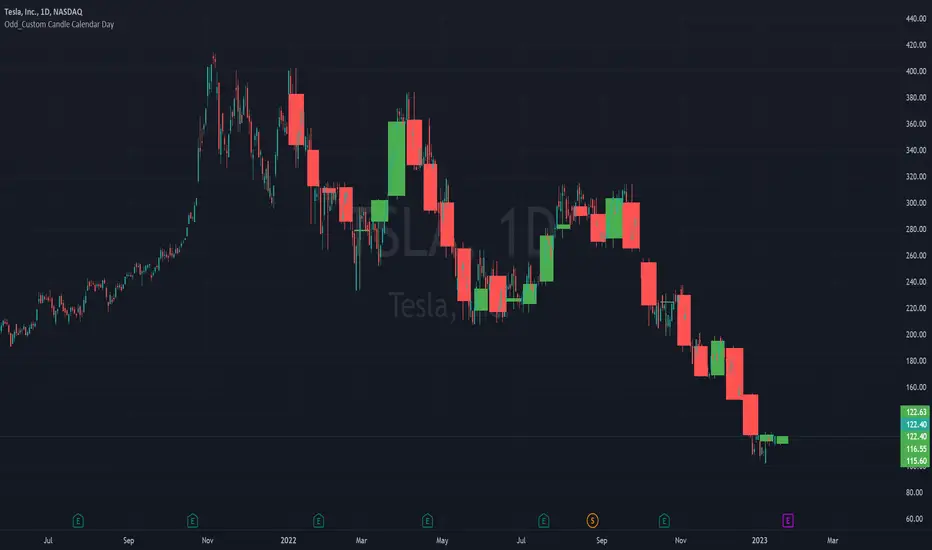
Lower timeframe chartHi all!
I've made this script to help with my laziness (and to help me (and now you) with efficiency). It's purpose is to, without having to change the chart timeframe, being able to view the lower timeframe bars (and trend) within the last chart bar. The defaults are just my settings (It's based on daily bars), so feel free to change them and maybe share yours! It's also based on stocks, which have limited trading hours, but if you want to view this for forex trading I suggest changing the 'lower time frame' to a higher value since it has more trading hours.
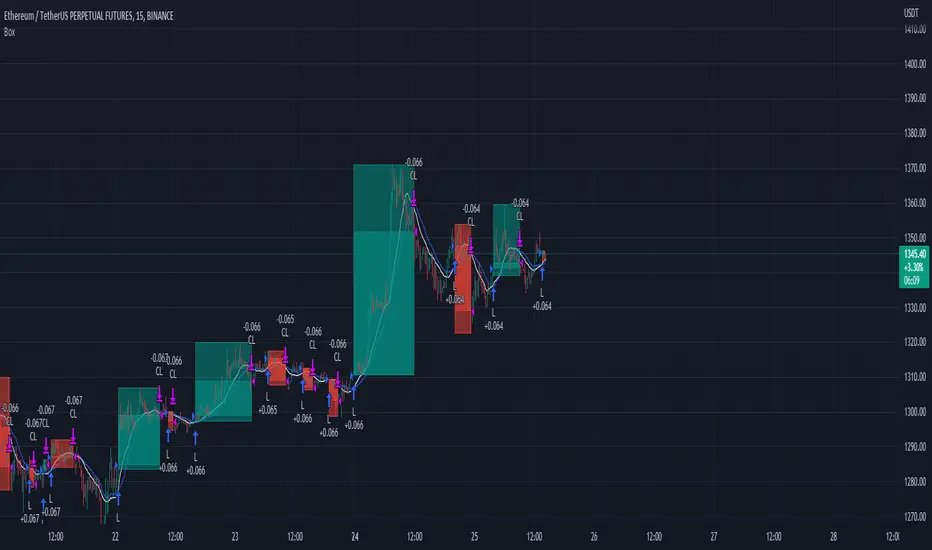
The script prints a label chart (ASCII) based on your chosen timeframe and the trend, based on @KivancOzbilgic script SuperTrend The printed ASCII chart has rows (slots) that are based on ATR (14 bars) and empty gaps are removed. The current trend is decided by a percentage of bars (user defined but defaults to 80%, which is really big but let's you be very conservative in defining a trend to be bullish. Set to 50% to have the trend being decided equally or lower to be more conservative in defining a trend to be bearish) that must have a bullish SuperTrend, it's considered to be bearish otherwise. Big price range (based on the ATR for 14 bars) and big volume (true if the volume is bigger than a user defined simple moving average (defaults to 20 bars)) can be disabled for faster execution.
The chart displayed will consist of bars and thicker bars that has a higher volume than the defined simple moving average. The bars that has a 'big range' (user defined value of ATR (14 days) factor that defaults to 0.5) will also have a wick. The characters used are the following:
Green bar = ┼
Green bar with large volume = ╪
Green bar wick = │
Red bar = ╋
Red bar with large volume = ╬
Red bar wick = ┃
Bar with no range = ─
Bar with no range and high volume = ═
Best of trading!
Pine Script® Indikator