CAGR Indicator (Flexible Holding Period)CAGR Indicator (Flexible Holding Period)
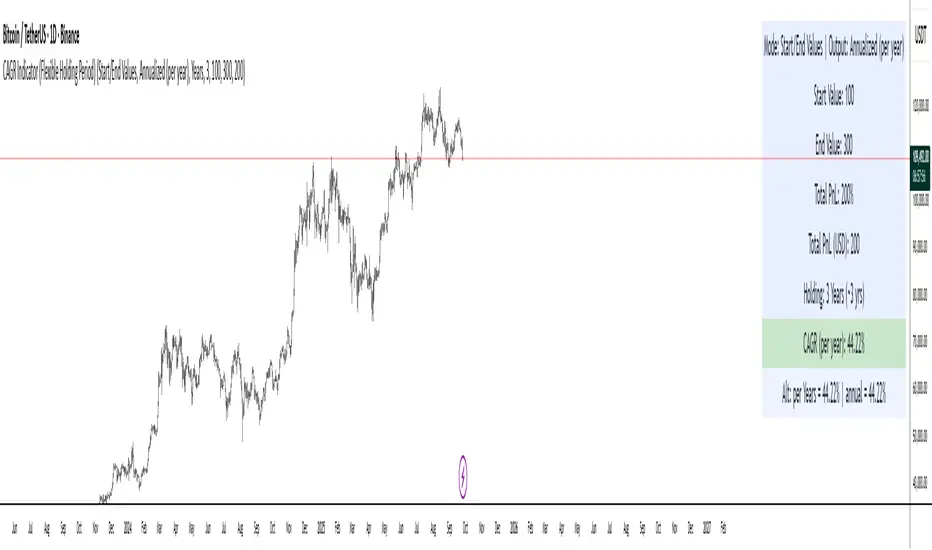
The CAGR Indicator (Flexible Holding Period) is designed to convert any cumulative investment outcome into a standardized, annualized growth rate that can be compared across assets, strategies, and time horizons. Its core metric is the compound annual growth rate, which represents the constant yearly rate that, if compounded smoothly, transforms an initial value into a final value over a specified horizon. By annualizing returns, the indicator removes distortions caused by unequal test lengths and allows direct comparison with benchmarks such as index returns or risk-free rates.
Conceptually, the indicator proceeds in two stages: measuring growth and normalizing time. Growth is summarized by the growth multiple, which is the ratio of ending value to starting value when concrete values are provided, or equivalently 1 plus total percentage return divided by 100 when only a cumulative percent is known. Time is normalized by converting the user’s holding period into a year-equivalent, so that a 45-day, 30-week, 18-month, or multi-year interval can all be mapped onto a common annual scale. The conversions use widely accepted approximations: days divided by 365.25, weeks divided by approximately 52.1429, and months divided by 12, while years are used as entered.
Once growth and time are expressed in compatible units, the indicator applies the standard compounding identity: CAGR = (Growth Multiple)^(1/T) − 1, where T is the year-equivalent holding period. This transformation inverts the compounding process and yields the geometric mean rate of return per year. Because the geometric mean is path-independent, the CAGR summarizes start-to-finish performance without reference to the sequence of gains and losses. The output therefore reflects the constant annual rate that would have produced the observed terminal value from the initial value if returns had been smooth.
The indicator admits two data entry modes to accommodate common reporting practices. In Start/End Values mode, the user supplies initial and final portfolio values; the indicator computes the growth multiple as end divided by start and also displays absolute profit or loss in currency terms to aid practical interpretation. In Total PnL (%) mode, the user supplies a cumulative return percentage; the indicator converts this to a growth multiple and estimates a corresponding ending value for display, while the CAGR computation itself relies only on the multiple and the time horizon.
Validity checks ensure that reported numbers are meaningful. The growth multiple must be strictly positive; cumulative losses at or below minus one hundred percent make the multiple nonpositive and render the CAGR undefined. The holding period must be positive and convertible to a year-equivalent. In Start/End mode, the starting value must exceed zero to avoid division by zero and degenerate ratios. When these conditions are not met, the indicator withholds a numeric result and signals that the quantity is not well defined.
Interpreting the output requires recognizing both its strengths and its limits. The CAGR is a concise, comparable measure of long-run performance that abstracts from timing and volatility. It is particularly useful for benchmarking strategies of different durations, setting policy targets for funds, communicating results to stakeholders, and aligning outcomes with hurdle rates. However, because it is path-independent, the CAGR does not reflect interim drawdowns, variance, or tail risk. It also presumes a lump-sum investment with no intermediate cash flows; when deposits or withdrawals occur, internal rate of return methods such as IRR or XIRR are more appropriate.
Typical applications include comparing backtests with unequal sample lengths, reporting consolidated results from discrete projects on a common annual basis, and translating short-horizon event outcomes (for example, a multi-week campaign) into an annualized figure for decision-making. The indicator’s auxiliary displays, such as total profit or loss in currency and the explicit statement of the original holding period alongside its year-equivalent, improve transparency and auditability of the transformation.
Users should remain mindful of several caveats. Time conversions rely on conventional averages and may differ from calendar-exact counts by small amounts, which is usually immaterial but worth noting for edge cases. Selection bias can inflate reported CAGRs if intervals are cherry-picked; robust practice involves rolling windows, out-of-sample tests, and sensitivity analysis. Most importantly, the CAGR should be paired with risk and stability measures—such as maximum drawdown, Sharpe or Sortino ratios, downside deviation, or ulcer index—to form a complete assessment of a strategy’s quality.
In sum, the indicator operationalizes a simple but powerful idea: separate the measurement of growth from the normalization of time, then apply the compounding identity to express outcomes as a consistent per-year rate. By combining flexible period inputs with a rigorous geometric transformation, it enables fair, intelligible comparisons while encouraging the complementary use of risk diagnostics to avoid over-reliance on a single summary statistic.
CAGR
Greer Fair Value✅ Greer Fair Value
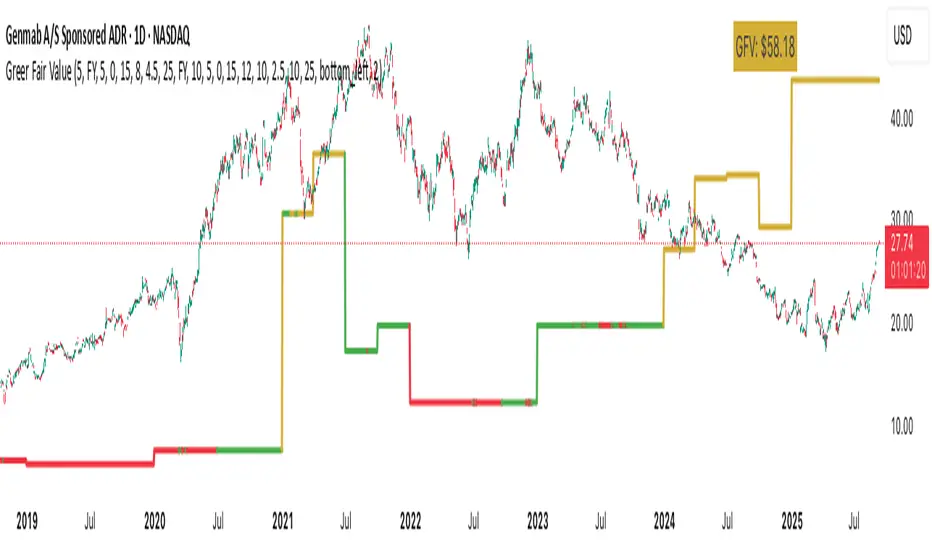
Greer Fair Value: Graham intrinsic value + Buffett-style DCF with auto EPS/FCF and auto growth (CAGR of FCF/share), defaulting to a simple GFV badge that color-codes opportunity at a glance.
📜 Full description
Greer Fair Value is inspired by the valuation frameworks of Benjamin Graham and Warren Buffett. It combines Graham’s rate-adjusted intrinsic value with a two-stage, per-share DCF. The script auto-populates EPS (TTM) and Free Cash Flow per share (FY/FQ/TTM) from request.financial(), and can auto-estimate the near-term growth rate (g₁) using the CAGR of FCF/share over a user-selected lookback (with sensible caps). All assumptions remain editable.
Default view: only the GFV badge is shown to keep charts clean.
Badge color logic:
Gold — both DCF and Graham fair values are above the current price
Green — exactly one of them is above the current price
Red — the current price is above both values
Show more detail (optional):
Toggle “Show Graham Lines” and/or “Show DCF Lines” to plot fair values (and optional MoS bands) over time.
Toggle “Show Dashboard” for a compact data table of assumptions and outputs.
Optional summary label can be enabled for a quick on-chart readout.
Inputs you can customize: EPS source/manual fallback, FCF/share source (FY/FQ/TTM), g₁ auto-CAGR lookback & caps, terminal growth gT, discount rate r, MoS levels, step-style plots, table position, and decimals.
Note: TradingView’s UI controls whether “Inputs/Values in Status Line” are shown. If you prefer a clean status line, open the indicator’s settings and uncheck those options, then Save as default.
Disclaimer: For educational/informational purposes only; not financial advice. Markets involve risk—do your own research.
Future Value ProjectionFuture Value Projection with Actual CAGR
This indicator calculates the future value (FV) of the current ticker’s price using its historical Compound Annual Growth Rate (CAGR). It measures how much the price has grown over a chosen lookback period, derives the average annual growth rate, and then projects the current price forward into the future.
Formulae:
CAGR:
CAGR = ( PV_now / PV_past )^(1 / t) - 1
Future Value:
FV = PV_now × ( 1 + CAGR / n )^( n × T )
Where:
PV_now = Current price
PV_past = Price t years ago
t = Lookback period (years)
CAGR = Compound Annual Growth Rate
n = Compounding periods per year (1=annual, 12=monthly, 252=daily, etc.)
T = Projection horizon (years forward)
How it works:
Select a lookback period (e.g., 3 years).
The script finds the price from that time and computes the CAGR.
It then projects the current price forward by T years using the CAGR.
The chart shows:
Current price (blue)
Projected FV target (green)
A table with CAGR and projection details
Use case:
Helps investors and traders visualize long-term growth projections if the ticker continues growing at its historical pace.

Overnight vs Intra-day Performance█ STRATEGY OVERVIEW
The "Overnight vs Intra-day Performance" indicator quantifies price behaviour differences between trading hours and overnight periods. It calculates cumulative returns, compound growth rates, and visualizes performance components across user-defined time windows. Designed for analytical use, it helps identify whether returns are primarily generated during market hours or overnight sessions.
█ USAGE
Use this indicator on Stocks and ETFs to visualise and compare intra-day vs overnight performance
█ KEY FEATURES
Return Segmentation : Separates total returns into overnight (close-to-open) and intraday (open-to-close) components
Growth Tracking : Shows simple cumulative returns and compound annual growth rates (CAGR)
█ VISUALIZATION SYSTEM
1. Time-Series
Overnight Returns (Red)
Intraday Returns (Blue)
Total Returns (White)
2. Summary Table
Displays CAGR
3. Price Chart Labels
Floating annotations showing absolute returns and CAGR
Color-coded to match plot series
█ PURPOSE
Quantify market behaviour disparities between active trading sessions and overnight positioning
Provide institutional-grade attribution analysis for returns generation
Enable tactical adjustment of trading schedules based on historical performance patterns
Serve as foundational research for session-specific trading strategies
█ IDEAL USERS
1. Portfolio Managers
Analyse overnight risk exposure across holdings
Optimize execution timing based on return distributions
2. Quantitative Researchers
Study market microstructure through time-segmented returns
Develop alpha models leveraging session-specific anomalies
3. Market Microstructure Analysts
Identify liquidity patterns in overnight vs daytime sessions
Research ETF premium/discount mechanics
4. Day Traders
Align trading hours with highest probability return windows
Avoid overnight gaps through informed position sizing

[EAK]Median Growth% Hist. Vs Estimate=Indicator " Growth rate (Hist.VS Est.)" ซึ่งใช้แสดงอัตราการเติบโตของของบริษัท โดยเปรียบเทียบระหว่างข้อมูลในอดีต (Historical) กับการประมาณการ (Estimate) การตั้งค่าต่างๆ มีดังนี้
Inputs (ข้อมูลนำเข้า) : ส่วนนี้ใช้กำหนดรายละเอียดของข้อมูลที่นำมาคำนวณ
-Period (ช่วงเวลา): เลือกช่วงเวลาที่ต้องการวิเคราะห์ เช่น TTM (Trailing Twelve Months) คือ 12 เดือนล่าสุด หรือ FY ที่ใช้ข้อมูลของปีล่าสุด
-Show EPS Growth% (แสดง % การเติบโตทบต้นของ EPS): เลือกให้แสดงเปอร์เซ็นต์การเติบโตเฉลี่ยทบต้นของ EPS
-Show Median Growth% (แสดง % การเติบโตมัธยฐาน): เลือกให้แสดงมัธยฐานของการเติบโตเฉลี่ยทบต้น
-Show EPS Estimate by TradingView (แสดงการประมาณการ EPS โดย TradingView): แสดงข้อมูลการประมาณการ EPS จาก TradingView(เป็นการเรียกข้อมูลล่าสุดที่มีในเทรดดิ้งวิว ดังนั้นโปรดตรวจสอบ ว่าเป็นข้อมูลของปีไหน)
-Position (ตำแหน่ง): กำหนดตำแหน่งการแสดงผลของ Indicator บนหน้าจอ เช่น middle_rigth... (กลาง_ขวา)
-Text Size (ขนาดตัวอักษร): กำหนดขนาดตัวอักษรของข้อมูลที่แสดง เช่น normal (ปกติ)
โดยสรุป Indicator นี้ช่วยให้เห็นภาพรวมของการเติบโตของกำไรบริษัท โดยเปรียบเทียบอดีตกับการคาดการณ์ ทำให้วิเคราะห์แนวโน้มและตัดสินใจลงทุนได้ง่ายขึ้น และการตั้งค่าต่างๆ ช่วยให้ปรับแต่งการแสดงผลให้เหมาะสมกับการใช้งานของผู้ใช้
หมายเหตุ
EPSm=EPS CAGR(Median)
REVm=Revenue CAGR(Median)
OPm=Operating income CAGR(Median)
DIVm=Dividend CAGR(Median)
EQm=Total Equity CAGR(Median)
ASm=Total Asset CAGR(Median)
***Indicatorนี้ ออกแบบมาใช้กับ กราฟDay1 เท่านั้น โดยใช้การเรียกข้อมูลด้วยการนับBarย้อนหลัง อาจมีการผิดพลาดได้บ้าง ดังนั้นหากต้องการความแม่นยำที่สูงโปรดตรวจสอบข้อมูลกับแหล่งข้อมูลที่น่าเชื่อถืออีกครั้ง***
/////////////////////////////////////////////////////////////////////////////////////////
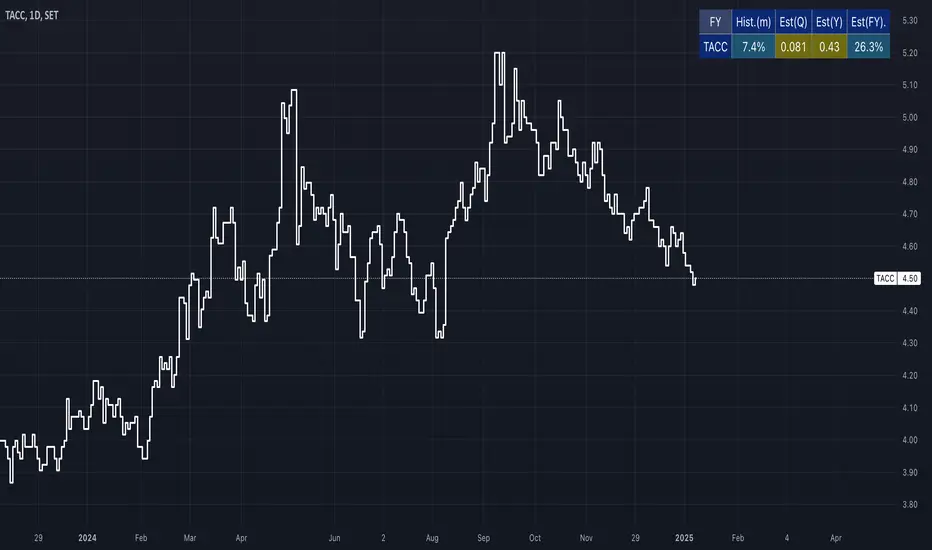
Indicator " Growth rate (Hist.VS Est.)" is designed to display a company's growth rate by comparing historical data with estimates. The configuration options are as follows:
Inputs:
Period: Select the analysis period, such as TTM (Trailing Twelve Months), representing the last 12 months, or FY, which uses last full year data.
Show EPS Growth%: Enables the display of the compound annual growth rate (CAGR) of EPS.
Show Median Growth%: Enables the display of the median of the compound annual growth rate.
Show EPS Estimate by TradingView: Displays EPS estimate data from TradingView. (This retrieves the latest data available in TradingView; therefore, please verify the corresponding fiscal year.)
Position: Sets the indicator's display position on the chart, such as middle_right.
Text Size: Sets the text size of the displayed information, such as normal.
In summary, this indicator provides an overview of a company's earnings growth by comparing historical performance with forecasts, facilitating trend analysis and investment decisions. The various settings allow users to customize the display for their specific needs.
Note:
EPSm = EPS CAGR (Median)
REVm = Revenue CAGR (Median)
OPm = Operating income CAGR (Median)
DIVm = Dividend CAGR (Median)
EQm = Total Equity CAGR (Median)
ASm = Total Asset CAGR (Median)
***This indicator is designed for use on daily (D1) charts only. As it retrieves data by counting back bars, some inaccuracies may occur. For accuracy, please cross-reference the information with reliable sources.
CAGR ProjectionThe CAGR Projection Indicator is a tool designed to visualize the potential growth of an asset over time based on a specified annual growth rate. This indicator overlays a projection line on the price chart, allowing traders and investors to compare actual price movements with a hypothetical growth trajectory.
One of the key features of this indicator is the ability for users to input their expected annual growth rate as a percentage. This flexibility allows for various scenarios to be modeled, from conservative estimates to more optimistic projections. Additionally, the indicator allows users to set a specific start date for the projection, enabling analysis from any chosen point in time.
The projection calculation is dynamic, adjusting for different timeframes and updating with each new bar on the chart. The indicator initializes either at the specified start date or when the first valid price is encountered. Using the initial price as a base, the indicator calculates the projected price for each subsequent bar using the compound growth formula. The calculation accounts for the specific timeframe of the chart, ensuring accurate projections regardless of whether the chart displays daily, weekly, or other intervals.
The projected growth is plotted as a blue line on the chart, providing a clear visual comparison between the actual price movement and the hypothetical growth trajectory. This visual representation makes it easy for users to quickly assess how an asset is performing relative to the expected growth rate.
This tool has several practical applications. Investors can use it to set realistic growth targets for their investments. By comparing actual price movements to the projection line, users can quickly assess if an asset is outperforming or underperforming relative to the expected growth rate. Furthermore, multiple instances of the indicator can be used with different growth rates to visualize various potential outcomes, facilitating scenario analysis.
The indicator also offers customization options, such as displaying a label showing the annual growth rate used for the projection, and the ability to adjust the color of the projection line to suit individual preferences or chart setups.
In summary, this CAGR Projection indicator serves as a valuable tool for both long-term investors and traders, offering a simple yet effective way to visualize potential growth scenarios and assess investment performance over time. It combines ease of use with powerful analytical capabilities, making it a useful addition to any trader's or investor's toolkit.

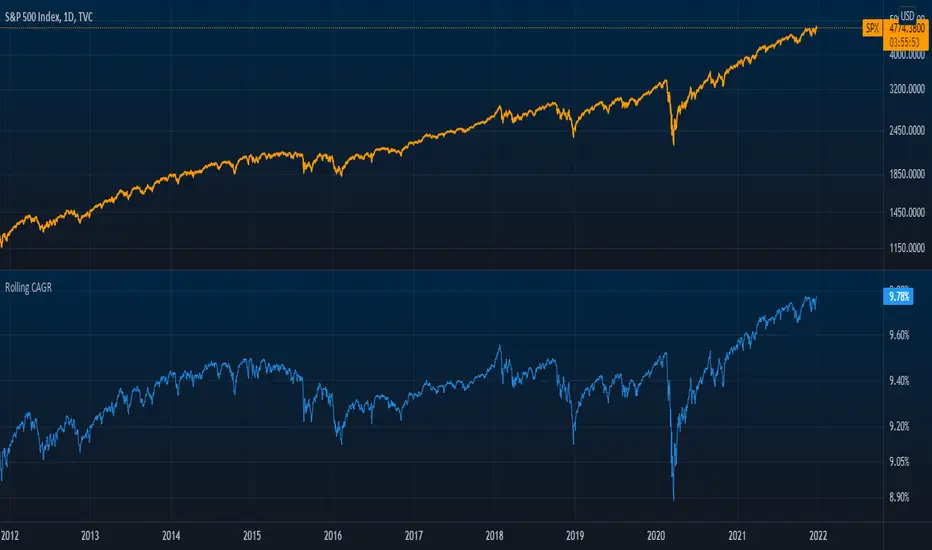
Rolling CAGR (Compound Annual Growth Rate)Simple and powerful Rolling CAGR (Compound Annual Growth Rate) script.
Works with daily, weekly, and monthly data. Do not work with data of hours, minutes, seconds, or customized time intervals.
You can change the rolling period, from the default (3 years) to any other period of years. Just change one value in the script.

Plots CAGR lines for a given set of ratesPlots CAGR lines for a given set of rates from a specified time. It will be helpful to see how the rate of growth of a security's price is changing over a period of time. It also calculates the current CAGR from the time specified. Works on D, W, M timeframes.

Rolling CAGRCompound Annual Growth Rate
This indicator is the compound annual growth rate to be used on any ticker.
How to use
Add indicator to your chart
Specify a data source (default is the close for the selected ticker)
Specify how many trading days are in a year (252 for stocks & 365 for crypto)
Restrictions
This is only accurate on the daily timeframe. So to avoid confusion, I disabled the plotting of the CAGR on any timeframe other than daily