Sherry on cryptoIf the price is above the 200 EMA, you are allowed to open only long positions and avoid shorts.
If the price is below the 200 EMA, you are allowed to open only short position and avoid longs. Don't use this indicator alone, use RSI, Stochastic RSI etc. Do not use this indicator like a bot, do TA and FA as well. This is just an indicator, do not always rely on it. It requires experience. This indicator has different winrate in different timeframes. Set its value accordingly.
Buysellsignal
Dynamic Resistance and Support by A3T - DRS System
Concept : The script Calculates supply-demand areas based on price and change in volume w.r.t change in price (momentum). The EMA slope is read to identify the trend and signals are generated based on the relative strength of all 3 component i.e price, change in price-volume ratio and trend. BLUE channel is formed based on Relative strength of price(RSI) and RED channel is formed based on change in price-volume ratio strength.(Calculating for x price movement what is the volume used based on averaging concept)
Trade setup :
-For BUY signal allow candles to form a proper channel. Once the channel is stable let the price to above the channel and retest the channel. The trade entry will be once the high of retraced candles and last BUY signal candle high breaks. SL will be 1m candle close below the channel.
- For SELL signal allow candles to form a proper channel. Once the channel is stable(Straight line) let the price to go below the channel and retest the channel. The trade entry will be once the low of retraced candles and last SELL signal candle low breaks. SL will be 1m candle close above the channel.
- For Breakout trade there should be a high volume candle RED/GREEN (Dark FILL) inside the channel to execute the trade.
Note: If the breakout is with white filled candle then avoid that trade. Works only on high liquid counters with moderate volatility.
Also check Green and Red line which is S1 and R1 of pivot points.
Major benefits o DRS system :
- Automatic – no more guessing, or subjective line drawing
- Calculates supply demand areas based on price and change in volume w.r.t price change (momentum)
- Multiple time frames & fully customization - measured automatically
- 1/5m time frame is best for intraday trading. Will find 2-3 breakouts per day.
- Buy/Sell signals are majorly found during trending day only.
- Inbuilt Buy and Sell signal ( Trading rule apply)
- SL based on channel end.
-Trailing SL also can be opted with blue 44-ema line
- No signals are generated on low liquid counters with high/low volatility (price change > 0.2% and < 2% and avg. volume >20K/candle )
Example Chart Above : All sample chart above shows the DRS trading system applied on Banknifty(NSE)

TUE ADX/MACD Confluence V1.0The ADX and MACD confluence can be a powerful predictor in stock movements. This script will help you find those confluences in an easy to understand visual manner.
It includes Buy and Sell signals for detected confluences, and will show colored candles to help you determine when to exit a trade. When the candles turn to white that means the detected confluence is no longer in play and you may want to consider a trailing stop loss.
The Buy and Sell signals will display on the first occurrence of each confluence.
It's important to understand that both of these are lagging indicators, but with a careful attention to your stoploss you can easily generate a positive profit factor.
This code is provided open source and you're free to use it for any purpose other than resale.

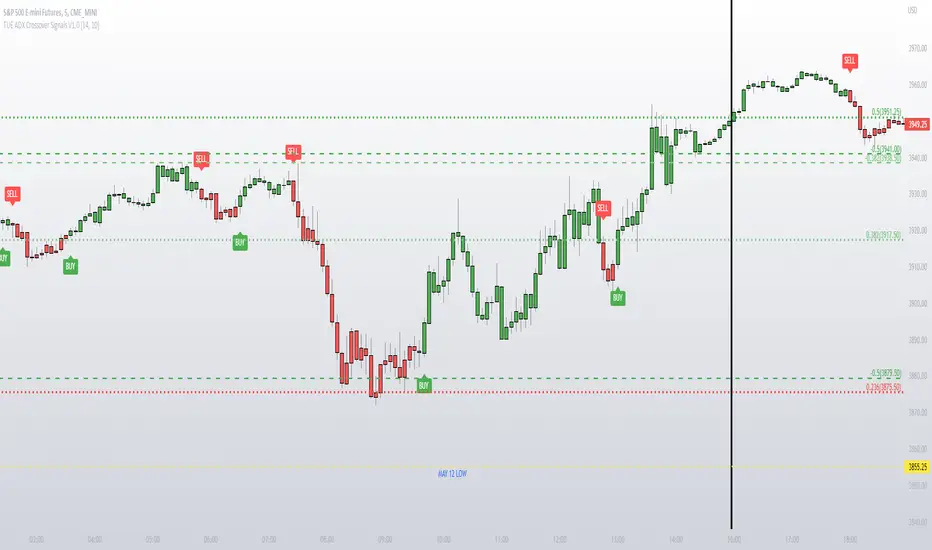
TUE ADX Crossover Signals V1.0This simple indicator gives you a way to visualize ADX crossovers on your chart and is a good companion if you like to trade with the ADX.
Green candles have a DI+ over DI- crossover, and vice versa for the red candles.
It gives you the ability to turn on and off BUY and SELL signals generated from the ADX crossovers.
Code is provided open source, feel free to use it for any purpose other than resale.
Trend & Momentum V2Declutter your charts. Simple indicator combining trend and momentum using Moving Average (currently default to 9-day EMA) and RSI (default length of 8). A long signal is generated when the price closes above the moving average and the moving average color turns red to green which indicated that the momentum measured using RSI is greater than 50. A short signal is generated when the price closes below the moving average and the moving average color turns green to red indicating RSI is below 50. Confirmation is done if there is no reversal on the next candle. For best results use multiple timeframe charts to trade on the right side of trend and momentum.

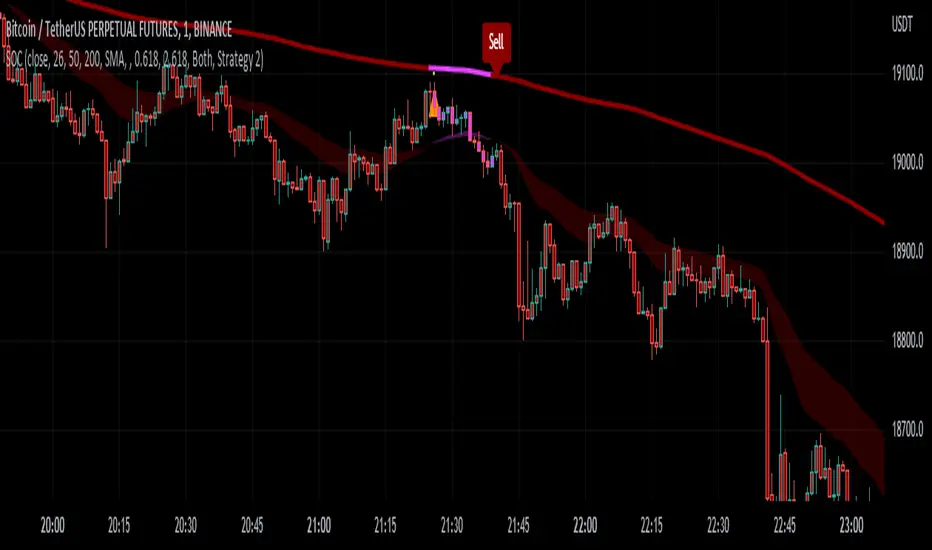
mrDAlgo PremiumBUY / LONG when the Trend Catcher Trend Line cuts upwards and the candle will be green, and the cut candle is above the blue clouds.
SELL / SHORT when the Trend Catcher Trend Line crosses downwards and then the candle cluster will be red, and the prices are below the red clouds.
Moving averages help assess the main trend:
- The price is completely below the moving averages, showing that the downtrend is happening.
- The price is completely above the moving averages indicating an ongoing uptrend.
- The price completely crosses the moving averages showing a sideways trend.
Setting:
A sensitivity setting is recommended for trend confirmation signals.
Show/hide trend catcher
Show/Hide Moving Averages
Alerts: Warn when the signals confirm the trend.
Candle color mode:
Green candle: Strong buy.
Red candle: Strong selling is active.
Purple Candle: Normal buy or sell signal is active.
EQ Cloud: When enabled, a simple "cloud"-like indicator will be displayed on your chart.
The EQ Cloud has a similar effect to the Ichimoku Cloud and can identify the current trend and act as to subsequent support and resistance.
This toolkit is made up of different tools all in one indicator to create your own unique trading strategies.
General disclaimer:
Trading stocks, futures, forex, options, ETFs, cryptocurrency, or any other financial instrument has huge potential rewards but also huge risks.
You must be aware of the risks and willing to accept them to invest in stocks, futures, forex, options, ETFs, or cryptocurrencies.
Don't trade with money you can't afford to lose.
This is not an offer or an offer to Buy/Sell stocks, futures, Forex, options, ETFs, cryptocurrencies, or any other financial instrument.
Do not represent that any account will or is likely to achieve profit or loss of any kind.
Past performance of any trading system or method is not necessarily indicative of future results.
Pre-ScalperHello all,
It is an artificial intelligence indicator that can generate future predictions based on trend tracking and historical data analysis.
It will be in a period of continuous improvement to achieve the highest success rates.
You can use in all market in all time period.
This indicator does not contain any investment advice, it is only a helpful tool in your investments.
BINANCE:AAVEUSDTPERP

Trend MasterThis is a trend aggregator for confirmation and trend signals. It basically aggregates many buy/sell signals and confirmation and by combining them provides a strong buy/sell signal or trend confirmation.
The actual layout idea and trend confirmation is derived from Trend Meter and this indicator uses few other indicator, such as Chandelier Exit, WaveTrend, QQE Signals, Parabolic SAR and AlphaTrend. This indicator aggregates signal from different methods to find out more powerful and confirmed Trend and combines them into one Signal. It also uses Technical Ratings from TradingView team to filter out false signal, it tremendously opts out false signals and improve profitability.
The first seven dots are these
All 3 Trend Meters Now Align
MACD Crossover - Fast - 8, 21, 5
RSI 13: > or < 50
RSI 5: > or < 50
MA Crossover
MA Crossover
Chaikin Money Flow
Alphatrend
Technical Ratings
Then trend
Chandelier Exit
WaveTrend
QQE Signals
Parabolic Sar
All 3 Trend Meters aligns and A signal from trend i
Instructions
Change buy/sell policy based on market trend
Works on all TimeFrame but gives more accuracy on 4H, 1D.
Buy when green big dot appears at the bottom.
Sell when red big dot appears at the bottom.
Red/green dot at the top line appears when three trend meter is aligned and this is a good confirmation.
Any red/green dot below horizontal bars are trend signals.
Big red/green got at the bottom appears whenever there's a good confirmation from trend meter and a buy/sell signal comes from any trend signals.
Also look on the technical ratings bar, green means buy, red means sell and yellow means neutral.
Look for Support or Resistance Levels for price to be attracted to.
Find confluence with other indicators.
The more Trend meters are lit up the better.
Alert
01 Buy Signal = Strong Buy Signal
02 Sell Signal = Strong Sell Signal
03 Buy Signal = Strong Buy Signal
04 Sell Signal = Strong Sell Signal
Thanks to TradingView Technical Ratings authors, evergot, Lij_MC, KivancOzbilgic for their work. This indicator was heavily inspired from their work.

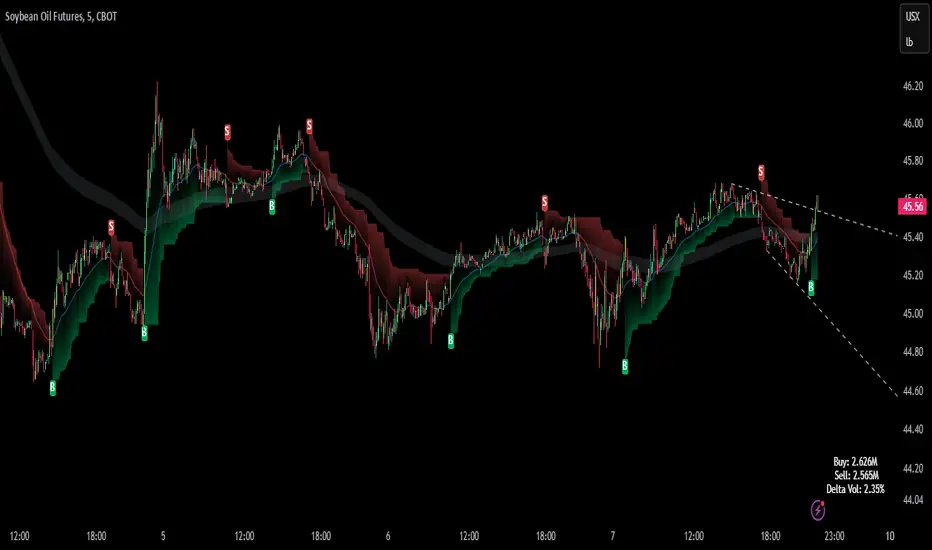
Buy/Sell Aggregated Delta Pressure - InFinitoModified & Updated script from MARKET VOLUME by Ricardo M Arjona @XeL_Arjona that Includes Aggregated Volume , Delta Buy/Sell Pressure
Aggregation code originally from Crypt0rus
***The indicator can be used for any coin/symbol to aggregate volume , but it has to be set up manually***
***The indicator can be used with specific symbol data only by disabling the aggregation option, which allows for it to be used on any symbol***
- Calculated based on Aggregated Volume instead of by symbol volume . Using aggregated data makes it more accurate and allows to compare volume flow between different kinds of markets (Spot, Futures , Perpetuals, Futures+Perpetuals and All Volume ).
- As well, in order to make the data as accurate as possible, the data from each exchange aggregated is normalized to report always in terms of 1 BTC . In case this indicator is used for another symbol, the calculations can be adjusted manually to make it always report data in terms of 1 contract/coin.
- Buy/Sell Pressure: Smoothens the buy and sell volume into a signal for each. Which makes it easier to identify Buy and Sell Volume Flow.
- Buy/Sell Delta Pressure: Calculates the difference between Buy & Sell Pressure and plots a Delta signal that shows who is in control currently.
- Buy/Sell + Delta Pressure: Displays both Buy & Sell Pressure and Delta pressure. This can help to visualize who is in control but also how much pressure there is on each side.
- A Moving Average can be plotted to the Delta pressure. This, with confluence, can give great entries/exits
Things to look for:
- Divergences: If price keeps moving in one direction but the pressure to that side decreases it can be inferred that the move might slow down soon or revert. As well if pressure to one side increases but price does not react to it, it signals that the other side is stronger.
- MA/Zero Crossovers: Delta Pressure Crossover of its moving average or the 0 Line can indicate direction changes prematurely

Momentum 2.0 [AstrideUnicorn]Momentum 2.0 is a normalized Momentum oscillator with a moving base-level. The oscillator value is normalized by its standard deviation, similar to the z-score technique. Instead of the zero level, the indicator uses the base-level calculated as the inverted long-term average value of the oscillator. Similar to the zero-level crossing signal used for the Momentum oscillator, our oscillator calculates the base level crossing signal.
The moving base-level helps to reduce the number of false signals. In an uptrend the base-level is below zero, in a downtrend it is above it. This allows us to take into account the trend stability effect. In this case, to form a reversal signal, the oscillator must cross a lower value in an uptrend and a higher value in a downtrend.
HOW TO USE
When the oscillator crosses above the base-level, it gives a bullish signal, when below it gives a bearish signal. The signals are displayed as green and red labels, respectively.
The color of the histogram shows the current direction of the price momentum. Green indicates an upward move and red indicates a downward move. The blue line represents the base-level.
SETTINGS
Oscillator Period - determines the period of the Momentum oscillator
Base Level Period - determines the period used for long-term averaging when calculating the base-level and normalizing the oscillator

AR Peti Kemas Candle Cross EMA8 EMA13 EMA21 EMA55 EMA90 EMA200This is implementation of Peti Kemas. Slighly modified for the selection of EMA period, but user can change the period.
The strategy is if the current candle close is below EMA90 and EMA200, the buy signal is generated when the close crosses up EMA13.
When the close above EMA90 and ENA200, then the buy signal is generated when the close crosses up EMA8

TT Price/Trend IndicatorThe TT Price/Trend Indicator identifies potential trend changes and advises of safe places to set orders at retracements.
Main Signals:
When a "BUY" signal prints, it is suggested to set a buy order at the Blue trendline and wait until price retraces back.
When a "SELL" signal prints, it is suggested to set a short order at the Blue trendline and wait until price rises up.
Take Profit:
The Reactive Trendline (the thick line that switches from Green to Red, and Red to Green frequently) is good at finding local bottoms.
It is suggested to Take Profit on your Long once you see the first switch from Green to Red. If the Reactive Trendline is already Red when your LONG order is filled, wait until it goes from Red-Green-Red to Take Profit.
It is suggested to Take Profit on your Short once you see the first switch from Red to Green. If the Reactive Trendline is already Green when your SHORT order is filled, wait until it goes from Green-Red-Green to Take Profit.
Stop Loss Suggestions:
If you are LONG (BUY), set your Stop/Loss to slightly below the last Higher Low (HL)
If you are SHORT (SELL), set your Stop/Loss to slightly above the last Lower High (LH)
Alternatively, if you want to maximise your Risk:Reward ratio, you can CLOSE your order once a candle engulfs and closes over both the Blue Line AND the Grey Line. Once these levels are broken and you are underwater, the risk to hold that position is no longer worth it. However, this approach can shake you out of winning trades, so I advise you to use other strategies such as Volume, Fibonnaci and RSI etc to help you make a final decision.
Important: If you are taking this approach, don't panic sell - wait for the close of the current engulfing candle to make this decision, because quite often it will just be a wick up or down in your favour.
What are the best Strategies?
The best timeframes are as follows:
- 1 Hour
- 2 Hour
- 4 Hour
- 1 Day
- 1 Week
My Favourite is 1 Hour.
Scalping for advanced traders:
- 1 minute
- 5 minutes
If you are scalping, it is highly recommended to use the TT Volume Indicator as well, to confirm price with volume (see scripts under my profile). Price on its own will not be good enough.
I also recommend the RSI with a 14 SMA to identify Strength breakouts.
Other Features:
- VWAP (Dotted Red/Green line) - this is common liquidity and can be one of the most important Support/Resistance levels in Crypto, which is why it is included.
Can you FOMO order?
Unless you are using this with a combination of other indicators (such as the TT Volume Indicator), it is not recommended to FOMO orders at the "BUY" or "SELL" signal unless you have a clear volume breakout. Please see this explanation on FOMO ordering for further information:

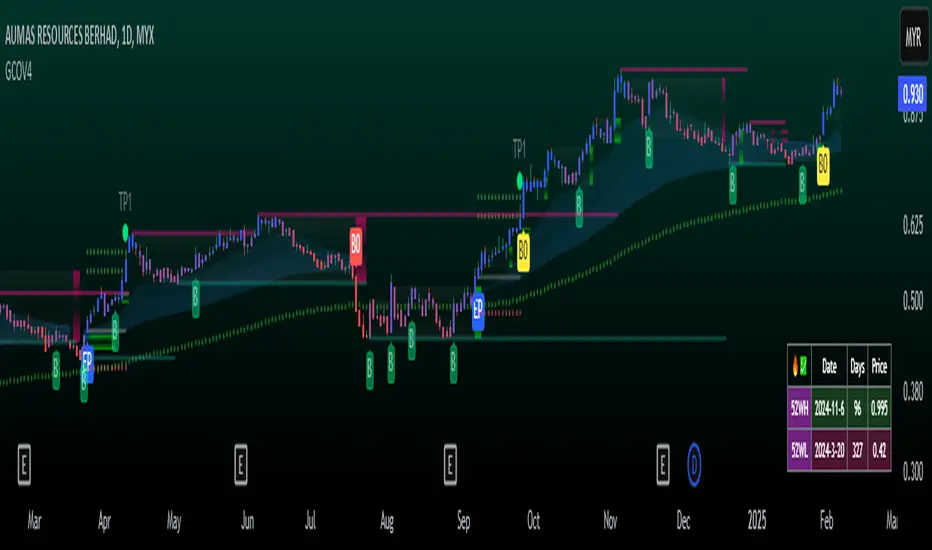
GCOV4 PROTECH GCOV4 PROTECH SYSTEM
This indicator is built specifically for SWING, PULLBACK and BREAKOUT strategy trading in the stocks/equity market. It uses an indicator instrument consisting of ATR TRAILING STOP (ATR), EXPONENTIAL MOVING AVERAGE(EMA), PIVOT POINT and VOLUME ANALYSIS.
The parameters that have been upgraded are to meet the needs of trading strategies whether short or long term trading. In addition, it is built to reduce the risk of trading activities and help traders to adhere to the best trading plan.
This transformation involves 3 trading strategy modes namely SWING PRO, PULL & BOUND and BREAKOUT STRATEGY.
Rebuild of Instrument & Parameter
This indicator is also an upgraded instrument that is sourced from the previous indicator, the GOLDENCO AIE2 INDICATOR.
This R&D of course to make trading activities more effective, dynamic and to increase the confidence of traders in current trading activities. The indicator has been upgraded in terms of parameters as well as additional instruments. Among them are;
1. ATR Trailing Stop
2. Exponential Moving Average – fastMA/slowMA Length
3. Label@Entry Price/Stoploss/Takeprofit line;
>The take profit and stop loss rates are based on percentages. However
traders can change the percentage rate according to their respective
trading plans.
>existing percentage rates have been set(build-in) for standard rate.
So you have to reset based on the type of stock/market cap either penny
stock or blue chip stock.
>The candle/bars have been colored to make it easier for traders to see price
trends whether in bullish or bearish conditions.
Hopefully with the upgrading of these indicators will make traders more successful in trading activities, especially in the equity markets.
DISCLAIMER;
ALL NOTES AND INDICATING TOOLS ARE FOR EDUCATIONAL ONLY AND AS A FACILITATOR AND PREPARATION IN TRADING ACTIVITIES. ADMIN IS NOT RESPONSIBLE FOR ANY RISKS IN YOUR TRADING ACTIVITIES. TAKE AT YOUR OWN RISK.
FunTrader/Aieyee @2022
TTrail| Trade Trail‴What does it do?
This indicator suggests buy and sell signals with a third indicator as a confirmation indicator.
What is it composed of?
This indicator has three buy or sell signals:
SAR (Stop And Reverse): dotted line above and below the candles;
VR (Volatility Range): green and red line above and below the candles;
SR (Spread Range) ): blue and pink line above and below the candles.
How does it work?
The SAR indicator is a tracker and confirms the movement of VR and SR. The VR indicator is a more conservative Buy/Sell flag, tolerating more price fluctuation. The SR indicator is a less conservative Buy/Sell flag, not tolerating much price fluctuation. The balanced use of these 3 indicators helps the trader to be more coherent in making a decision to open or close a trade.
Some of the characteristics of this indicator are:
it is possible to change the colors of the signaling lines and box;
it is possible to adjust the greater or lesser tolerance of the 3 indicators according to the volatility of the asset;
it is possible to activate/deactivate the indicators and their attributes;
the respective gray boxes refer to countertrend Buy/Sell signals (open/close position against MA20).
How to get access to it?
If you wish to lease this indicator, please contact me by DM, do not use the comment area.

[UPRIGHT Trading] Awesome STC+Hello Traders,
I hope you all are doing well.
Today I'm releasing another one of my favorites: the Schaff Trend Cycle (STC). In 2008, Doug Schaff publically released the STC as an improvement on cycle oscillators and the MACD, hence its common nickname, "The better MACD."
This oscillator is essentially a fusion of the benefits of trend and cycle indicators; the idea is to minimize their drawbacks, such as lags or false signals. The STC is mainly used to determine or confirm price direction and market reversals.
We calculate the STC as a double smoothed stochastic of the MACD, which outputs an oscillator that moves between 0 and 100.
How is it typically used?
In trending markets, we can expect the oscillator to move up if the market is in the accelerating uptrend and an accelerating downtrend are to push the oscillator down.
In sideways markets, the STC shows oversold when it reverses after falling below 25; overbought when the STC turns down from above 75.
How the Awesome STC+ is different:
This STC uses several complex equations and filters to improve accuracy and reduce lag.
My original STC wave.
Multiple extremely accurate Buy/Sell signals not found on a traditional STC indicator.
Ability to use 4 different background highlights and several buy/sell and confirmation signals.
Fully customizable (as always), ability to turn on or off any signals, change any of the colors to suit your needs.
Pre-filled Alerts.
Reversals and Continuations.
Chart should look like this:
Please see the "Author's Instructions" for access.
Cheers,
Mike
(UPRIGHT Trading)

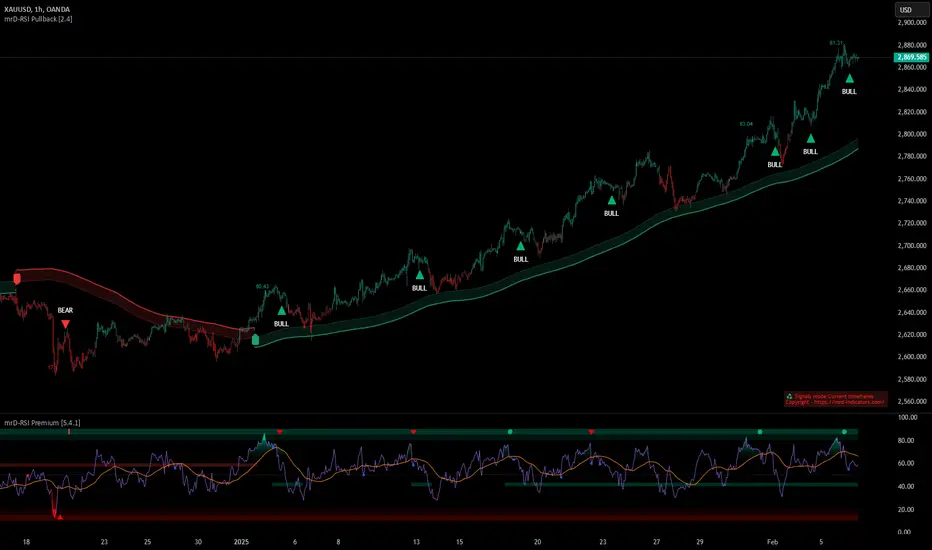
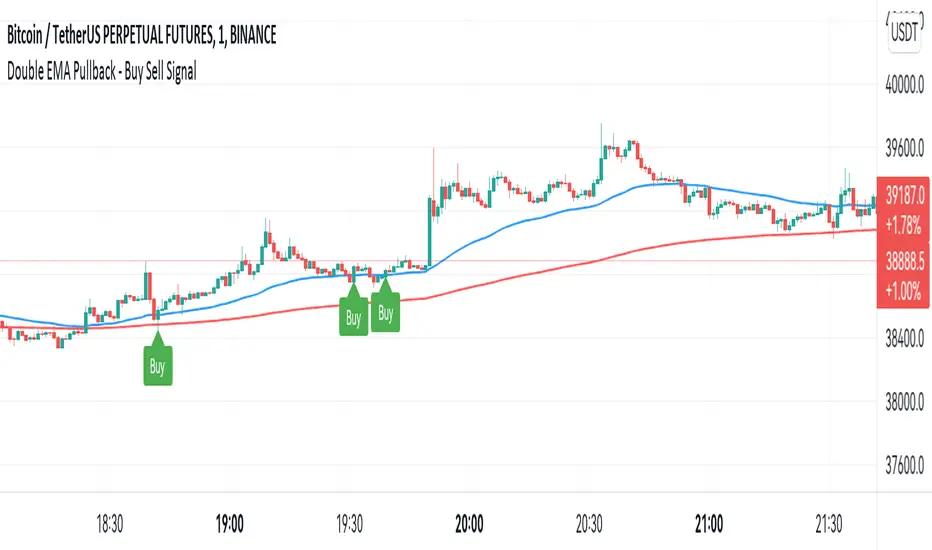
Double EMA WIth Pullback Buy Sell Signal - Smarter AlgoBuilt with love "Double EMA With Pullback Buy Sell Signal "
This indiator will help you to find a Double EMA Pullback Signal
You can combine with your own strategy, or use this purely
DISCLAIMER :
Measure the risk first before use it in real market
Backtest The Strategy was very important, so you know the probability
Fundamentally Logical :
Pullback (Some Previous candle is Red for Bull Pullback vice versa)
the Entry candle must be a Candlestick Pattern
Features :
1. Double EMA
2. Pullback Signal
How to use it :
1. Adjust the Pullback Backstep
2. Adjust the EMA Period
3. Adjust the Style to your preferences
Regards,
Hanabil
[UPRIGHT Trading] Awesome MACD+ (cc)Hello Traders,
I'd like to introduce you all to the Awesome MACD+ indicator.
As most of you know, the Moving Average Convergence Divergence, MACD, indicator is a one of the most popular indicator among traders. The MACD is a trend-momentum indicator that measures the relationship between moving averages and uses a signal line to show crossovers between the MACD line. The signal line is generally used as a trigger for buy/sell signals with a cross of the MACD line or confirmation when used with other strategies. More advanced traders will look for divergences; divergences can, for example, indicate a weakness in the current trend.
How the Awesome MACD+ is different:
This MACD uses several complex equations and filters to improve accuracy.
Multiple extremely accurate Buy/Sell signals not found on a traditional MACD indicator.
Ability to use 2 different background highlight signals and several different buy/sell signals.
Fully customizable (as always), ability to turn on or off any signals, change any of the colors to suit your needs.
***I've used Bitcoin in the chart above just to show that it is still extremely accurate using alt-coins as well.
On AAPL
Advanced algo trend filtering
Easy to read signals for every level of trader.
..Can work for the minimalist.
..Those that want every signal.
..Those that like a balance of signals.
Whatever your style or skill level, the Awesome MACD+ can be customized to fit your needs.
The above chart should look like this:
Good luck Traders.
Cheers,
Mike
(UPRIGHT Trading)

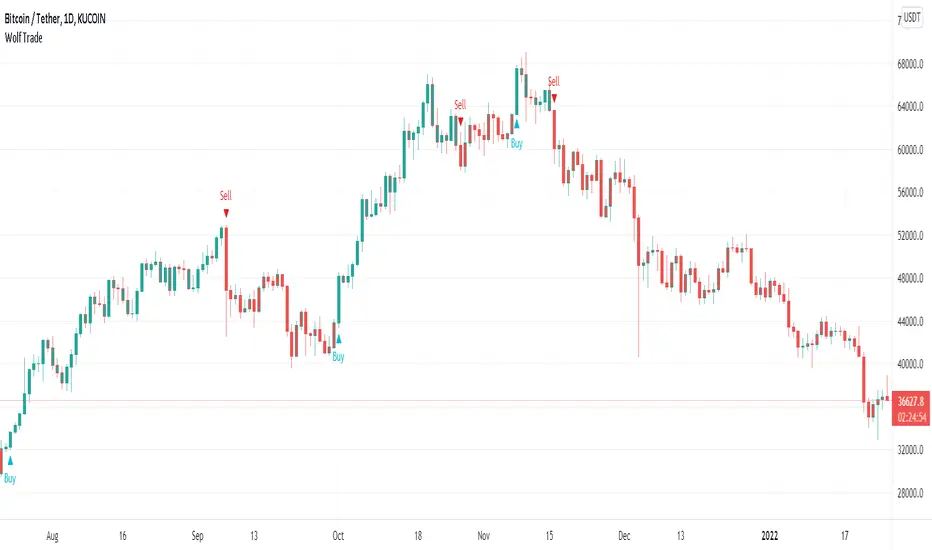
Wolf TradeWolf Trade indicator designed to help you develop your own trading strategy and give you that extra confirmation on your trade ideas. This indicator helps you to identify the right buying or selling opportunity. Examines several items to issue a buying or selling position. For example, it checks the status of the RSI , as well as the status of the MACD , as well as the status of the stochastic . Checks the order of placement of the EMA and the condition of their cross with ATR. And uses the ATR for stop loss.
Wolf Trade indicator commodities on all timeframes including 1m, 3m , 5m, 15m, 30m, 1H, 2H, 4H, 1D, 1W, etc. Definitely, the performance of this indicator is much better in 1, 2, 4 hours and daily timeframes, but that does not mean you can not use it in shorter time frames.
This indicator is does not repaint and works on any market internationally including crypto, stocks, forex, futures and currencies. You can utilize our indicator for scalping, swing trading, holding or even for trading options as well.
Long Term Buy/Sell Signal by BonyThis script attempts to use Exponential Moving averages (short-term and long-term convergence) of different lengths in order to identify trade entries and exits for bullish & bearish trades. I would strongly recommend using this as a guide to enter or exit long-term swing trades on growth names such as Apple, Tesla, Microsoft to keep your emotions out of the trading. You use this script by entering a trade when it signals a green BUY signal with a UP arrow and exiting when it signals red. The general idea is that one is fast and one is slow-moving EMA and these indicate when to buy/sell when they crossover the overbought/sold lines.
Disclaimer:
This script is for educational purposes only. The market is always moving up or down, so always trade with caution and use your best judgment for every trade.

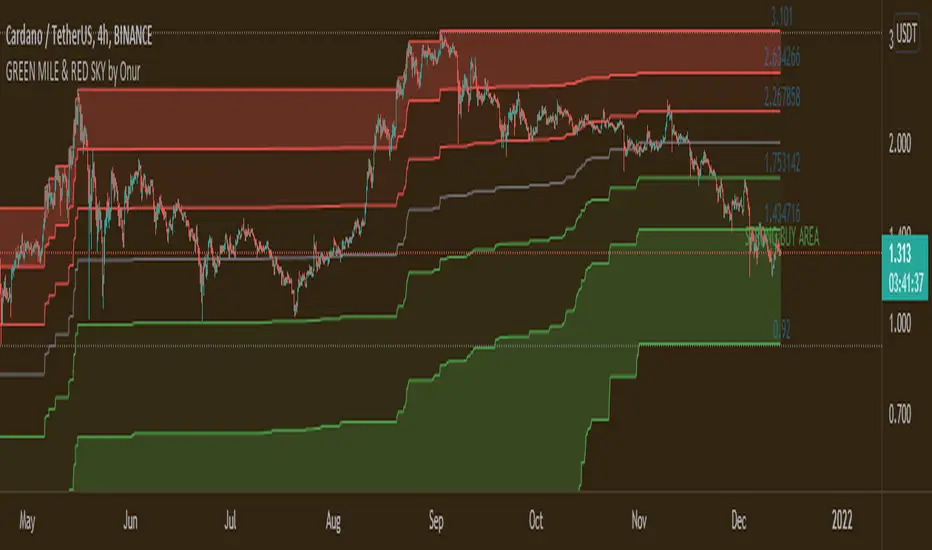
GREEN MILE & RED SKY by OnurThis indicator is the upgrated version of "GREEN MILE by Onur". Indicator shows fibonacci buying + selling levels due to the past 3500 (adjustable and 1500 by default) candles. Prices in the dark green area is a strong buying signal. Prices in the dark red areas is strong selling signal
Decreasing period value makes indicator effective from long term to short term.
Works harmoniously with MACD & RSI indicators.
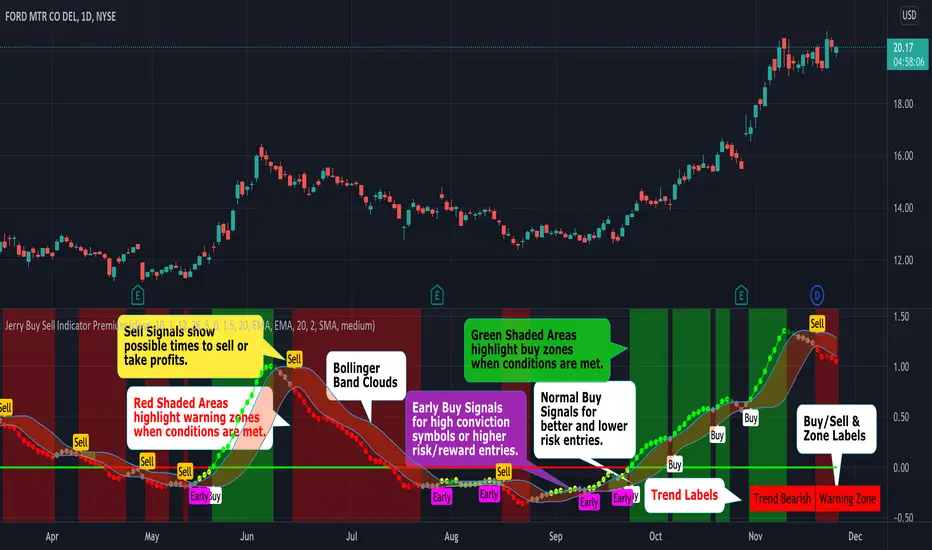
Jerry Buy Sell IndicatorThis indicator has unique conditions in the script that create the following:
1. Buy and Sell zones
2. Early Buy, Buy and Sell signals that are determined by conditions including relative position to the zero line.
3. Defines 6 different short term trends
4. Trend Labels to show the current short term trend (located in the lower right corner).
5. Buy, Sell, Buy Zone & Warning Zone Labels
6. 14 user controlled inputs allow the user to customize the settings.
7. Unique functionality that allows you to create trade alerts based on conditions being met with criteria scans built into the indicator.
# 7 is a cool unique feature of our indicator. For example you can easily create a TRADE ALERT for a symbol based on a Buy Signal being met in any time frame. This is possible because we have built into the script the ability to select multiple conditions including BUY ALERT, EARLY BUY ALERT AND SELL ALERT. You can also use the alerts to scan your stocks individually for buy zones and warning zones or for crossing above or below the clouds. TradingView alerts can notify you via pop-up, email, sound notification, email to SMS & sound notifications.
Buy Sell Indicator Features
----- Trends
- Red Dots (Red Cloud) = Warning zone. Generally do not buy or consider selling.
- Dark Red Dots = Warning BUT Improving. Things are getting better.
- Grey Dots = Neutral. No clear short term trend.
- Yellow Dots = Early. Great for high conviction stocks but early for the main buy signal.
- Dark Green Dots = In the buy zone but losing strength.
- Green Dots (Green Cloud) = Trend is bullish & stock is in the buy zone.
- Trend Line = Shows the prevailing direction of price and if the momentum is beamish, bullish or neutral.
----- Buy & Sell Signals
- Early Buy Bubble= The first day the Early Buy signal is triggered. Early Buy Signals occur below the zero line and are higher risk/reward. This is a unique feature of this indicator.
- Buy Bubble = Indicator Buy Signal Triggered. Buy Signals occur above the zero line.
- Sell Bubble = Indicator Sell Signal Triggered.
----- Ways To Use The Indicator
1. Buy/Sell during with the main buy and sell Alerts in the Buy (green shaded) and Warning (red shaded) zones.
2. In The Red You’re Dead. Most buy signals happen outside of the red warning zone. There are exceptions like reversals and momentum squeezes.
3. Buy Sell Indicator can be used by itself or with other indicators (Momentum Dream works well)
4. Use Red and Green Clouds/Shading to assist with position direction. In the buy zone look to go long. In the red zone generally do not add to your position or consider selling.
5. Use Red Clouds to tighten stops or close positions.
6. Customize the indicators to vary the results by selecting Wilders, SMA, EMA, WMA, and HullMA moving averages.
7. The early buy signal/bubble appears on the chart the first day the early buy signal is triggered and can be used for entry into high conviction stocks or if you want to take a higher risk/reward trade.
8. The standard buy signal is shown when conditions have been met to indicate a better buy entry point with less risk.
Disclaimer: The information contained in our scripts/indicators/ideas does not constitute financial advice or a solicitation to buy or sell any securities of any type. We will not accept liability for any loss or damage, including without limitation any loss of profit, which may arise directly or indirectly from the use of or reliance on such information. All investments involve risk, and the past performance of a security, industry, sector, market, financial product, trading strategy, or individual’s trading does not guarantee future results or returns. Investors are fully responsible for any investment decisions they make. Such decisions should be based solely on an evaluation of their financial circumstances, investment objectives, risk tolerance, and liquidity needs.
Please Use the link below for more information.
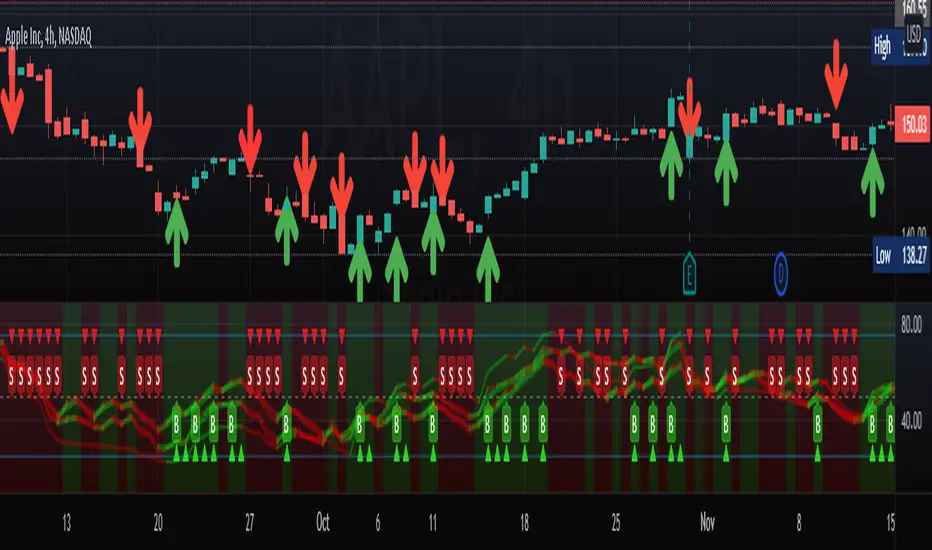
M.Right_ OBV / Volume Smoothed RSI & 3 RSI EMAsFirst, I'd like to thank all those coders who've inspired me to learn and code my own indicator. This is the result of tireless hours of work learning to code and tweaking until everything fits exactly what I was looking for. After using it for a while and seeing the benefits personally, I figured now might be a good time to share with everyone while we are in such great market volatility , maybe I can save you some losses.
Basically, my indicator is meant to use RSI, Volume, and Volatility to show where oversold and overbought levels are, but also good times to buy and alerts.
I've tried to make my indicators as customizable as possible with all the bells and whistles you'd expect, but to have Proprietary calculations under the hood that you probably won't find anywhere else.
This indicator is a great pair with my Top and Bottom Finder.
Features:
Works on all timeframes.
Alerts.
Background highlights.
Buy/Sell signals and arrows (with the option to remove them).
Let me know if you have any questions, and enjoy.
Cheers,
Mike
GoldenCO Aie3Use of GCOv3 strategy for market analysis
This gco3 strategy uses exponential moving average analysis which is 5emas to show the movement of stock prices in the market. It is also to track the impending changes to the market price. the use of EMA is more sensitive to trend changes and it is one way to see the trend of price movements and as a guide to the trader.
The parameters used are EMA5/EMA20/EMA50/EMA100/EMA200.
The above parameters indicate a price condition that includes 4 phases of the price trend, namely the accumulation, uptrend, distribution, and ddowntrend phases.
we hope that, by recognizing and knowing the trend of this price movement it can help traders in trading activities well and can reduce risk. May it benefit the trader.
DISCLAIMER ; This is not Buy/Sell call, Just analysis idea for education. Trade At Your Own Risk