BB, MA & RSI StrategyI couldn't find any scripts that mixed the MA BB and RSI's so I made one. :)
Happy to share the code for 0.045 ETH
Eth address: 0xdccF5EBb8759f94DbD09b65CE7f0bDCDf1ec782f
Let me know once you have deposited and ill give you the code ;)
I also have a conversion to alerts as well to get it working in autoview.
Enjoy!
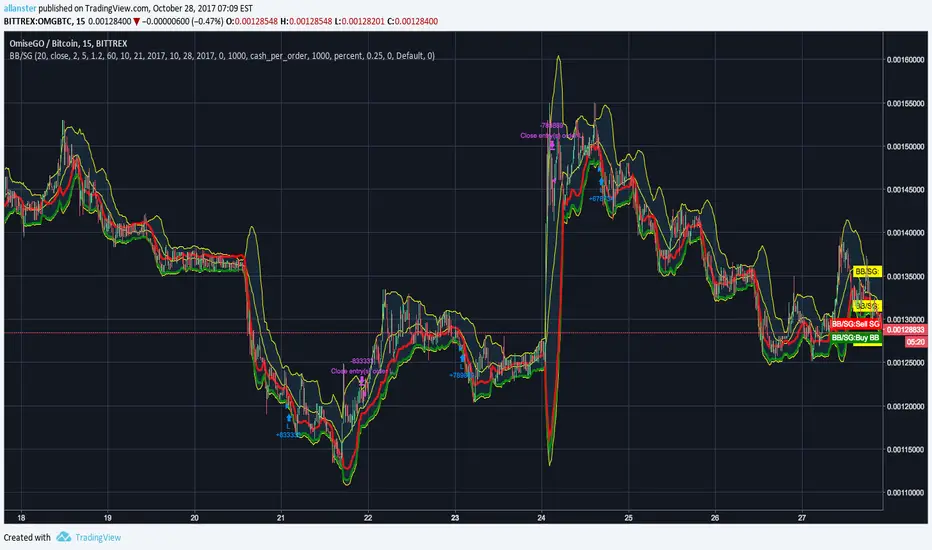
Bollinger Bands (BB)

Gunbot Deluxe TunersThis script combines all of the other Gunbot tuners along with Okkie's mode into a complete all in one simulation of Gunbot with the ability to mix and match buy and sell strategies of any combination.
No public requests or donations for access to this script will be granted. Anyone interested in obtaining this script must contact me privately either here or preferably through Telegram. No exceptions.
NOTICE: By requesting access to this script you acknowledge that you have read and understood that this is for research purposes only and I am not responsible for any financial losses you may incur by using this script!

GunbotXT BB-RSISimulation of GunbotXT BB-RSI strategy useful for fine tuning settings and backtesting.
In Pine Editor -> Open "GunbotXT BB-RSI" -> Add To Chart -> On Indicator -> Format -> Input your desired settings to test.
Yellow = Bollinger Bands
Red = High BB (Sell)
Green = Low BB (Buy)
You will not see the RSI on the chart, you need to (and should) add 2nd indicator "Relative Strength Indicator" so that you can visually see how it is being used in the tuner. If you change the RSI 70/30 numbers in the tuner then change them also in the RSI 2nd indicator that you added below the tuner so that they visually match what is going on behind the scenes in the tuner.
NOTICE: By requesting access to this script you acknowledge that you have read and understood that this is for research purposes only and I am not responsible for any financial losses you may incur by using this script!

Gunbot BB StepGain TunerSimulation of Gunbot BB Stepgain strategy useful for fine tuning settings and backtesting.
In Pine Editor -> Open "Gunbot BB Stepgain" -> Add To Chart -> On Indicator -> Format -> Input your desired settings to test.
Red = Stepgain Sell Level
Green = BB Buy Level
NOTICE: By requesting access to this script you acknowledge that you have read and understood that this is for research purposes only and I am not responsible for any financial losses you may incur by using this script!
Gunbot BB TunerGunbot BB Tuner
Simulation of Gunbot Pure BB strategy useful for fine tuning settings and backtesting. Set chart period (5min, 15min, etc...) to match what you will enter as period in strategy.
In Pine Editor -> Open "Gunbot BB Tuner" -> Add To Chart -> On Indicator -> Format -> Input your desired settings to test.
Yellow = Bollinger Bands
Red = High BB (Sell)
Green = Low BB (Buy)
NOTICE: By requesting access to this script you acknowledge that you have read and understood that this is for research purposes only and I am not responsible for any financial losses you may incur by using this script!

Gunbot BB - Dmitrovic v1.0Gunbot script made based on bollinger bands.
Currently backtesting in v1.0.

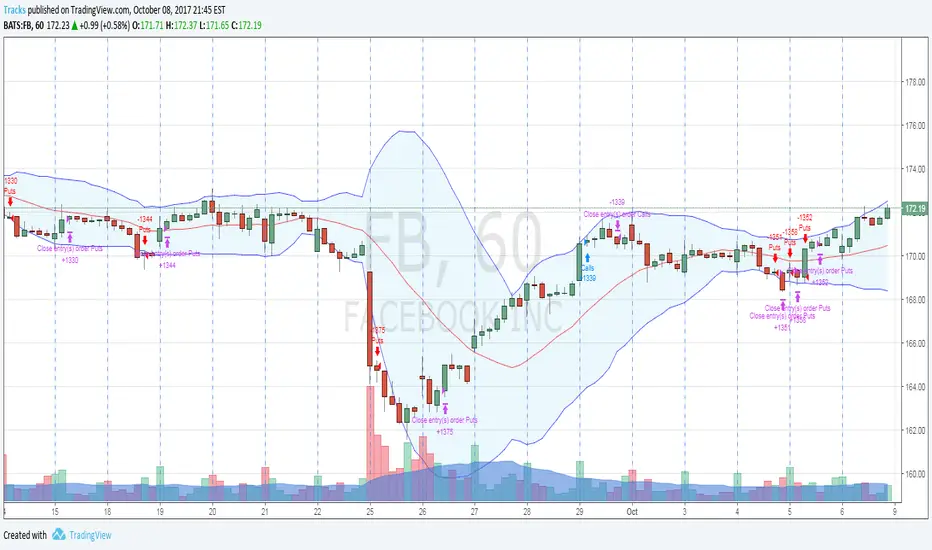
Tightened Bollinger Band StrategyThis is a strategy built on the "easter egg" strategy I included in my Combo indicator. This setup is based on Facebook (FB) using the hourly timeframe. Changes to timeframe or ticker will usually require major adjustments to the variables. The ROI for the Facebook backtest was about 126% using stock commons. Obviously if you are making these trades using options, the gains would be exponentially bigger.
In it's current state it is not following the rules that were discussed on the OptionsPlayers site. Variables were tweaked based on increased ROI, which has turned it into a bit of a frankenstein indicator, so don't expect to learn the discussed trade rules from this.
Access to this strategy is limited to the members of OptionsPlayers. For more information you can visit OptionsPlayers.com.
If you are an OP member and would like access to the strategy, please DM me in the OptionsPlayers chat.
Bollinger + RSI, Double Strategy Long-Only (by ChartArt) v1.2This strategy uses the RSI indicator together with the Bollinger Bands to go long when the price is below the lower Bollinger Band (and to close the long trade when this value is above the upper Bollinger band).
This simple strategy only places a long, when both the RSI and the Bollinger Bands indicators are at the same time in a oversold condition.
In this new version 1.2 the strategy was simplified even more than before by going long-only, which made the strategy more successful in backtesting than the previous version (that older version also opened short trades).
This strategy does not repaint and was updated to PineScript version 3.
All trading involves high risk; past performance is not necessarily indicative of future results. Hypothetical or simulated performance results have certain inherent limitations. Unlike an actual performance record, simulated results do not represent actual trading. Also, since the trades have not actually been executed, the results may have under- or over-compensated for the impact, if any, of certain market factors, such as lack of liquidity. Simulated trading programs in general are also subject to the fact that they are designed with the benefit of hindsight. No representation is being made that any account will or is likely to achieve profits or losses similar to those shown.
P.S. For advanced users: If you want also be able to short with the same strategy approach, then please use my older version 1.1:

Moving Average Cross and/or Bbands botHello TradingView and world!
This is one of our latest concepts for an actual bot builder. This script comes with a bunch of features that we're hoping will alleviate a lot of the stress and confusion around using and building strategies here on TV. Especially if the end-goal is to automate the strategies using Autoview.
This is a combination of 2 strategies, and gives you full control of each component within the script.
The 2 strategies are:
2 Moving Averages == if close is greater than moving average and moving average 1 is greater than moving average 2
Bolling Bands == if close is less than lower or greater than upper
Features / Settings included :
- Ability to change settings from a commodity market (default) to an altcoin or forex market.
- Backtest time period selector component
- Heiken Ashi Candles on/off
- Moving Average Strategy on/off
- Bollinger Bands Strategy on/off
- Both Moving Average settings can be adjusted
- Bollinger Bands length and multiplier can be adjusted.
- Pyramiding Greater Than, Equal To, or Less Than
- Trailing Stop with the ability to set a price in which the Trailing Stop activate
- Take Profit on/off and editable
- Stop Loss on/off and editable
- Margin Call on/off dependent on Leverage which is editable
- If pyramiding is used, the strategy will calculate and display your average on the chart
- Profit and Loss visuals added to the chart
You can watch a video here on how all the settings can be used and work together.
www.youtube.com
You can learn more about Autoview here:
autoview.with.pink
Get your invite and join us in slack here:
slack.with.pink

Gunbot - BbandsThis is more of a test run than anything. Gunbot approximation courtesy of Vosechu and the original can be found here.
Autoview members only.

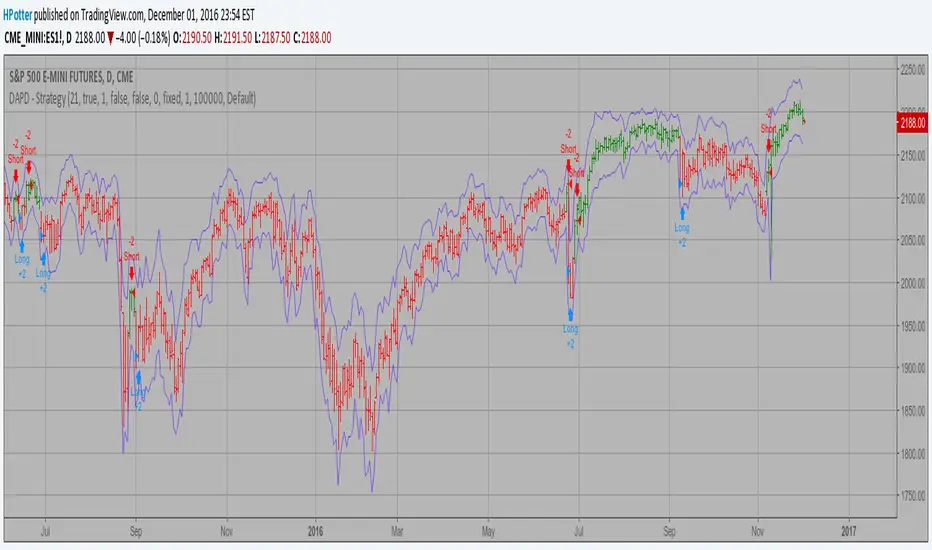
DAPD - Strategy Backtest This indicator is similar to Bollinger Bands. It based on DAPD - Daily
Average Price Delta. DAPD is based upon a summation for each of the
highs (hod) for the 21 days prior to today minus the summation for
each of the lows (lod) for the last 21 days prior to today. The result
of this calculation would then be divided by 21.
It will be buy when high above previos DAPD high and sell if low below previos DAPD low
You can change long to short in the Input Settings
Please, use it only for learning or paper trading. Do not for real trading.
Double Bollinger Bands StrategyDouble Bollinger Strategy. Price crosses inner BB (with increasing outer BB) long is placed. Long is closed when price closes below outer BB. Reversed for short. The numbers are tuned for NZDUSD 15min chart.
Pbin = percent on inner BB
Pbout = percent on outer BB
There are all kinds of other inputs, trailing stop, limit, etc.
Errors, questions, suggestions are wanted, thank you

Single SMA cross with BB StrategyThis is a light weight code and strategy. I tuned it for NZDUSD on a 15 min chart. NZDUSD is a slow moving low volatility pair. A single SMA cross over + crossing a .9 BB + the single SMA is increasing. I will be manually trading this with alerts and once I have LUA down I will set it free with FXCM and see what it can do on it own.
** I use BB as a means of seeing momentum to continue gaining not as a reversal signal.
Please contact me with issues/questions

Forex Master v4.0 (EUR/USD Mean-Reversion Algorithm)DESCRIPTION
Forex Master v4.0 is a mean-reversion algorithm currently optimized for trading the EUR/USD pair on the 5M chart interval. All indicator inputs use the period's closing price and all trades are executed at the open of the period following the period where the trade signal was generated.
There are 3 main components that make up Forex Master v4.0:
I. Trend Filter
The algorithm uses a version of the ADX indicator as a trend filter to trade only in certain time periods where price is more likely to be range-bound (i.e., mean-reverting). This indicator is composed of a Fast ADX and a Slow ADX, both using the same look-back period of 50. However, the Fast ADX is smoothed with a 6-period EMA and the Slow ADX is smoothed with a 12-period EMA. When the Fast ADX is above the Slow ADX, the algorithm does not trade because this indicates that price is likelier to trend, which is bad for a mean-reversion system. Conversely, when the Fast ADX is below the Slow ADX, price is likelier to be ranging so this is the only time when the algorithm is allowed to trade.
II. Bollinger Bands
When allowed to trade by the Trend Filter, the algorithm uses the Bollinger Bands indicator to enter long and short positions. The Bolliger Bands indicator has a look-back period of 20 and a standard deviation of 1.5 for both upper and lower bands. When price crosses over the lower band, a Long Signal is generated and a long position is entered. When price crosses under the upper band, a Short Signal is generated and a short position is entered.
III. Money Management
Rule 1 - Each trade will use a limit order for a fixed quantity of 50,000 contracts (0.50 lot). The only exception is Rule
Rule 2 - Order pyramiding is enabled and up to 10 consecutive orders of the same signal can be executed (for example: 14 consecutive Long Signals are generated over 8 hours and the algorithm sends in 10 different buy orders at various prices for a total of 350,000 contracts).
Rule 3 - Every order will include a bracket with both TP and SL set at 50 pips (note: the algorithm only closes the current open position and does not enter the opposite trade once a TP or SL has been hit).
Rule 4 - When a new opposite trade signal is generated, the algorithm sends in a larger order to close the current open position as well as open a new one (for example: 14 consecutive Long Signals are generated over 8 hours and the algorithm sends in 10 different buy orders at various prices for a total of 350,000 contracts. A Short Signal is generated shortly after the 14th Long Signal. The algorithm then sends in a sell order for 400,000 contracts to close the 350,000 contracts long position and open a new short position of 50,000 contracts).

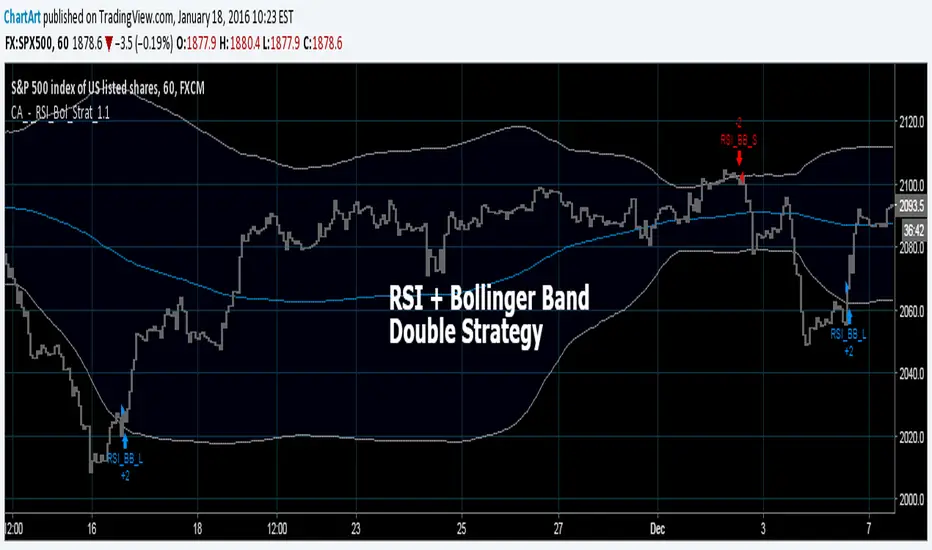
Bollinger + RSI, Double Strategy (by ChartArt) v1.1This strategy uses the RSI indicator together with the Bollinger Bands to sell when the price is above the upper Bollinger Band (and to buy when this value is below the lower band). This simple strategy only triggers when both the RSI and the Bollinger Band indicators are at the same time in a overbought or oversold condition.
UPDATE
In this updated version 1.1 the strategy was both simplified for the user (less inputs) and made more successful in backtesting by now using a 200 period for the SMA which is the basis for the Bollinger Band. I also reduced the number of color alerts to show fewer, but more relevant trading opportunities.
And just like the first version this strategy does not use close prices from higher-time frame and should not repaint after the current candle has closed. It might repaint like every Tradingview indicator while the current candle hasn't closed.
All trading involves high risk; past performance is not necessarily indicative of future results. Hypothetical or simulated performance results have certain inherent limitations. Unlike an actual performance record, simulated results do not represent actual trading. Also, since the trades have not actually been executed, the results may have under- or over-compensated for the impact, if any, of certain market factors, such as lack of liquidity. Simulated trading programs in general are also subject to the fact that they are designed with the benefit of hindsight. No representation is being made that any account will or is likely to achieve profits or losses similar to those shown.
P.S. For advanced users if you want access to more functions of this strategy script, then please use version 1.0:
Bollinger + RSI, Double Strategy (by ChartArt)Bollinger Bands + RSI, Double Strategy
This strategy uses a slower RSI with period 16 to sell when the RSI increases over the value of 55 (or to buy when the value falls below 45), with the classic Bollinger Bands strategy to sell when the price is above the upper Bollinger Band and falls below it (and to buy when the price is below the lower band and rises above it). This strategy only triggers when both the RSI and the Bollinger Bands indicators are at the same time in the described overbought or oversold condition. In addition there are color alerts which can be deactivated.
This basic strategy is based upon the "RSI Strategy" and "Bollinger Bands Strategy" which were created by Tradingview and uses no money management like a trailing stop loss and no scalping methods. Every win/loss trade is simply counted from the last overbought/oversold condition to the next one.
This strategy does not use close prices from higher-time frame and should not repaint after the current candle has closed. It might repaint like every Tradingview indicator while the current candle hasn't closed.
All trading involves high risk; past performance is not necessarily indicative of future results. Hypothetical or simulated performance results have certain inherent limitations. Unlike an actual performance record, simulated results do not represent actual trading. Also, since the trades have not actually been executed, the results may have under- or over-compensated for the impact, if any, of certain market factors, such as lack of liquidity. Simulated trading programs in general are also subject to the fact that they are designed with the benefit of hindsight. No representation is being made that any account will or is likely to achieve profits or losses similar to those shown.

Strategy CCT Bollinger Band OscillatorThis strategy buy when ema crossover CCT BB oscillator and sell when crossunder. No SL neither TP only trailling stop at 1$. CCT BB oscillator is LaztBear indicator. Thanks to him.
