BBDIV_StrategyBollinger Bands Divergence Strategy 2HBollinger Bands Divergence Strategy 2HBollinger Bands Divergence Strategy 2HBollinger Bands Divergence Strategy 2HBollinger Bands Divergence Strategy 2HBollinger Bands Divergence Strategy 2HBollinger Bands Divergence Strategy 2HBollinger Bands Divergence Strategy 2HBollinger Bands Divergence Strategy 2HBollinger Bands Divergence Strategy 2HBollinger Bands Divergence Strategy 2HBollinger Bands Divergence Strategy 2HBollinger Bands Divergence Strategy 2HBollinger Bands Divergence Strategy 2HBollinger Bands Divergence Strategy 2HBollinger Bands Divergence Strategy 2HBollinger Bands Divergence Strategy 2HBollinger Bands Divergence Strategy 2HBollinger Bands Divergence Strategy 2HBollinger Bands Divergence Strategy 2HBollinger Bands Divergence Strategy 2HBollinger Bands Divergence Strategy 2HBollinger Bands Divergence Strategy 2HBollinger Bands Divergence Strategy 2HBollinger Bands Divergence Strategy 2HBollinger Bands Divergence Strategy 2HBollinger Bands Divergence Strategy 2HBollinger Bands Divergence Strategy 2HBollinger Bands Divergence Strategy 2HBollinger Bands Divergence Strategy 2HBollinger Bands Divergence Strategy 2HBollinger Bands Divergence Strategy 2HBollinger Bands Divergence Strategy 2HBollinger Bands Divergence Strategy 2HBollinger Bands Divergence Strategy 2HBollinger Bands Divergence Strategy 2HBollinger Bands Divergence Strategy 2HBollinger Bands Divergence Strategy 2HBollinger Bands Divergence Strategy 2HBollinger Bands Divergence Strategy 2HBollinger Bands Divergence Strategy 2HBollinger Bands Divergence Strategy 2HBollinger Bands Divergence Strategy 2HBollinger Bands Divergence Strategy 2HBollinger Bands Divergence Strategy 2HBollinger Bands Divergence Strategy 2HBollinger Bands Divergence Strategy 2HBollinger Bands Divergence Strategy 2HBollinger Bands Divergence Strategy 2HBollinger Bands Divergence Strategy 2HBollinger Bands Divergence Strategy 2HBollinger Bands Divergence Strategy 2HBollinger Bands Divergence Strategy 2HBollinger Bands Divergence Strategy 2HBollinger Bands Divergence Strategy 2HBollinger Bands Divergence Strategy 2HBollinger Bands Divergence Strategy 2HBollinger Bands Divergence Strategy 2HBollinger Bands Divergence Strategy 2HBollinger Bands Divergence Strategy 2HBollinger Bands Divergence Strategy 2HBollinger Bands Divergence Strategy 2HBollinger Bands Divergence Strategy 2HBollinger Bands Divergence Strategy 2HBollinger Bands Divergence Strategy 2HBollinger Bands Divergence Strategy 2H
Bollinger Bands (BB)

Bollinger Bubble BreakoutThe Bollinger Bubble Breakout (BBB) indicator is a tool for analyzing price movements using Bollinger Bands combined with additional moving averages. It is based on the idea, known as the "Bollinger Bubble Theory," that when a candle closes outside the Bollinger Bands, the price often returns quickly to the 7-period Exponential Moving Average (EMA).
Bollinger Bands are made up of a middle line, which is typically a moving average, and two outer bands that represent standard deviations from this line. These bands help identify when the price is overbought or oversold. The BBB indicator builds on this by adding customizable options for the middle line, allowing the user to choose between different types of moving averages, such as SMA or EMA.
The indicator provides visual signals when the price moves outside the bands. A buy signal appears when the price closes below the lower band, and a sell signal appears when it closes above the upper band. These signals are marked directly on the chart for clarity.
The BBB indicator also includes options to display a 7-period EMA and a 200-period SMA. The EMA shows the short-term reversion level, while the SMA helps identify the overall trend. This combination of tools makes the BBB indicator useful for spotting price reversals and understanding the market's trend context.
This indicator is easy to use and helps traders identify opportunities when price action becomes extreme. It is particularly helpful for those who look for mean reversion setups or want to combine short-term signals with long-term trend analysis.

Bollinger Bands Divergence with Buy and Sell Signalsmy fav indicators
my fav indicators
my fav indicators
my fav indicators
my fav indicators
my fav indicators
my fav indicators
my fav indicators
my fav indicators
my fav indicators
my fav indicators
my fav indicators
my fav indicators

DT Bollinger BandsIndicator Overview
Purpose: The script calculates and plots Bollinger Bands, a technical analysis tool that shows price volatility by plotting:
A central moving average (basis line).
Upper and lower bands representing price deviation from the moving average.
Additional bands for a higher deviation threshold (3 standard deviations).
Customization: Users can customize:
The length of the moving average.
The type of moving average (e.g., SMA, EMA).
The price source (e.g., close price).
Standard deviation multipliers for the bands.
Fixed Time Frame: The script can use a fixed time frame (e.g., daily) for calculations, regardless of the chart's time frame.
Key Features
Moving Average Selection:
The user can select the type of moving average for the basis line:
Simple Moving Average (SMA)
Exponential Moving Average (EMA)
Smoothed Moving Average (SMMA/RMA)
Weighted Moving Average (WMA)
Volume Weighted Moving Average (VWMA)
Standard Deviation Multipliers:
Two multipliers are used:
Standard (default = 2.0): For the original Bollinger Bands.
Larger (default = 3.0): For additional bands.
Bands Calculation:
Basis Line: The selected moving average.
Upper Band: Basis + Standard Deviation.
Lower Band: Basis - Standard Deviation.
Additional Bands: Representing ±3 Standard Deviations.
Plots:
Plots the basis, upper, and lower bands.
Fills the area between the bands for visual clarity.
Plots and fills additional bands for ±3 Standard Deviations with lighter colors.
Alerts:
Generates an alert when the price enters the range between the 2nd and 3rd standard deviation bands.
The alert can be used to notify when price volatility increases significantly.
Background Highlighting:
Colors the chart background based on alert conditions:
Green if the price is above the basis line.
Red if the price is below the basis line.
Offset:
Adds an optional horizontal offset to the plots for fine-tuning their alignment.
How It Works
Input Parameters:
The user specifies settings such as moving average type, length, multipliers, and fixed time frame.
Calculations:
The script computes the basis (moving average) and standard deviations on the fixed time frame.
Bands are calculated using the basis and multipliers.
Plotting:
The basis line and upper/lower bands are plotted with distinct colors.
Additional 3 StdDev bands are plotted with lighter colors.
Alerts:
An alert condition is created when the price moves between the 2nd and 3rd standard deviation bands.
Visual Enhancements:
Chart background changes color dynamically based on the price’s position relative to the basis line and alert conditions.
Usage
This script is useful for traders who:
Want a detailed visualization of price volatility.
Use Bollinger Bands to identify breakout or mean-reversion trading opportunities.
Need alerts when the price enters specific volatility thresholds.

RSI and Bollinger Bands Screener [deepakks444]Indicator Overview
The indicator is designed to help traders identify potential long signals by combining the Relative Strength Index (RSI) and Bollinger Bands across multiple timeframes. This combination allows traders to leverage the strengths of both indicators to make more informed trading decisions.
Understanding RSI
What is RSI?
The Relative Strength Index (RSI) is a momentum oscillator that measures the speed and change of price movements. Developed by J. Welles Wilder Jr. for stocks and forex trading, the RSI is primarily used to identify overbought or oversold conditions in an asset.
How RSI Works:
Calculation: The RSI is calculated using the average gains and losses over a specified period, typically 14 periods.
Range: The RSI oscillates between 0 and 100.
Interpretation:
Key Features of RSI:
Momentum Indicator: RSI helps identify the momentum of price movements.
Divergences: RSI can show divergences, where the price makes a higher high, but the RSI makes a lower high, indicating potential reversals.
Trend Identification: RSI can also help identify trends. In an uptrend, the RSI tends to stay above 50, and in a downtrend, it tends to stay below 50.
Understanding Bollinger Bands
What is Bollinger Bands?
Bollinger Bands are a type of trading band or envelope plotted two standard deviations (positively and negatively) away from a simple moving average (SMA) of a price. Developed by financial analyst John Bollinger, Bollinger Bands consist of three lines:
Upper Band: SMA + (Standard Deviation × Multiplier)
Middle Band (Basis): SMA
Lower Band: SMA - (Standard Deviation × Multiplier)
How Bollinger Bands Work:
Volatility Measure: Bollinger Bands measure the volatility of the market. When the bands are wide, it indicates high volatility, and when the bands are narrow, it indicates low volatility.
Price Movement: The price tends to revert to the mean (middle band) after touching the upper or lower bands.
Support and Resistance: The upper and lower bands can act as dynamic support and resistance levels.
Key Features of Bollinger Bands:
Volatility Indicator: Bollinger Bands help traders understand the volatility of the market.
Mean Reversion: Prices tend to revert to the mean (middle band) after touching the bands.
Squeeze: A Bollinger Band Squeeze occurs when the bands narrow significantly, indicating low volatility and a potential breakout.
Combining RSI and Bollinger Bands
Strategy Overview:
The strategy aims to identify potential long signals by combining RSI and Bollinger Bands across multiple timeframes. The key conditions are:
RSI Crossing Above 60: The RSI should cross above 60 on the 15-minute timeframe.
RSI Above 60 on Higher Timeframes: The RSI should already be above 60 on the hourly and daily timeframes.
Price Above 20MA or Walking on Upper Bollinger Band: The price should be above the 20-period moving average of the Bollinger Bands or walking on the upper Bollinger Band.
Strategy Details:
RSI Calculation:
Calculate the RSI for the 15-minute, 1-hour, and 1-day timeframes.
Check if the RSI crosses above 60 on the 15-minute timeframe.
Ensure the RSI is above 60 on the 1-hour and 1-day timeframes.
Bollinger Bands Calculation:
Calculate the Bollinger Bands using a 20-period moving average and 2 standard deviations.
Check if the price is above the 20-period moving average or walking on the upper Bollinger Band.
Entry and Exit Signals:
Long Signal: When all the above conditions are met, consider a long entry.
Exit: Exit the trade when the price crosses below the 20-period moving average or the stop-loss is hit.
Example Usage
Setup:
Add the indicator to your TradingView chart.
Configure the inputs as per your requirements.
Monitoring:
Look for the long signal on the chart.
Ensure that the RSI is above 60 on the 15-minute, 1-hour, and 1-day timeframes.
Check that the price is above the 20-period moving average or walking on the upper Bollinger Band.
Trading:
Enter a long position when the criteria are met.
Set a stop-loss below the low of the recent 15-minute candle or based on your risk management rules.
Monitor the trade and exit when the RSI returns below 60 on any of the timeframes or when the price crosses below the 20-period moving average.
House Rules Compliance
No Financial Advice: This strategy is for educational purposes only and should not be construed as financial advice.
Risk Management: Always use proper risk management techniques, including stop-loss orders and position sizing.
Past Performance: Past performance is not indicative of future results. Always conduct your own research and analysis.
TradingView Guidelines: Ensure that any shared scripts or strategies comply with TradingView's terms of service and community guidelines.
Conclusion
This strategy combines RSI and Bollinger Bands across multiple timeframes to identify potential long signals. By ensuring that the RSI is above 60 on higher timeframes and that the price is above the 20-period moving average or walking on the upper Bollinger Band, traders can make more informed decisions. Always remember to conduct thorough research and use proper risk management techniques.

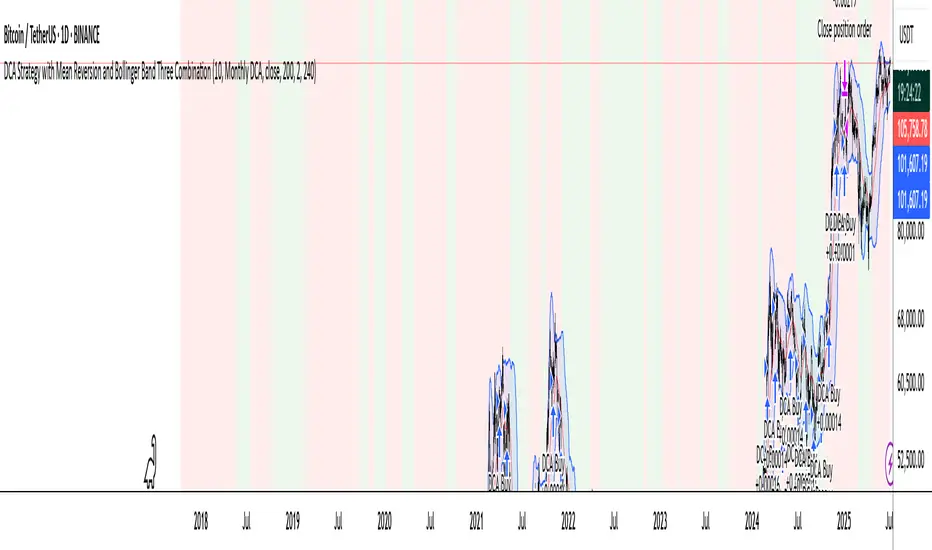
DCA Strategy with Mean Reversion and Bollinger BandDCA Strategy with Mean Reversion and Bollinger Band
The Dollar-Cost Averaging (DCA) Strategy with Mean Reversion and Bollinger Bands is a sophisticated trading strategy that combines the principles of DCA, mean reversion, and technical analysis using Bollinger Bands. This strategy aims to capitalize on market corrections by systematically entering positions during periods of price pullbacks and reversion to the mean.
Key Concepts and Principles
1. Dollar-Cost Averaging (DCA)
DCA is an investment strategy that involves regularly purchasing a fixed dollar amount of an asset, regardless of its price. The idea behind DCA is that by spreading out investments over time, the impact of market volatility is reduced, and investors can avoid making large investments at inopportune times. The strategy reduces the risk of buying all at once during a market high and can smooth out the cost of purchasing assets over time.
In the context of this strategy, the Investment Amount (USD) is set by the user and represents the amount of capital to be invested in each buy order. The strategy executes buy orders whenever the price crosses below the lower Bollinger Band, which suggests a potential market correction or pullback. This is an effective way to average the entry price and avoid the emotional pitfalls of trying to time the market perfectly.
2. Mean Reversion
Mean reversion is a concept that suggests prices will tend to return to their historical average or mean over time. In this strategy, mean reversion is implemented using the Bollinger Bands, which are based on a moving average and standard deviation. The lower band is considered a potential buy signal when the price crosses below it, indicating that the asset has become oversold or underpriced relative to its historical average. This triggers the DCA buy order.
Mean reversion strategies are popular because they exploit the natural tendency of prices to revert to their mean after experiencing extreme deviations, such as during market corrections or panic selling.
3. Bollinger Bands
Bollinger Bands are a technical analysis tool that consists of three lines:
Middle Band: The moving average, usually a 200-period Exponential Moving Average (EMA) in this strategy. This serves as the "mean" or baseline.
Upper Band: The middle band plus a certain number of standard deviations (multiplier). The upper band is used to identify overbought conditions.
Lower Band: The middle band minus a certain number of standard deviations (multiplier). The lower band is used to identify oversold conditions.
In this strategy, the Bollinger Bands are used to identify potential entry points for DCA trades. When the price crosses below the lower band, this is seen as a potential opportunity for mean reversion, suggesting that the asset may be oversold and could reverse back toward the middle band (the EMA). Conversely, when the price crosses above the upper band, it indicates overbought conditions and signals potential market exhaustion.
4. Time-Based Entry and Exit
The strategy has specific entry and exit points defined by time parameters:
Open Date: The date when the strategy begins opening positions.
Close Date: The date when all positions are closed.
This time-bound approach ensures that the strategy is active only during a specified window, which can be useful for testing specific market conditions or focusing on a particular time frame.
5. Position Sizing
Position sizing is determined by the Investment Amount (USD), which is the fixed amount to be invested in each buy order. The quantity of the asset to be purchased is calculated by dividing the investment amount by the current price of the asset (investment_amount / close). This ensures that the amount invested remains constant despite fluctuations in the asset's price.
6. Closing All Positions
The strategy includes an exit rule that closes all positions once the specified close date is reached. This allows for controlled exits and limits the exposure to market fluctuations beyond the strategy's timeframe.
7. Background Color Based on Price Relative to Bollinger Bands
The script uses the background color of the chart to provide visual feedback about the price's relationship with the Bollinger Bands:
Red background indicates the price is above the upper band, signaling overbought conditions.
Green background indicates the price is below the lower band, signaling oversold conditions.
This provides an easy-to-interpret visual cue for traders to assess the current market environment.
Postscript: Configuring Initial Capital for Backtesting
To ensure the backtest results align with the actual investment scenario, users must adjust the Initial Capital in the TradingView strategy properties. This is done by calculating the Initial Capital as the product of the Total Closed Trades and the Investment Amount (USD). For instance:
If the user is investing 100 USD per trade and has 10 closed trades, the Initial Capital should be set to 1,000 USD.
Similarly, if the user is investing 200 USD per trade and has 24 closed trades, the Initial Capital should be set to 4,800 USD.
This adjustment ensures that the backtesting results reflect the actual capital deployed in the strategy and provides an accurate representation of potential gains and losses.
Conclusion
The DCA strategy with Mean Reversion and Bollinger Bands is a systematic approach to investing that leverages the power of regular investments and technical analysis to reduce market timing risks. By combining DCA with the insights offered by Bollinger Bands and mean reversion, this strategy offers a structured way to navigate volatile markets while targeting favorable entry points. The clear entry and exit rules, coupled with time-based constraints, make it a robust and disciplined approach to long-term investing.
Ultra Smart TrailIntroduction
The Ultra Smart Trail indicator is a comprehensive tool for traders seeking to identify and follow market trends efficiently. Combining dynamic trend detection with adaptive price bands, this indicator simplifies the process of understanding market direction and strength. It provides clear visual cues and customizable settings, catering to both novice and experienced traders.
Detailed Description
The Ultra Smart Trail indicator works by calculating a Trend Flow Line (TFL) using a hybrid moving average technique. This TFL dynamically adjusts to market conditions, smoothing out price fluctuations while remaining responsive to significant market shifts.
.........
Trend Flow Line (TFL)
A color-coded line indicating bullish, bearish, or neutral trends based on price movement relative to the TFL.
The TFL uses a combination of weighted moving averages (WMA) and double-weighted moving averages (DWMA) for accuracy.
.....
Dynamic Price Bands
The indicator plots upper and lower bands around the TFL, based on customizable multipliers of standard deviation. These bands adapt dynamically to volatility, helping traders spot overbought or oversold conditions.
The script calculates standard deviation-based bands with customizable multipliers, enabling precise adjustment to trading styles or instruments.
.....
Uptrend/Downtrend Highlights
The background and price bands visually differentiate trending and ranging markets, making it easier to identify high-probability trade setups.
.....
Reversal Alerts
By analyzing the relationship between price and bands, the script highlights potential reversals or continuation zones with distinct levels and fills.
.........
This indicator is a powerful addition to any trader’s toolkit, simplifying market analysis and enhancing decision-making.

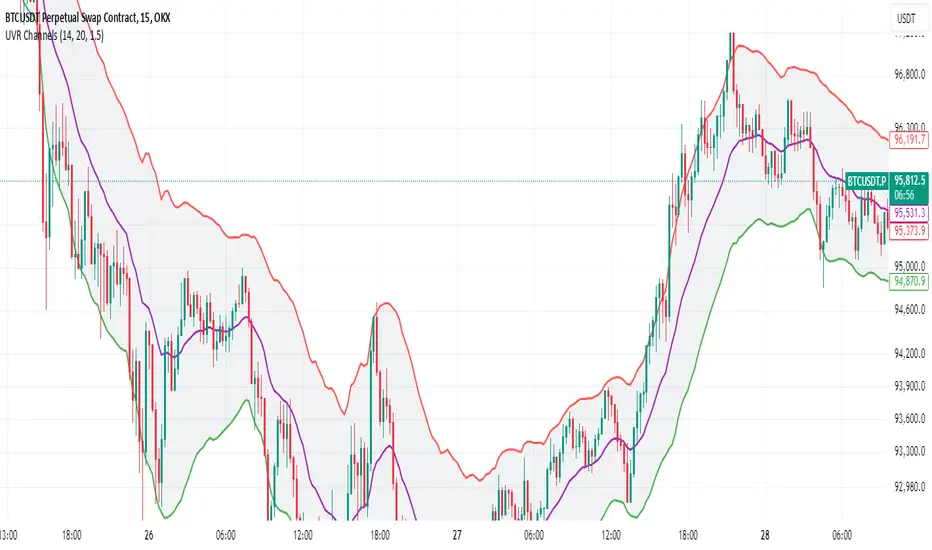
UVR ChannelsUVR CHANNELS: A VOLATILITY-BASED TREND ANALYSIS TOOL
PURPOSE
UVR Channels are designed to dynamically measure market volatility and identify key price levels for potential trend reversals. The channels are calculated using a unique volatility formula(UVR) combined with an EMA as the central reference point. This approach provides traders with a tool for evaluating trends, reversals, and market conditions such as breakouts or consolidations.
CALCULATION MECHANISM
1. Ultimate Volatility Rate (UVR) Calculation:
The UVR is a custom measure of volatility that highlights significant price movements by comparing the extremes of current and previous candles.
Volatility Components:
Two values are calculated to represent potential price fluctuations:
The absolute difference between the current candle's high and the previous candle's low:
Volatility Component 1=∣high−low ∣
The absolute difference between the previous candle's high and the current candle's low:
Volatility Component 2=∣high −low∣
Volatility Ratio:
The larger of the two components is selected as the Volatility Ratio, ensuring the UVR captures the most significant movement:
Volatility Ratio=max(Volatility Component 1,Volatility Component 2)
Smoothing with SMMA:
To stabilize the volatility calculation, the Volatility Ratio is smoothed using a Smoothed Moving Average (SMMA) over a user-defined period (e.g., 14 candles):
UVR= (UVR(Previous) × (Period−1))+Volatility Ratio)/Period
2. Band Construction:
The UVR is integrated into the band calculations by using the Exponential Moving Average (EMA) as the central line:
Central Line (EMA):
The EMA is calculated based on closing prices over a user-defined period (e.g., 20 candles).
Upper Band:
The upper band represents a dynamic resistance level, calculated as:
Upper Band=EMA+(UVR × Multiplier)
Lower Band:
The lower band serves as a dynamic support level, calculated as:
Lower Band=EMA−(UVR × Multiplier)
3. Role of the Multiplier:
The Multiplier adjusts the width of the bands based on trader preferences:
Higher Multiplier: Wider bands to capture larger price swings.
Lower Multiplier: Narrower bands for tighter market analysis.
FEATURES AND USAGE
Dynamic Volatility Analysis:
The UVR Channels expand and contract based on real-time market volatility, offering a dynamic framework for identifying potential price trends.
Expanding Bands: High market volatility.
Contracting Bands: Low volatility or consolidation.
Trend Identification:
Price consistently near the upper band indicates a strong bullish trend.
Price near the lower band signals a bearish trend.
Trend Reversal Signals:
Price reaching the upper band may signal overbought conditions, while price touching the lower band may signal oversold conditions.
Breakout Potential:
Narrow bands often precede significant price breakouts, making UVR Channels a useful tool for spotting early breakout conditions.
DIFFERENCES FROM BOLLINGER BANDS
Unlike Bollinger Bands, which rely on standard deviation to measure volatility, the UVR Channels use a custom volatility formula based on price extremes (highs and lows). This approach adapts to market behaviour in a unique way, providing traders with an alternative and accurate view of volatility and trends.
INPUT PARAMETERS
Volatility Period:
Determines the number of periods used to smooth the volatility ratio. A higher value results in smoother bands but may lag behind sudden market changes.
EMA Period:
Controls the calculation of the central reference line.
Multiplier:
Adjusts the width of the bands. Increasing the multiplier widens the bands, capturing larger price movements, while decreasing it narrows the bands for tighter analysis.
VISUALIZATION
Purple Line: The EMA (central line).
Red Line: Upper band (dynamic resistance).
Green Line: Lower band (dynamic support).
Shaded Area: Fills the space between the upper and lower bands, visually highlighting the channel.
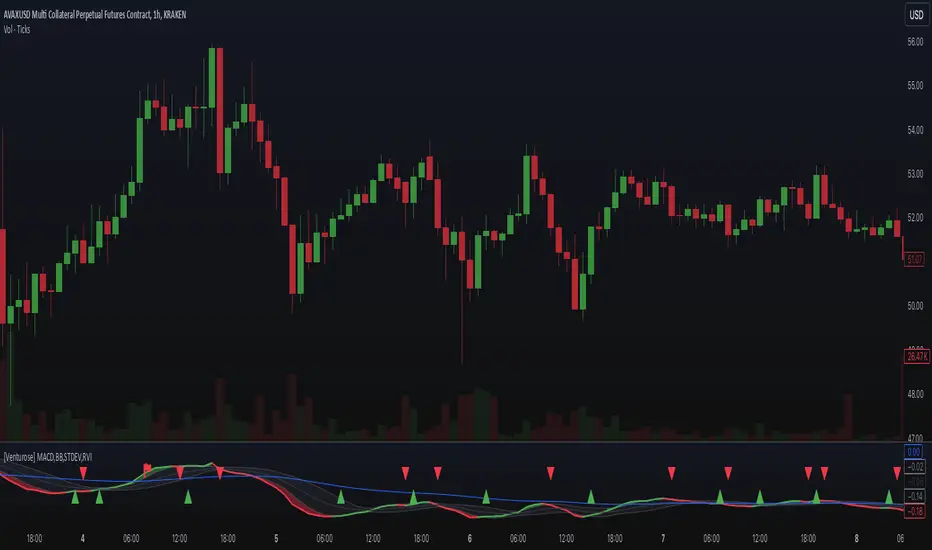
[Venturose] MACD x BB x STDEV x RVIDescription:
The MACD x BB x STDEV x RVI combines MACD, Bollinger Bands, Standard Deviation, and Relative Volatility Index into a single tool. This indicator is designed to provide insights into market trends, momentum, and volatility. It generates buy and sell signals, by analyzing the interactions between these components. These buy and sell signals are not literal, and should be used in combination with the current trend.
How It Works:
MACD: Tracks momentum and trend direction using customizable fast and slow EMA periods.
Bollinger Bands: Adds volatility bands to MACD to identify overextension zones.
Standard Deviation: Dynamically adjusts the Bollinger Band width based on MACD volatility.
RVI (Relative Volatility Index): Confirms momentum extremes with upper and lower threshold markers.
Custom Logic: Includes a trigger system ("inside" or "flipped") to adapt signals to various market conditions and an optional filter to reduce noise.
Key Features:
Combines MACD and Bollinger Bands with volatility and momentum confirmations from RVI.
Dynamic color-coded plots for identifying bullish, bearish, and neutral trends.
Customizable parameters for tailoring the indicator to different strategies.
Optional signal filtering to refine buy and sell triggers.
Alerts for buy and sell signals based on signal logic.
Why It’s Unique:
This indicator combines momentum (MACD), volatility (Bollinger Bands and Standard Deviation), and confirmation signals (RVI thresholds) into a unified system. It introduces custom "inside" and "flipped" triggers for adaptable signal generation and includes signal filtering to reduce noise. The addition of RVI-based hints helps identify early overbought or oversold conditions, providing an extra layer of insight for decision-making. The dynamic integration of these components ensures a comprehensive yet straightforward analysis tool for various market conditions.
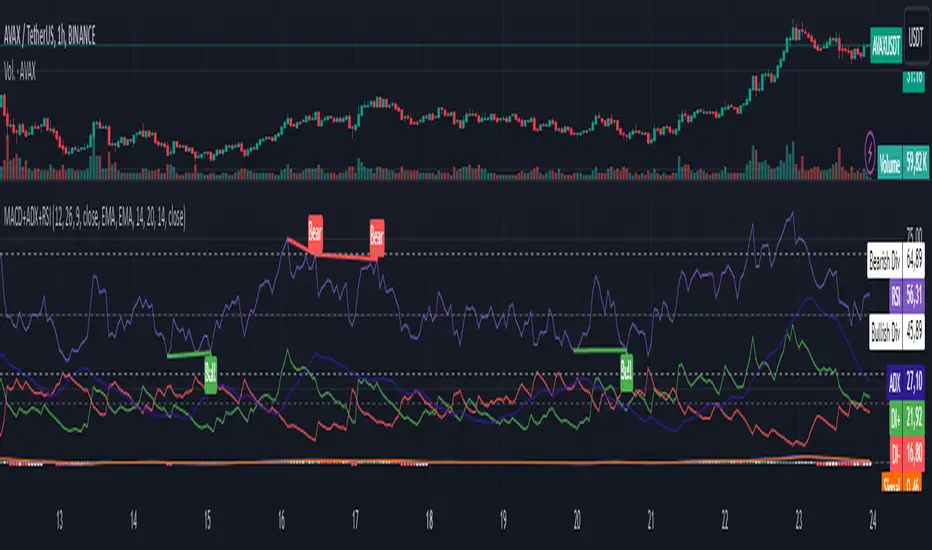
MACD, ADX & RSI -> for altcoins# MACD + ADX + RSI Combined Indicator
## Overview
This advanced technical analysis tool combines three powerful indicators (MACD, ADX, and RSI) into a single view, providing a comprehensive analysis of trend, momentum, and divergence signals. The indicator is designed to help traders identify potential trading opportunities by analyzing multiple aspects of price action simultaneously.
## Components
### 1. MACD (Moving Average Convergence Divergence)
- **Purpose**: Identifies trend direction and momentum
- **Components**:
- Fast EMA (default: 12 periods)
- Slow EMA (default: 26 periods)
- Signal Line (default: 9 periods)
- Histogram showing the difference between MACD and Signal line
- **Visual**:
- Blue line: MACD line
- Orange line: Signal line
- Green/Red histogram: MACD histogram
- **Interpretation**:
- Histogram color changes indicate potential trend shifts
- Crossovers between MACD and Signal lines suggest entry/exit points
### 2. ADX (Average Directional Index)
- **Purpose**: Measures trend strength and direction
- **Components**:
- ADX line (default threshold: 20)
- DI+ (Positive Directional Indicator)
- DI- (Negative Directional Indicator)
- **Visual**:
- Navy blue line: ADX
- Green line: DI+
- Red line: DI-
- **Interpretation**:
- ADX > 20 indicates a strong trend
- DI+ crossing above DI- suggests bullish momentum
- DI- crossing above DI+ suggests bearish momentum
### 3. RSI (Relative Strength Index)
- **Purpose**: Identifies overbought/oversold conditions and divergences
- **Components**:
- RSI line (default: 14 periods)
- Divergence detection
- **Visual**:
- Purple line: RSI
- Horizontal lines at 70 (overbought) and 30 (oversold)
- Divergence labels ("Bull" and "Bear")
- **Interpretation**:
- RSI > 70: Potentially overbought
- RSI < 30: Potentially oversold
- Bullish/Bearish divergences indicate potential trend reversals
## Alert System
The indicator includes several automated alerts:
1. **MACD Alerts**:
- Rising to falling histogram transitions
- Falling to rising histogram transitions
2. **RSI Divergence Alerts**:
- Bullish divergence formations
- Bearish divergence formations
3. **ADX Trend Alerts**:
- Strong trend development (ADX crossing threshold)
- DI+ crossing above DI- (bullish)
- DI- crossing above DI+ (bearish)
## Settings Customization
All components can be fine-tuned through the settings panel:
### MACD Settings
- Fast Length
- Slow Length
- Signal Smoothing
- Source
- MA Type options (SMA/EMA)
### ADX Settings
- Length
- Threshold level
### RSI Settings
- RSI Length
- Source
- Divergence calculation toggle
## Usage Guidelines
### Entry Signals
Strong entry signals typically occur when multiple components align:
1. MACD histogram color change
2. ADX showing strong trend (>20)
3. RSI showing divergence or leaving oversold/overbought zones
### Exit Signals
Consider exits when:
1. MACD crosses signal line in opposite direction
2. ADX shows weakening trend
3. RSI reaches extreme levels with divergence
### Risk Management
- Use the indicator as part of a complete trading strategy
- Combine with price action and support/resistance levels
- Consider multiple timeframe analysis for confirmation
- Don't rely solely on any single component
## Technical Notes
- Built for TradingView using Pine Script v5
- Compatible with all timeframes
- Optimized for real-time calculation
- Includes proper error handling and NA value management
- Memory-efficient calculations for smooth performance
## Installation
1. Copy the provided Pine Script code
2. Open TradingView Chart
3. Create New Indicator -> Pine Editor
4. Paste the code and click "Add to Chart"
5. Adjust settings as needed through the indicator settings panel
## Version Information
- Version: 2.0
- Last Updated: November 2024
- Platform: TradingView
- Language: Pine Script v5
MACD+RSI+BBDESCRIPTION
The MACD + RSI + Bollinger Bands Indicator is a comprehensive technical analysis tool designed for traders and investors to identify potential market trends and reversals. This script combines three indicators: the Moving Average Convergence Divergence (MACD), the Relative Strength Index (RSI), and Bollinger Bands. Each of these indicators provides unique insights into market behavior.
FEATURES
MACD (Moving Average Convergence Divergence)
The MACD is a trend-following momentum indicator that shows the relationship between two moving averages of a security’s price.
The script calculates the MACD line, the signal line, and the histogram, which visually represents the difference between the MACD line and the signal line.
RSI (Relative Strength Index)
The RSI is a momentum oscillator that measures the speed and change of price movements. It ranges from 0 to 100 and is typically used to identify overbought or oversold conditions.
The script allows users to set custom upper and lower thresholds for the RSI, with default values of 70 and 30, respectively.
Bollinger Bands
Bollinger Bands consist of a middle band (EMA) and two outer bands (standard deviations away from the EMA). They help traders identify volatility and potential price reversals.
The script allows users to customize the length of the Bollinger Bands and the multiplier for the standard deviation.
Color-Coding Logic
The histogram color changes based on the following conditions:
Black: If the RSI is above the upper threshold and the closing price is above the upper Bollinger Band, or if the RSI is below the lower threshold and the closing price is below the lower Bollinger Band.
Green (#4caf50): If the RSI is above the upper threshold but the closing price is not above the upper Bollinger Band.
Light Green (#a5d6a7): If the histogram is positive and the RSI is not above the upper threshold.
Red (#f23645): If the RSI is below the lower threshold but the closing price is not below the lower Bollinger Band.
Light Red (#faa1a4): If the histogram is negative and the RSI is not below the lower threshold.
Inputs
Bollinger Bands Settings
Length: The number of periods for the moving average.
Basis MA Type: The type of moving average (SMA, EMA, SMMA, WMA, VWMA).
Source: The price source for the Bollinger Bands calculation.
StdDev: The multiplier for the standard deviation.
RSI Settings
RSI Length: The number of periods for the RSI calculation.
RSI Upper: The upper threshold for the RSI.
RSI Lower: The lower threshold for the RSI.
Source: The price source for the RSI calculation.
MACD Settings
Fast Length: The length for the fast moving average.
Slow Length: The length for the slow moving average.
Signal Smoothing: The length for the signal line smoothing.
Oscillator MA Type: The type of moving average for the MACD calculation.
Signal Line MA Type: The type of moving average for the signal line.
Usage
This indicator is suitable for various trading strategies, including day trading, swing trading, and long-term investing.
Traders can use the MACD histogram to identify potential buy and sell signals, while the RSI can help confirm overbought or oversold conditions.
The Bollinger Bands provide context for price volatility and potential breakout or reversal points.
Example:
From the example, it can clearly see that the Selling Climax and Buying Climax, marked as orange circle when a black histogram occurs.
Conclusion
The MACD + RSI + Bollinger Bands Indicator is a versatile tool that combines multiple technical analysis methods to provide traders with a comprehensive view of market conditions. By utilizing this script, traders can enhance their analysis and improve their decision-making process.

Pivot Bollinger BandThis is a special kind of Bollinger Bands indicator that adapts to the market's pivot points. Instead of using regular price data, it first finds important swing highs and lows in the market (called pivot points). It then uses these pivot points to create a center line, which is like a moving average of where the market is pivoting.
Around this center line, it draws the classic Bollinger Bands - an upper and lower band that show where prices might find resistance or support. The distance between these bands changes based on market volatility, just like regular Bollinger Bands. You can adjust how sensitive it is to pivot points and how wide the bands should be.
By using pivot point based Bollinger Bands, we expect band breakout can be captured more effectively.

VIDYA ProTrend Multi-Tier ProfitHello! This time is about a trend-following system.
VIDYA is quite an interesting indicator that adjusts dynamically to market volatility, making it more responsive to price changes compared to traditional moving averages. Balancing adaptability and precision, especially with the more aggressive short trade settings, challenged me to fine-tune the strategy for a variety of market conditions.
█ Introduction and How it is Different
The "VIDYA ProTrend Multi-Tier Profit" strategy is a trend-following system that combines the VIDYA (Variable Index Dynamic Average) indicator with Bollinger Bands and a multi-step take-profit mechanism.
Unlike traditional trend strategies, this system allows for more adaptive profit-taking, adjusting for long and short positions through distinct ATR-based and percentage-based targets. The innovation lies in its dynamic multi-tier approach to profit-taking, especially for short trades, where more aggressive percentages are applied using a multiplier. This flexibility helps adapt to various market conditions by optimizing trade management and profit allocation based on market volatility and trend strength.
BTCUSD 6hr performance
█ Strategy, How it Works: Detailed Explanation
The core of the "VIDYA ProTrend Multi-Tier Profit" strategy lies in the dual VIDYA indicators (fast and slow) that analyze price trends while accounting for market volatility. These indicators work alongside Bollinger Bands to filter trade entries and exits.
🔶 VIDYA Calculation
The VIDYA indicator is calculated using the following formula:
Smoothing factor (𝛼):
alpha = 2 / (Length + 1)
VIDYA formula:
VIDYA(t) = alpha * k * Price(t) + (1 - alpha * k) * VIDYA(t-1)
Where:
k = |Chande Momentum Oscillator (MO)| / 100
🔶 Bollinger Bands as a Volatility Filter
Bollinger Bands are calculated using a rolling mean and standard deviation of price over a specified period:
Upper Band:
BB_upper = MA + (K * stddev)
Lower Band:
BB_lower = MA - (K * stddev)
Where:
MA is the moving average,
K is the multiplier (typically 2), and
stddev is the standard deviation of price over the Bollinger Bands length.
These bands serve as volatility filters to identify potential overbought or oversold conditions, aiding in the entry and exit logic.
🔶 Slope Calculation for VIDYA
The slopes of both fast and slow VIDYAs are computed to assess the momentum and direction of the trend. The slope for a given VIDYA over its length is:
Slope = (VIDYA(t) - VIDYA(t-n)) / n
Where:
n is the length of the lookback period. Positive slope indicates bullish momentum, while negative slope signals bearish momentum.
LOCAL picture
🔶 Entry and Exit Conditions
- Long Entry: Occurs when the price moves above the slow VIDYA and the fast VIDYA is trending upward. Bollinger Bands confirm the signal when the price crosses the upper band, indicating bullish strength.
- Short Entry: Happens when the price drops below the slow VIDYA and the fast VIDYA trends downward. The signal is confirmed when the price crosses the lower Bollinger Band, showing bearish momentum.
- Exit: Based on VIDYA slopes flattening or reversing, or when the price hits specific ATR or percentage-based profit targets.
🔶 Multi-Step Take Profit Mechanism
The strategy incorporates three levels of take profit for both long and short trades:
- ATR-based Take Profit: Each step applies a multiple of the ATR (Average True Range) to the entry price to define the exit point.
The first level of take profit (long):
TP_ATR1_long = Entry Price + (2.618 * ATR)
etc.
█ Trade Direction
The strategy offers flexibility in defining the trading direction:
- Long: Only long trades are considered based on the criteria for upward trends.
- Short: Only short trades are initiated in bearish trends.
- Both: The strategy can take both long and short trades depending on the market conditions.
█ Usage
To use the strategy effectively:
- Adjust the VIDYA lengths (fast and slow) based on your preference for trend sensitivity.
- Use Bollinger Bands as a filter for identifying potential breakout or reversal scenarios.
- Enable the multi-step take profit feature to manage positions dynamically, allowing for partial exits as the price reaches specified ATR or percentage levels.
- Leverage the short trade multiplier for more aggressive take profit levels in bearish markets.
This strategy can be applied to different asset classes, including equities, forex, and cryptocurrencies. Adjust the input parameters to suit the volatility and characteristics of the asset being traded.
█ Default Settings
The default settings for this strategy have been designed for moderate to trending markets:
- Fast VIDYA Length (10): A shorter length for quick responsiveness to price changes. Increasing this length will reduce noise but may delay signals.
- Slow VIDYA Length (30): The slow VIDYA is set longer to capture broader market trends. Shortening this value will make the system more reactive to smaller price swings.
- Minimum Slope Threshold (0.05): This threshold helps filter out weak trends. Lowering the threshold will result in more trades, while raising it will restrict trades to stronger trends.
Multi-Step Take Profit Settings
- ATR Multipliers (2.618, 5.0, 10.0): These values define how far the price should move before taking profit. Larger multipliers widen the profit-taking levels, aiming for larger trend moves. In higher volatility markets, these values might be adjusted downwards.
- Percentage Levels (3%, 8%, 17%): These percentage levels define how much the price must move before taking profit. Increasing the percentages will capture larger moves, while smaller percentages offer quicker exits.
- Short TP Multiplier (1.5): This multiplier applies more aggressive take profit levels for short trades. Adjust this value based on the aggressiveness of your short trade management.
Each of these settings directly impacts the performance and risk profile of the strategy. Shorter VIDYA lengths and lower slope thresholds will generate more trades but may result in more whipsaws. Higher ATR multipliers or percentage levels can delay profit-taking, aiming for larger trends but risking partial gains if the trend reverses too early.

Breakout & Distribution DetectorHow the Script Works:
1. Bollinger Bands:
• The upper and lower Bollinger Bands are used to detect volatility and potential breakouts. When the price closes above the upper band, it’s considered a bullish breakout. When the price closes below the lower band, it’s a bearish breakout.
2. RSI (Relative Strength Index):
• The RSI is used for momentum confirmation. A bullish breakout is confirmed if the RSI is above 50, and a bearish breakout is confirmed if the RSI is below 50.
• If the RSI enters overbought (above 70) or oversold (below 30) levels, it signals a distribution phase, indicating the market may be ready to reverse or consolidate.
3. Moving Average:
• A simple moving average (SMA) of 20 periods is used to ensure we’re trading in the direction of the trend. Breakouts above the upper Bollinger Band are valid if the price is above the SMA, while breakouts below the lower Bollinger Band are valid if the price is below the SMA.
4. Signals and Alerts:
• BUY Signal: A green “BUY” label appears below the candle if a bullish breakout is detected.
• SELL Signal: A red “SELL” label appears above the candle if a bearish breakout is detected.
• Distribution Phase: The background turns purple if the market enters a distribution phase (RSI in overbought or oversold territory).
• Alerts: You can set alerts based on these conditions to get notifications for breakouts or when the market enters a distribution phase.

The Bar Counter Trend Reversal Strategy [TradeDots]Overview
The Bar Counter Trend Reversal Strategy is designed to identify potential counter-trend reversal points in the market after a series of consecutive rising or falling bars.
By analyzing price movements in conjunction with optional volume confirmation and channel bands (Bollinger Bands or Keltner Channels), this strategy aims to detect overbought or oversold conditions where a trend reversal may occur.
🔹How it Works
Consecutive Price Movements
Rising Bars: The strategy detects when there are a specified number of consecutive rising bars (No. of Rises).
Falling Bars: Similarly, it identifies a specified number of consecutive falling bars (No. of Falls).
Volume Confirmation (Optional)
When enabled, the strategy checks for increasing volume during the consecutive price movements, adding an extra layer of confirmation to the potential reversal signal.
Channel Confirmation (Optional)
Channel Type: Choose between Bollinger Bands ("BB") or Keltner Channels ("KC").
Channel Interaction: The strategy checks if the price interacts with the upper or lower channel lines: For short signals, it looks for price moving above the upper channel line. For long signals, it looks for price moving below the lower channel line.
Customization:
No. of Rises/Falls: Set the number of consecutive bars required to trigger a signal.
Volume Confirmation: Enable or disable volume as a confirmation factor.
Channel Confirmation: Enable or disable channel bands as a confirmation factor.
Channel Settings: Adjust the length and multiplier for the Bollinger Bands or Keltner Channels.
Visual Indicators:
Entry Signals: Triangles plotted on the chart indicate potential entry points:
Green upward triangle for long entries.
Red downward triangle for short entries.
Channel Bands: The upper and lower bands are plotted for visual reference.
Strategy Parameters:
Initial Capital: $10,000.
Position Sizing: 80% of equity per trade.
Commission: 0.01% per trade to simulate realistic trading costs.
🔹Usage
Set up the number of Rises/Falls and choose whether if you want to use channel indicators and volume as the confirmation.
Monitor the chart for triangles indicating potential entry points.
Consider the context of the overall market trend and other technical factors.
Backtesting and Optimization:
Use TradingView's Strategy Tester to evaluate performance.
Adjust parameters to optimize results for different market conditions.
🔹 Considerations and Recommendations
Risk Management:
The strategy does not include built-in stop-loss or take-profit levels. It's recommended to implement your own risk management techniques.
Market Conditions:
Performance may vary in different market environments. Testing and adjustments are advised when applying the strategy to new instruments or timeframes.
No Guarantee of Future Results:
Past performance is not indicative of future results. Always perform due diligence and consider the risks involved in trading.

Theoretical price by volumeThis code is used to calculate a theoretical price range based on volume and price change and display it on the chart. Specifically, it calculates the “theoretical price volatility” based on price changes and volume, from which the upper and lower price limits are derived.
The price volatility is calculated by dividing the price change by the volume as the change unit volume.
Based on this volatility, we calculate the theoretical variation relative to the current price (“Theoretical Variance Difference”).
Based on the results, **Theoretical High Price (p_price) and Theoretical Low Price (m_price)** are calculated.
The chart displays the upper and lower bounds of these theoretical prices in color, and also calculates their mean and standard deviation (in the form of a Bollinger band) and plots them.
The background color on the chart indicates whether the price is within the theoretical price range, and at the same time, the mean and standard deviation of the theoretical prices are used to visualize price movements in more detail.
This indicator helps traders understand the impact of volume on price movements and helps them determine if prices are staying within the theoretical range or if there are unusual movements.

Bitcoin CME-Spot Z-Spread - Strategy [presentTrading]This time is a swing trading strategy! It measures the sentiment of the Bitcoin market through the spread of CME Bitcoin Futures and Bitfinex BTCUSD Spot prices. By applying Bollinger Bands to the spread, the strategy seeks to capture mean-reversion opportunities when prices deviate significantly from their historical norms
█ Introduction and How it is Different
The Bitcoin CME-Spot Bollinger Bands Strategy is designed to capture mean-reversion opportunities by exploiting the spread between CME Bitcoin Futures and Bitfinex BTCUSD Spot prices. The strategy uses Bollinger Bands to detect when the spread between these two correlated assets has deviated significantly from its historical norm, signaling potential overbought or oversold conditions.
What sets this strategy apart is its focus on spread trading between futures and spot markets rather than price-based indicators. By applying Bollinger Bands to the spread rather than individual prices, the strategy identifies price inefficiencies across markets, allowing traders to take advantage of the natural reversion to the mean that often occurs in these correlated assets.
BTCUSD 8hr Performance
█ Strategy, How It Works: Detailed Explanation
The strategy relies on Bollinger Bands to assess the volatility and relative deviation of the spread between CME Bitcoin Futures and Bitfinex BTCUSD Spot prices. Bollinger Bands consist of a moving average and two standard deviation bands, which help measure how much the spread deviates from its historical mean.
🔶 Spread Calculation:
The spread is calculated by subtracting the Bitfinex spot price from the CME Bitcoin futures price:
Spread = CME Price - Bitfinex Price
This spread represents the difference between the futures and spot markets, which may widen or narrow based on supply and demand dynamics in each market. By analyzing the spread, the strategy can detect when prices are too far apart (potentially overbought or oversold), indicating a trading opportunity.
🔶 Bollinger Bands Calculation:
The Bollinger Bands for the spread are calculated using a simple moving average (SMA) and the standard deviation of the spread over a defined period.
1. Moving Average (SMA):
The simple moving average of the spread (mu_S) over a specified period P is calculated as:
mu_S = (1/P) * sum(S_i from i=1 to P)
Where S_i represents the spread at time i, and P is the lookback period (default is 200 bars). The moving average provides a baseline for the normal spread behavior.
2. Standard Deviation:
The standard deviation (sigma_S) of the spread is calculated to measure the volatility of the spread:
sigma_S = sqrt((1/P) * sum((S_i - mu_S)^2 from i=1 to P))
3. Upper and Lower Bollinger Bands:
The upper and lower Bollinger Bands are derived by adding and subtracting a multiple of the standard deviation from the moving average. The number of standard deviations is determined by a user-defined parameter k (default is 2.618).
- Upper Band:
Upper Band = mu_S + (k * sigma_S)
- Lower Band:
Lower Band = mu_S - (k * sigma_S)
These bands provide a dynamic range within which the spread typically fluctuates. When the spread moves outside of these bands, it is considered overbought or oversold, potentially offering trading opportunities.
Local view
🔶 Entry Conditions:
- Long Entry: A long position is triggered when the spread crosses below the lower Bollinger Band, indicating that the spread has become oversold and is likely to revert upward.
Spread < Lower Band
- Short Entry: A short position is triggered when the spread crosses above the upper Bollinger Band, indicating that the spread has become overbought and is likely to revert downward.
Spread > Upper Band
🔶 Risk Management and Profit-Taking:
The strategy incorporates multi-step take profits to lock in gains as the trade moves in favor. The position is gradually reduced at predefined profit levels, reducing risk while allowing part of the trade to continue running if the price keeps moving favorably.
Additionally, the strategy uses a hold period exit mechanism. If the trade does not hit any of the take-profit levels within a certain number of bars, the position is closed automatically to avoid excessive exposure to market risks.
█ Trade Direction
The trade direction is based on deviations of the spread from its historical norm:
- Long Trade: The strategy enters a long position when the spread crosses below the lower Bollinger Band, signaling an oversold condition where the spread is expected to narrow.
- Short Trade: The strategy enters a short position when the spread crosses above the upper Bollinger Band, signaling an overbought condition where the spread is expected to widen.
These entries rely on the assumption of mean reversion, where extreme deviations from the average spread are likely to revert over time.
█ Usage
The Bitcoin CME-Spot Bollinger Bands Strategy is ideal for traders looking to capitalize on price inefficiencies between Bitcoin futures and spot markets. It’s especially useful in volatile markets where large deviations between futures and spot prices occur.
- Market Conditions: This strategy is most effective in correlated markets, like CME futures and spot Bitcoin. Traders can adjust the Bollinger Bands period and standard deviation multiplier to suit different volatility regimes.
- Backtesting: Before deployment, backtesting the strategy across different market conditions and timeframes is recommended to ensure robustness. Adjust the take-profit steps and hold periods to reflect the trader’s risk tolerance and market behavior.
█ Default Settings
The default settings provide a balanced approach to spread trading using Bollinger Bands but can be adjusted depending on market conditions or personal trading preferences.
🔶 Bollinger Bands Period (200 bars):
This defines the number of bars used to calculate the moving average and standard deviation for the Bollinger Bands. A longer period smooths out short-term fluctuations and focuses on larger, more significant trends. Adjusting the period affects the responsiveness of the strategy:
- Shorter periods (e.g., 100 bars): Makes the strategy more reactive to short-term market fluctuations, potentially generating more signals but increasing the risk of false positives.
- Longer periods (e.g., 300 bars): Focuses on longer-term trends, reducing the frequency of trades and focusing only on significant deviations.
🔶 Standard Deviation Multiplier (2.618):
The multiplier controls how wide the Bollinger Bands are around the moving average. By default, the bands are set at 2.618 standard deviations away from the average, ensuring that only significant deviations trigger trades.
- Higher multipliers (e.g., 3.0): Require a more extreme deviation to trigger trades, reducing trade frequency but potentially increasing the accuracy of signals.
- Lower multipliers (e.g., 2.0): Make the bands narrower, increasing the number of trade signals but potentially decreasing their reliability.
🔶 Take-Profit Levels:
The strategy has four take-profit levels to gradually lock in profits:
- Level 1 (3%): 25% of the position is closed at a 3% profit.
- Level 2 (8%): 20% of the position is closed at an 8% profit.
- Level 3 (14%): 15% of the position is closed at a 14% profit.
- Level 4 (21%): 10% of the position is closed at a 21% profit.
Adjusting these take-profit levels affects how quickly profits are realized:
- Lower take-profit levels: Capture gains more quickly, reducing risk but potentially cutting off larger profits.
- Higher take-profit levels: Let trades run longer, aiming for bigger gains but increasing the risk of price reversals before profits are locked in.
🔶 Hold Days (20 bars):
The strategy automatically closes the position after 20 bars if none of the take-profit levels are hit. This feature prevents trades from being held indefinitely, especially if market conditions are stagnant. Adjusting this:
- Shorter hold periods: Reduce the duration of exposure, minimizing risks from market changes but potentially closing trades too early.
- Longer hold periods: Allow trades to stay open longer, increasing the chance for mean reversion but also increasing exposure to unfavorable market conditions.
By understanding how these default settings affect the strategy’s performance, traders can optimize the Bitcoin CME-Spot Bollinger Bands Strategy to their preferences, adapting it to different market environments and risk tolerances.

Uptrick: Market MoodsThe "Uptrick: Market Moods" indicator is an advanced technical analysis tool designed for the TradingView platform. It combines three powerful indicators—Relative Strength Index (RSI), Average True Range (ATR), and Bollinger Bands—into one cohesive framework, aimed at helping traders better understand and interpret market sentiment. By capturing shifts in the emotional climate of the market, it provides a holistic view of market conditions, which can range from calm to stressed or even highly excited. This multi-dimensional analysis tool stands apart from traditional single-indicator approaches by offering a more complete picture of market dynamics, making it a valuable resource for traders looking to anticipate and react to changes in market behavior.
The RSI in the "Uptrick: Market Moods" indicator is used to measure momentum. RSI is an essential component of many technical analysis strategies, and in this tool, it is used to identify potential market extremes. When RSI values are high, they indicate an overbought condition, meaning the market may be approaching a peak. Conversely, low RSI values suggest an oversold condition, signaling that the market could be nearing a bottom. These extremes provide crucial clues about shifts in market sentiment, helping traders gauge whether the current emotional state of the market is likely to result in a reversal. This understanding is pivotal in predicting whether the market is transitioning from calm to stressed or from excited to overbought.
The Average True Range adds another layer to this analysis by offering insights into market volatility. Volatility is a key factor in understanding the mood of the market, as periods of high volatility often reflect high levels of excitement or stress, while low volatility typically indicates a calm, steady market. ATR is calculated based on the range of price movements over a given period, and the higher the value, the more volatile the market is. The "Uptrick: Market Moods" indicator uses ATR to dynamically gauge volatility levels, helping traders understand whether the market is currently moving in a way that aligns with its emotional mood. For example, an increase in ATR accompanied by an RSI value that indicates overbought conditions could suggest that the market is in a highly excited state, with the potential for either strong momentum continuation or a sharp reversal.
Bollinger Bands complement these tools by providing visual cues about price volatility and the range within which the market is likely to move. Bollinger Bands plot two standard deviations away from a simple moving average of the price. This banding technique helps traders visualize how far the price is likely to deviate from its average over a certain period. The "Uptrick: Market Moods" indicator uses Bollinger Bands to establish price boundaries and identify breakout conditions. When prices break above the upper band or below the lower band, it often signals that the market is either highly stressed or excited. This breakout condition serves as a visual representation of the market mood, alerting traders to moments when prices are moving beyond typical ranges and when significant emotional shifts are occurring in the market.
Technically, the "Uptrick: Market Moods" indicator has been developed using TradingView’s Pine Script language, a highly efficient language for building custom indicators. It employs functions like ta.rsi, ta.atr, and ta.sma to perform the necessary calculations. The use of these built-in functions ensures that the calculations are both accurate and efficient, allowing the indicator to operate in real-time without lagging, even in volatile market conditions. The ta.rsi function is used to compute the Relative Strength Index, while ta.atr calculates the Average True Range, and ta.sma is used to smooth out price data for the Bollinger Bands. These functions are applied dynamically within the script, allowing the "Uptrick: Market Moods" indicator to respond to changes in market conditions in real time.
The user interface of the "Uptrick: Market Moods" indicator is designed to provide a visually intuitive experience. The market mood is color-coded on the chart, making it easy for traders to identify whether the market is calm, stressed, or excited at a glance. This feature is especially useful for traders who need to make quick decisions in fast-moving markets. Additionally, the indicator includes an interactive table that updates in real-time, showing the most recent mood state and its frequency. This provides valuable statistical insights into market behavior over specific time frames, helping traders track the dominant emotional state of the market. Whether the market is in a prolonged calm state or rapidly transitioning through moods, this real-time feedback offers actionable data that can help traders adjust their strategies accordingly.
The RSI component of the "Uptrick: Market Moods" indicator helps detect the speed and direction of price movements, offering insight into whether the market is approaching extreme conditions. By providing signals based on overbought and oversold levels, the RSI helps traders decide whether to enter or exit positions. The ATR element acts as a volatility gauge, dynamically adjusting traders’ expectations in response to changes in market volatility. Meanwhile, the Bollinger Bands help identify trends and potential breakout conditions, serving as an additional confirmation tool that highlights when the price has moved beyond normal boundaries, indicating heightened market excitement or stress.
Despite the robust capabilities of the "Uptrick: Market Moods" indicator, it does have limitations. In markets affected by sudden shifts, such as those driven by major news events or external economic factors, the indicator’s performance may not always be reliable. These external factors can cause rapid mood swings that are difficult for any technical analysis tool to fully anticipate. Additionally, the indicator’s complexity may pose a learning curve for novice traders, particularly those who are unfamiliar with the concepts of RSI, ATR, and Bollinger Bands. However, with practice, traders can become proficient in using the tool to its full potential, leveraging the insights it provides to better navigate market shifts.
For traders seeking a deeper understanding of market sentiment, the "Uptrick: Market Moods" indicator is an invaluable resource. It is recommended for those dealing with medium to high volatility instruments, where understanding emotional shifts can offer a strategic advantage. While it can be used on its own, integrating it with other forms of analysis, such as fundamental analysis and additional technical indicators, can enhance its effectiveness. By confirming signals with other tools, traders can reduce the likelihood of false signals and improve their overall trading strategy.
To further enhance the accuracy of the "Uptrick: Market Moods" indicator, it can be integrated with volume-based tools like Volume Profile or On-Balance Volume (OBV). This combination allows traders to confirm the moods identified by the indicator with volume data, providing additional confirmation of market sentiment. For example, when the market is in an excited mood, an increase in trading volume could reinforce the reliability of that signal. Conversely, if the market is stressed but volume remains low, traders may want to proceed with caution. Using multiple indicators together creates a more comprehensive trading approach, helping traders better manage risk and make informed decisions based on multiple data points.
In conclusion, the "Uptrick: Market Moods" indicator is a powerful and unique addition to the suite of technical analysis tools available on TradingView. It provides traders with a multi-dimensional view of market sentiment by combining the analytical strengths of RSI, ATR, and Bollinger Bands into a single tool. Its ability to capture and interpret the emotional mood of the market makes it an essential tool for traders seeking to gain an edge in understanding market behavior. While the indicator has certain limitations, particularly in rapidly shifting markets, its ability to provide real-time insights into market sentiment is a valuable asset for traders of all experience levels. Used in conjunction with other tools and sound trading practices, the "Uptrick: Market Moods" indicator offers a comprehensive solution for navigating the complexities of financial markets.

Options Series - Explode BB⭐ Bullish Zone:
⭐ Bearish Zone:
⭐ Neutral Zone:
The provided script integrates Bollinger Bands with different lengths (20 and 200 periods) and applies customized candle coloring based on certain conditions. Here's a breakdown of its importance and insights:
⭐ 1. Dual Bollinger Bands (BBs):
Bollinger Bands (BB) with 20-period length:
This is the standard setting for Bollinger Bands, with a 20-period simple moving average (SMA) as the central line and upper/lower bands derived from the standard deviation.
These bands are used to identify volatility. Wider bands indicate higher volatility, while narrower bands indicate low volatility.
200-period BB:
This is a longer-term indicator providing insight into the overall trend and long-term volatility.
The 200-period bands filter out noise and offer a "macro" view of price movements compared to the 20-period bands, which focus on short-term price actions.
⭐ 2. Overlay of Bollinger Bands and SMA:
The script plots the Bollinger Bands along with the SMA (Simple Moving Average) of the 200-period BB. This gives traders both a short-term (20-period) and long-term (200-period) perspective, which is valuable for detecting major trend shifts or key support and resistance zones.
Using multiple time frames (20-period for short-term and 200-period for long-term) can help traders spot both immediate opportunities and overarching trends.
⭐ 3. Candle Coloring Based on Key Conditions:
Bullish Signal (GreenFluroscent): When the price closes above the upper 200-period Bollinger Band, the candle turns green, indicating a potential bullish breakout.
Bearish Signal (RedFluroscent): If the price closes below the lower 200-period Bollinger Band, the candle turns red, suggesting a bearish breakout.
Neutral or Uncertain Market: Candles are gray when the price remains between the upper and lower bands, indicating a lack of a strong directional bias.
This color-coded visualization allows traders to quickly assess market sentiment based on the Bollinger Bands' extremes.
⭐ 4. Strategic Importance of the Setup:
Multi-timeframe Analysis: Combining short-term (20-period) and long-term (200-period) Bollinger Bands enables traders to assess the market's overall volatility and trend strength. The longer-term bands act as a reference for broader trend direction, while the shorter-term bands can signal shorter-term pullbacks or entry/exit points.
Breakout Identification: By color-coding the candles when prices cross either the upper or lower 200-period bands, the script makes it easier to spot potential breakouts. This can be particularly helpful in trading strategies that rely on volatility expansions or trend-following tactics.
⭐ 5. Customization and Flexibility:
Custom Colors: The script uses distinct fluorescent green and red colors to highlight key bullish and bearish conditions, providing clear visual cues.
Simplicity with Flexibility: Despite its simplicity, the script leaves room for customization, allowing traders to adjust the Bollinger Band multipliers or apply different conditions to candle coloring for more nuanced setups.
This script enhances standard Bollinger Band usage by introducing multi-timeframe analysis, breakout signals, and visual cues for trend strength, making it a powerful tool for both trend-following and mean-reversion strategies.
🚀 Conclusion:
This script effectively simplifies volatility analysis by visually marking bullish, bearish, and neutral zones, making it a robust tool for identifying trade opportunities across multiple timeframes. Its dual-band approach ensures both trend-following and mean-reversion strategies are supported.

Bollinger Bands ForLoopBollinger Bands ForLoop
OVERVIEW
BB ForLoop is an improved version of Bollinger Bands it is designed to calculate an array of values 1 or -1 depending if soruce for calculations is above or below basis.
It takes avereage of values over a range of lengths, providing trend signals smothed based on various moving averages in order to get rid of noise.
It offers flexibility with different signal modes and visual customizations.
TYPE OF SIGNALS
-FAST (MA > MA or MA > 0.99)
-SLOW (MA > 0)
-THRESHOLD CROSSING (when cross above/below treshold set independently for both directions)
-FAST THRESHOLD (when there's change in signal by set margin e.g (0.4 -> 0.2) means bearsih when FT is set to 0.1, when MA is > 0.99 it will signal bullish, when MA < -0.99 it will signal bearish)
Generaly Lime color of line indicates Bullish, Fuchsia indicates Bearish.
This colors are not set in stone so you can change them in settings.
-Bullish Trend, line color is lime
-Bearish Trend, line color is fuchsia
Credit
Idea for this script was from one of indicators created by www.tradingview.com
Warning
Be careful when using this indicator especialy combining DEMA with FT (Fast Treshold).
This indicator can be really noisy depending on the settings, signal mode so it should be used preferably as a part of an strategy not as a stand alone indicator
Remember the lower the timeframe you use the more noise there is.
No single indicator should be used alone when making investment decisions.

Sinc Bollinger BandsKaiser Windowed Sinc Bollinger Bands Indicator
The Kaiser Windowed Sinc Bollinger Bands indicator combines the advanced filtering capabilities of the Kaiser Windowed Sinc Moving Average with the volatility measurement of Bollinger Bands. This indicator represents a sophisticated approach to trend identification and volatility analysis in financial markets.
Core Components
At the heart of this indicator is the Kaiser Windowed Sinc Moving Average, which utilizes the sinc function as an ideal low-pass filter, windowed by the Kaiser function. This combination allows for precise control over the frequency response of the moving average, effectively separating trend from noise in price data.
The sinc function, representing an ideal low-pass filter, provides the foundation for the moving average calculation. By using the sinc function, analysts can independently control two critical parameters: the cutoff frequency and the number of samples used. The cutoff frequency determines which price movements are considered significant (low frequency) and which are treated as noise (high frequency). The number of samples influences the filter's accuracy and steepness, allowing for a more precise approximation of the ideal low-pass filter without altering its fundamental frequency response characteristics.
The Kaiser window is applied to the sinc function to create a practical, finite-length filter while minimizing unwanted oscillations in the frequency domain. The alpha parameter of the Kaiser window allows users to fine-tune the trade-off between the main-lobe width and side-lobe levels in the frequency response.
Bollinger Bands Implementation
Building upon the Kaiser Windowed Sinc Moving Average, this indicator adds Bollinger Bands to provide a measure of price volatility. The bands are calculated by adding and subtracting a multiple of the standard deviation from the moving average.
Advanced Centered Standard Deviation Calculation
A unique feature of this indicator is its specialized standard deviation calculation for the centered mode. This method employs the Kaiser window to create a smooth deviation that serves as an highly effective envelope, even though it's always based on past data.
The centered standard deviation calculation works as follows:
It determines the effective sample size of the Kaiser window.
The window size is then adjusted to reflect the target sample size.
The source data is offset in the calculation to allow for proper centering.
This approach results in a highly accurate and smooth volatility estimation. The centered standard deviation provides a more refined and responsive measure of price volatility compared to traditional methods, particularly useful for historical analysis and backtesting.
Operational Modes
The indicator offers two operational modes:
Non-Centered (Real-time) Mode: Uses half of the windowed sinc function and a traditional standard deviation calculation. This mode is suitable for real-time analysis and current market conditions.
Centered Mode: Utilizes the full windowed sinc function and the specialized Kaiser window-based standard deviation calculation. While this mode introduces a delay, it offers the most accurate trend and volatility identification for historical analysis.
Customizable Parameters
The Kaiser Windowed Sinc Bollinger Bands indicator provides several key parameters for customization:
Cutoff: Controls the filter's cutoff frequency, determining the divide between trends and noise.
Number of Samples: Sets the number of samples used in the FIR filter calculation, affecting the filter's accuracy and computational complexity.
Alpha: Influences the shape of the Kaiser window, allowing for fine-tuning of the filter's frequency response characteristics.
Standard Deviation Length: Determines the period over which volatility is calculated.
Multiplier: Sets the number of standard deviations used for the Bollinger Bands.
Centered Alpha: Specific to the centered mode, this parameter affects the Kaiser window used in the specialized standard deviation calculation.
Visualization Features
To enhance the analytical value of the indicator, several visualization options are included:
Gradient Coloring: Offers a range of color schemes to represent trend direction and strength for the moving average line.
Glow Effect: An optional visual enhancement for improved line visibility.
Background Fill: Highlights the area between the Bollinger Bands, aiding in volatility visualization.
Applications in Technical Analysis
The Kaiser Windowed Sinc Bollinger Bands indicator is particularly useful for:
Precise trend identification with reduced noise influence
Advanced volatility analysis, especially in the centered mode
Identifying potential overbought and oversold conditions
Recognizing periods of price consolidation and potential breakouts
Compared to traditional Bollinger Bands, this indicator offers superior frequency response characteristics in its moving average and a more refined volatility measurement, especially in centered mode. These features allow for a more nuanced analysis of price trends and volatility patterns across various market conditions and timeframes.
Conclusion
The Kaiser Windowed Sinc Bollinger Bands indicator represents a significant advancement in technical analysis tools. By combining the ideal low-pass filter characteristics of the sinc function, the practical benefits of Kaiser windowing, and an innovative approach to volatility measurement, this indicator provides traders and analysts with a sophisticated instrument for examining price trends and market volatility.
Its implementation in Pine Script contributes to the TradingView community by making advanced signal processing and statistical techniques accessible for experimentation and further development in technical analysis. This indicator serves not only as a practical tool for market analysis but also as an educational resource for those interested in the intersection of signal processing, statistics, and financial markets.
Related:

Bollinger Bands Enhanced StrategyOverview
The common practice of using Bollinger bands is to use it for building mean reversion or squeeze momentum strategies. In the current script Bollinger Bands Enhanced Strategy we are trying to combine the strengths of both strategies types. It utilizes Bollinger Bands indicator to buy the local dip and activates trailing profit system after reaching the user given number of Average True Ranges (ATR). Also it uses 200 period EMA to filter trades only in the direction of a trend. Strategy can execute only long trades.
Unique Features
Trailing Profit System: Strategy uses user given number of ATR to activate trailing take profit. If price has already reached the trailing profit activation level, scrip will close long trade if price closes below Bollinger Bands middle line.
Configurable Trading Periods: Users can tailor the strategy to specific market windows, adapting to different market conditions.
Major Trend Filter: Strategy utilizes 100 period EMA to take trades only in the direction of a trend.
Flexible Risk Management: Users can choose number of ATR as a stop loss (by default = 1.75) for trades. This is flexible approach because ATR is recalculated on every candle, therefore stop-loss readjusted to the current volatility.
Methodology
First of all, script checks if currently price is above the 200-period exponential moving average EMA. EMA is used to establish the current trend. Script will take long trades on if this filtering system showing us the uptrend. Then the strategy executes the long trade if candle’s low below the lower Bollinger band. To calculate the middle Bollinger line, we use the standard 20-period simple moving average (SMA), lower band is calculated by the substruction from middle line the standard deviation multiplied by user given value (by default = 2).
When long trade executed, script places stop-loss at the price level below the entry price by user defined number of ATR (by default = 1.75). This stop-loss level recalculates at every candle while trade is open according to the current candle ATR value. Also strategy set the trailing profit activation level at the price above the position average price by user given number of ATR (by default = 2.25). It is also recalculated every candle according to ATR value. When price hit this level script plotted the triangle with the label “Strong Uptrend” and start trail the price at the middle Bollinger line. It also started to be plotted as a green line.
When price close below this trailing level script closes the long trade and search for the next trade opportunity.
Risk Management
The strategy employs a combined and flexible approach to risk management:
It allows positions to ride the trend as long as the price continues to move favorably, aiming to capture significant price movements. It features a user-defined ATR stop loss parameter to mitigate risks based on individual risk tolerance. By default, this stop-loss is set to a 1.75*ATR drop from the entry point, but it can be adjusted according to the trader's preferences.
There is no fixed take profit, but strategy allows user to define user the ATR trailing profit activation parameter. By default, this stop-loss is set to a 2.25*ATR growth from the entry point, but it can be adjusted according to the trader's preferences.
Justification of Methodology
This strategy leverages Bollinger bangs indicator to open long trades in the local dips. If price reached the lower band there is a high probability of bounce. Here is an issue: during the strong downtrend price can constantly goes down without any significant correction. That’s why we decided to use 200-period EMA as a trend filter to increase the probability of opening long trades during major uptrend only.
Usually, Bollinger Bands indicator is using for mean reversion or breakout strategies. Both of them have the disadvantages. The mean reversion buys the dip, but closes on the return to some mean value. Therefore, it usually misses the major trend moves. The breakout strategies usually have the issue with too high buy price because to have the breakout confirmation price shall break some price level. Therefore, in such strategies traders need to set the large stop-loss, which decreases potential reward to risk ratio.
In this strategy we are trying to combine the best features of both types of strategies. Script utilizes ate ATR to setup the stop-loss and trailing profit activation levels. ATR takes into account the current volatility. Therefore, when we setup stop-loss with the user-given number of ATR we increase the probability to decrease the number of false stop outs. The trailing profit concept is trying to add the beat feature from breakout strategies and increase probability to stay in trade while uptrend is developing. When price hit the trailing profit activation level, script started to trail the price with middle line if Bollinger bands indicator. Only when candle closes below the middle line script closes the long trade.
Backtest Results
Operating window: Date range of backtests is 2020.10.01 - 2024.07.01. It is chosen to let the strategy to close all opened positions.
Commission and Slippage: Includes a standard Binance commission of 0.1% and accounts for possible slippage over 5 ticks.
Initial capital: 10000 USDT
Percent of capital used in every trade: 30%
Maximum Single Position Loss: -9.78%
Maximum Single Profit: +25.62%
Net Profit: +6778.11 USDT (+67.78%)
Total Trades: 111 (48.65% win rate)
Profit Factor: 2.065
Maximum Accumulated Loss: 853.56 USDT (-6.60%)
Average Profit per Trade: 61.06 USDT (+1.62%)
Average Trade Duration: 76 hours
These results are obtained with realistic parameters representing trading conditions observed at major exchanges such as Binance and with realistic trading portfolio usage parameters.
How to Use
Add the script to favorites for easy access.
Apply to the desired timeframe and chart (optimal performance observed on 4h BTC/USDT).
Configure settings using the dropdown choice list in the built-in menu.
Set up alerts to automate strategy positions through web hook with the text: {{strategy.order.alert_message}}
Disclaimer:
Educational and informational tool reflecting Skyrex commitment to informed trading. Past performance does not guarantee future results. Test strategies in a simulated environment before live implementation
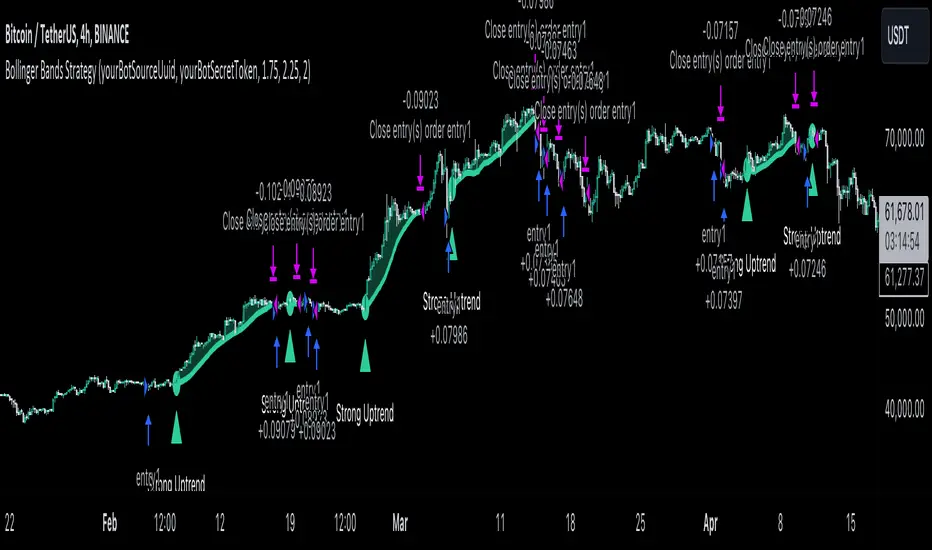
Chieu - Bollinger Bands SMA 50 StrategyOverview
The Custom Bollinger Bands Indicator is a versatile tool designed to help traders identify potential market reversals and optimize their trading strategies. This indicator combines Bollinger Bands with an ATR-based stop-loss mechanism, configurable take-profit levels, and dynamic position sizing to manage risk effectively. By highlighting key market conditions and providing clear visual cues, it enables traders to make informed decisions and execute trades with precision.
Key Features
Bollinger Bands Calculation:
The indicator calculates Bollinger Bands based on a configurable Simple Moving Average (SMA) length.
Standard deviation multiplier is adjustable, allowing traders to fine-tune the width of the bands.
Candlestick Highlighting:
Candles that touch the upper or lower Bollinger Bands are highlighted, indicating potential overbought or oversold conditions.
Reversal candles are identified and highlighted based on specific criteria:
The candle must touch the Bollinger Bands for two consecutive periods.
The reversal candle must have a body at least twice the size of the previous candle's body.
The reversal candle must close in the opposite direction to the previous candle (e.g., a bullish candle following a bearish one).
Stop-Loss and Take-Profit Levels:
Stop-loss levels are calculated using the ATR (Average True Range) indicator, ensuring they are dynamically adjusted based on market volatility.
Two configurable take-profit levels (1R and 2R) are plotted based on the initial risk (distance between entry and stop-loss).
Take-profit and stop-loss lines are visually represented on the chart for easy reference.
Position Sizing and Risk Management:
The indicator includes configurable inputs for account balance, leverage, and risk percentage.
It calculates the nominal value (position size without leverage) and cost value (position size with leverage) based on the specified risk parameters.
Combined labels display SL, TP, nominal value, and cost value, replacing the default "Reversal" text for clear, concise information.
Customization Options:
Users can configure the length of the take-profit lines.
The option to toggle the highlighting of candles touching the Bollinger Bands on or off, while always highlighting the identified reversal candles.
How to Use
Configuration:
Set the desired SMA length and Bollinger Bands multiplier in the input settings.
Configure the ATR length for accurate stop-loss calculations.
Adjust the risk-reward ratio and take-profit line length according to your trading strategy.
Specify your account balance, leverage, and risk percentage for precise position sizing.
Chart Analysis:
Monitor the chart for candles touching the upper or lower Bollinger Bands. These highlights indicate potential overbought or oversold conditions.
Look for highlighted reversal candles, which meet the specified criteria and suggest a potential market reversal.
Use the plotted stop-loss and take-profit lines to manage your trades effectively. The combined labels provide all necessary information (SL, TP, nominal value, and cost value) for quick decision-making.
Execution and Risk Management:
Enter trades based on the reversal candle signals.
Set your stop-loss at the indicated level using the ATR calculation.
Take partial profits at the first take-profit level (1R) and adjust your stop-loss to the entry point to secure the remaining position.
Exit the trade entirely at the second take-profit level (2R) or if the price returns to the adjusted stop-loss level.
