Arbitrage Synthetic Spread Chart v2Powerful tool for analyzing market divergences and identifying arbitrage opportunities! It creates a synthetic spread chart between two assets, displaying it in a clear format and helping traders spot moments of maximum decorrelation.
How does it work?
The indicator takes the closing prices of two assets and calculates their difference (spread):
spread = price1 - price2
Then, it constructs a price channel based on the highest and lowest values of the spread over a given period:
-Upper boundary: The highest spread value over the period
- Lower boundary: The lowest spread value over the period
- Middle line: The average of the upper and lower boundaries
Additionally, the indicator calculates the **correlation** between the two assets, helping traders assess their relationship strength.
How to use it?
When the spread reaches the channel boundaries, it may indicate an abnormal divergence between the assets. This serves as a signal for arbitrage trading:
✅ At the upper boundary: Sell Asset 1 and buy Asset 2
✅ At the lower boundary: Buy Asset 1 and sell Asset 2
Arbitrage_bands

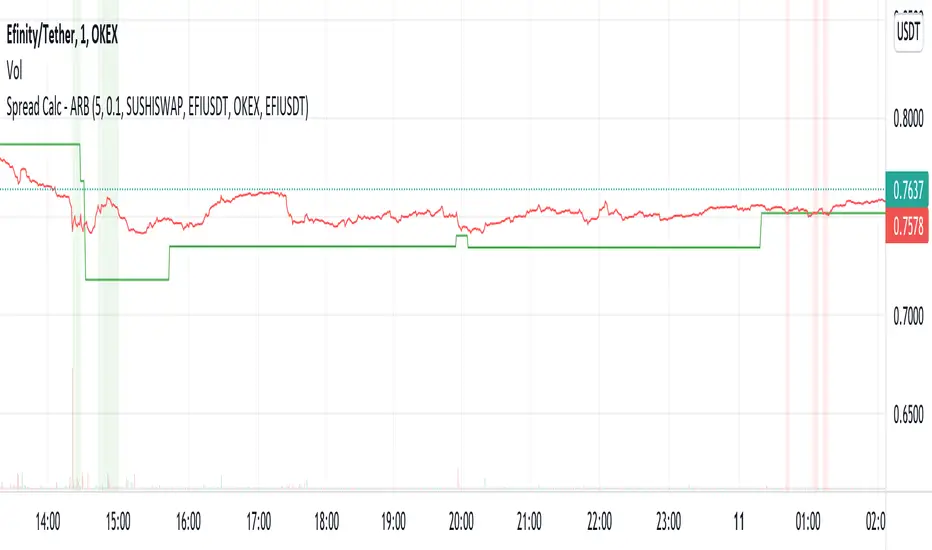
Spread Calc - ARBThis script allows the user to input 2 coins (same coin but on different exchanges), and the 2 exchanges (different ones). With this, the user can visualize the spread between the coins chosen by a percentage and a signal of when the coins return to a similar price. All decisions are your own, use this script as you wish. Thanks!
TSB 1.0Introducing Arbitrage TSB - Tops / Sideways / Bottoms
One of the hardest judgement calls to make in our opinion is determining when a stock is topping or just taking a breather ( moving sideways) before the next leg up or down.
This is where Arbitrage TSB coming in!
We clearly show when a stock is moving sideways at a top in a neutral position or at a bottom.
No more guessing, no more missing the trend or the next leg up or down.
Simply select your preferred frequency to trade within the system and win!
Happy Trading!
ArbitrageTrade Team
OmegaWhile others Seek Alpha, we seek Omega™
Market tops and Bottoms on any time frame and at your fingertips
Leave Nothing On The Table
Stop Guessing - Start Profiting - Stop Watching - Start Living
Enjoy,
Arbitrage Trade Team

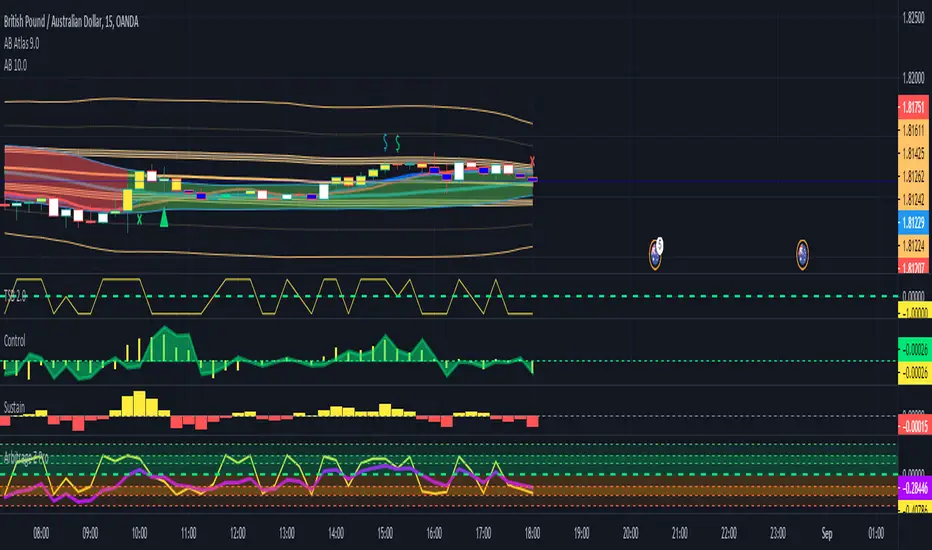
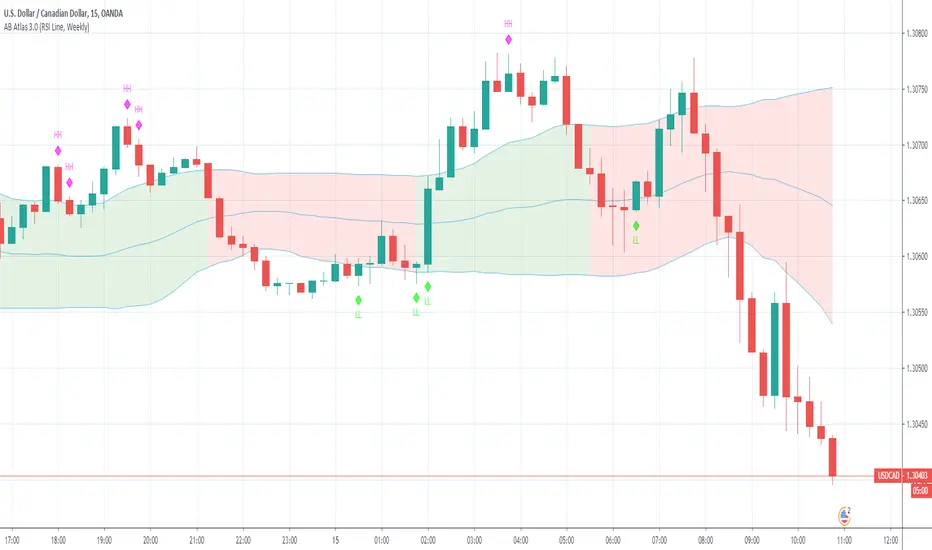
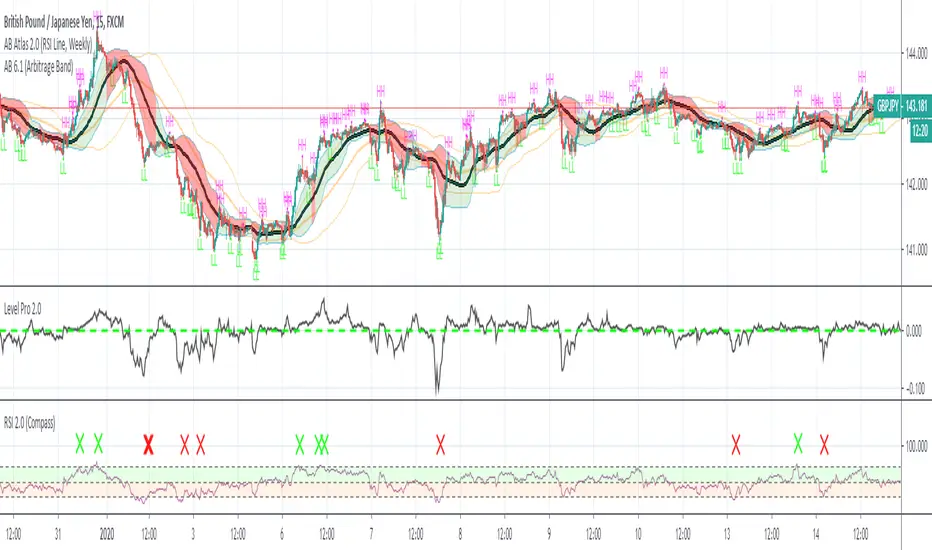
AB Atlas
Arbitrage Band Indicators - Included In The Indicator
Recent Higher High - Yellow Circle
Longer Term Higher High - Black Circle (Above Candle) (with Alerts)
Longer Term Lower Low - Black Circle (Below Candle) (with Alerts)
Buy Trend Exhausted - Red Circles ( Above Candles)
Sell Trend Exhausted - Green Circles ( Below Candles)
Tick colors have been added to the Bands to eliminate any question of the type of trend that is currently in progress
Red Atlas Band - Sell trend in progress
Green Atlas Band Buy Trend in progress
Enjoy,
Arbitrage Trade
Arbitrage Level (Pro)Introducing Arbitrage Level Pro
Since trading is 50% momentum and 50% direction we would like to get you as close as possible to both.
Just like the simple version of the Arbitrage level which acts like a carpentry level.
We are monitoring and have included ALERTS to inform you of when the momentum and direction have changed
So that you CAN KEEP all of the profit.
It's really easy to configure just select which indicator you would like to watch and let the indicator send you Alerts
when those conditions are true.
Enjoy,
Arbitrage Trade Team

Arbitrage RSICombining the power of Arbitrage Exits formula and The Relative Strength Index we can show on the chart when is the best to exit long and short trades by placing a red X to exit long or a green X to exit short positions
As well as alert on it to further tie in with our automation provided through the Autoview plugin for chrome.
Never give back profits again!
Arbitrage Bands 2.13
8 new alerts added:
Short Entry
Long Entry
Short Continuation (Long Exit)
Long Continuation (Short Exit)
Minor Cross Up
Minor Cross Down
Major Cross Up
Major Cross Down
These new alerts should help you keep a better eye on your money as each stock travels through the 12 phases of Arbitrage.
Enjoy
Arbitrage Trade Team

Arbitrage MACD/CCIArbitrage MACD/CCI
It's always important to know where to expect floors and ceilings in a trade.
If you're already using Arbitrage Bands, this is a great tool to help you see who is winning the fight when those pesky candles turn white and the stock is trading sideways.
If the navy line is on top a down trend is winning the fight!
If the orange line is on top an up trend is winning the fight!
Happy Trading From Arbitrage Trade Analytics!
