Arbitrage Synthetic Spread Chart v2Powerful tool for analyzing market divergences and identifying arbitrage opportunities! It creates a synthetic spread chart between two assets, displaying it in a clear format and helping traders spot moments of maximum decorrelation.
How does it work?
The indicator takes the closing prices of two assets and calculates their difference (spread):
spread = price1 - price2
Then, it constructs a price channel based on the highest and lowest values of the spread over a given period:
-Upper boundary: The highest spread value over the period
- Lower boundary: The lowest spread value over the period
- Middle line: The average of the upper and lower boundaries
Additionally, the indicator calculates the **correlation** between the two assets, helping traders assess their relationship strength.
How to use it?
When the spread reaches the channel boundaries, it may indicate an abnormal divergence between the assets. This serves as a signal for arbitrage trading:
✅ At the upper boundary: Sell Asset 1 and buy Asset 2
✅ At the lower boundary: Buy Asset 1 and sell Asset 2
Arbitrage_bands

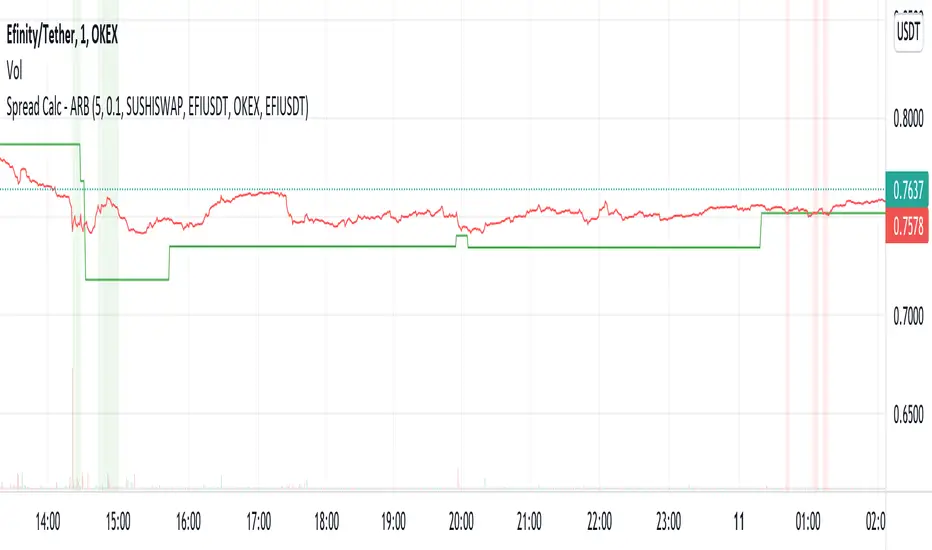
Spread Calc - ARBThis script allows the user to input 2 coins (same coin but on different exchanges), and the 2 exchanges (different ones). With this, the user can visualize the spread between the coins chosen by a percentage and a signal of when the coins return to a similar price. All decisions are your own, use this script as you wish. Thanks!