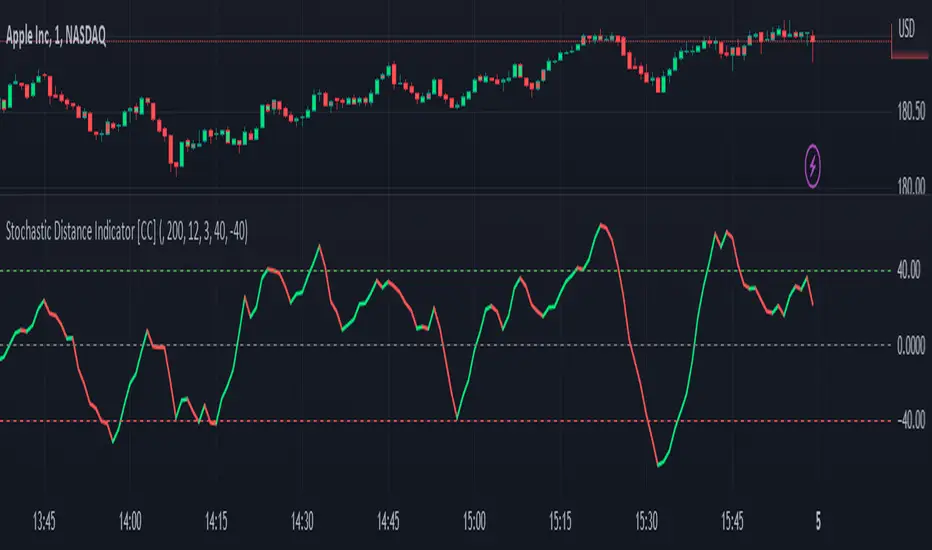
Stochastic Distance Indicator [CC]The Stochastic Distance Indicator was created by Vitali Apirine (Stocks and Commodities Jun 2023 pgs 16-21), and this is a new method that measures the absolute distance between a price and its highest and lowest values over a long period. It uses the stochastic formula to create an oscillator using this distance value and smooths the value. Obviously, there is a lag in signals due to the lookback periods, but it does a good job of staying above the midline when the stock is in a strong uptrend and vice versa. Of course, I'm open to suggestions, but I'm deciding to create buy and sell signals based on comparing the unsmoothed and smoothed values. Buy when the line turns green and sell when it turns red.
Let me know if there are any other indicators you would like to see me publish!
Apirine
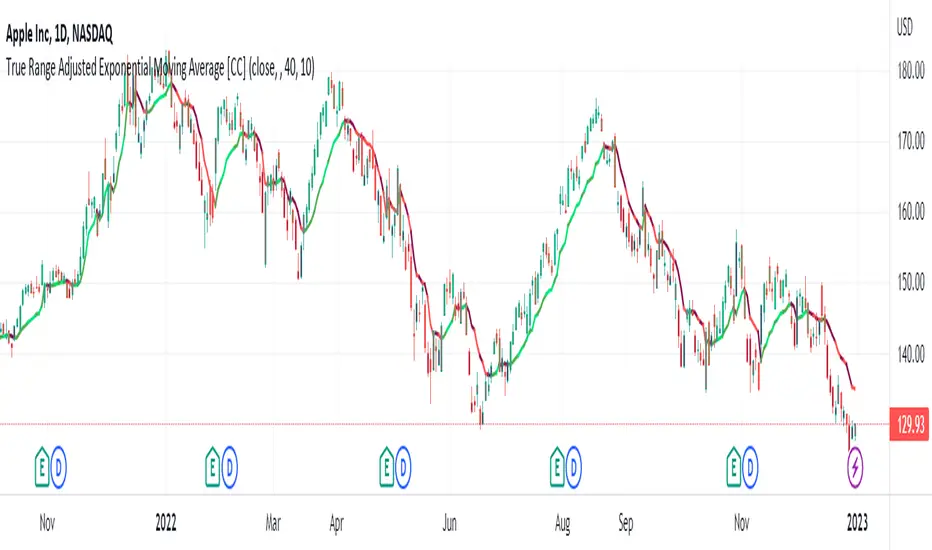
True Range Adjusted Exponential Moving Average [CC]The True Range Adjusted Exponential Moving Average was created by Vitali Apirine (Stocks and Commodities Jan 2023 pgs 22-27) and this is the latest indicator in his EMA variation series. He has been tweaking the traditional EMA formula using various methods and this indicator of course uses the True Range indicator. The way that this indicator works is that it uses a stochastic of the True Range vs its highest and lowest values over a fixed length to create a multiple which increases as the True Range rises to its highest level and decreases as the True Range falls. This in turn will adjust the Ema to rise or fall depending on the underlying True Range. As with all of my indicators, I have color coded it to turn green when it detects a buy signal or turn red when it detects a sell signal. Darker colors mean it is a very strong signal and let me know if you find any settings that work well overall vs the default settings.
Let me know if you would like me to publish any other scripts that you recommend!
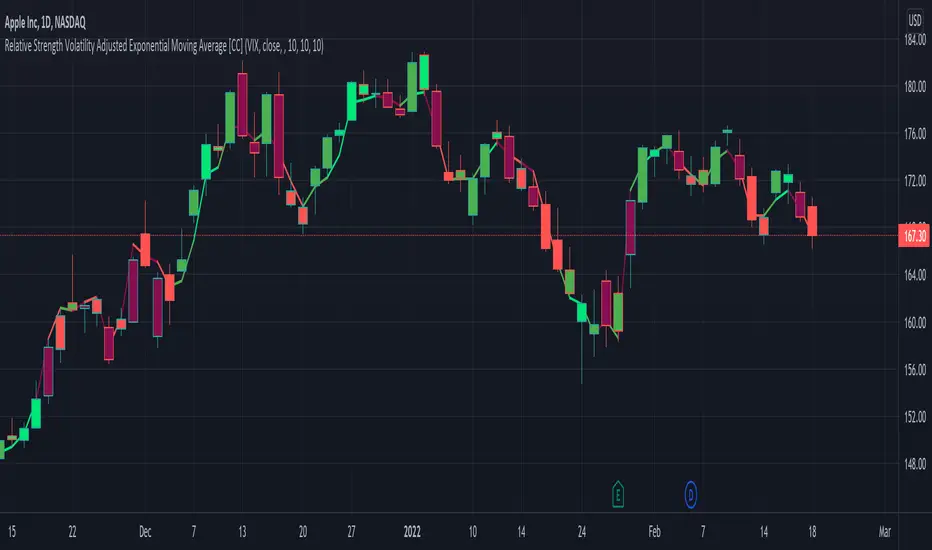
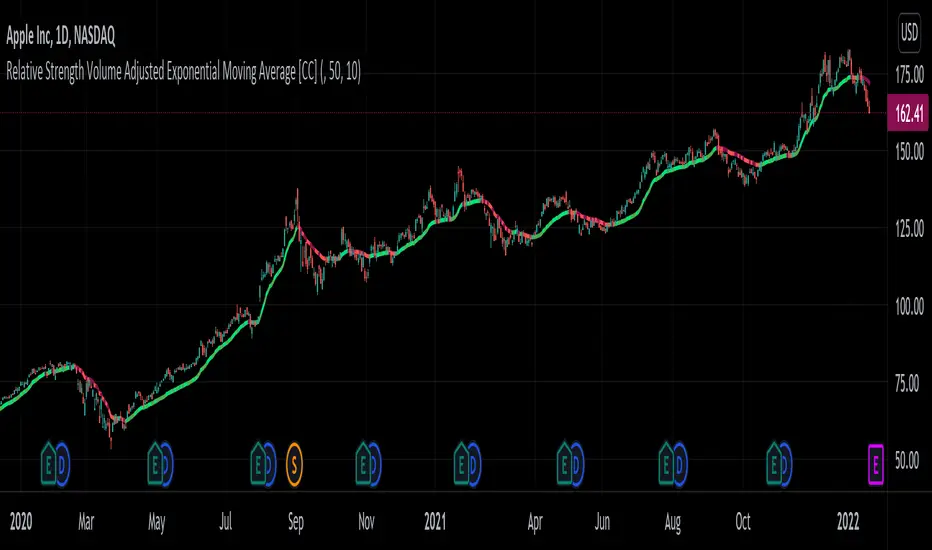
Relative Strength Volatility Adjusted Ema [CC]The Relative Strength Volatility Adjusted Exponential Moving Average was created by Vitali Apirine (Stocks and Commodities Mar 2022) and this is his final indicator of his recent Relative Strength series. I published both of the previous indicators, Relative Strength Volume Adjusted Exponential Moving Average and Relative Strength Exponential Moving Average
This indicator is particularly unique because it uses the Volatility Index (VIX) symbol as the default to determine volatility and uses this in place of the current stock's price into a typical relative strength calculation. As you can see in the chart, it follows the price much closer than the other two indicators and so of course this means that this indicator is best for choppy markets and the other two are better for trending markets. I would of course recommend to experiment with this one and see what works best for you.
I have included strong buy and sell signals in addition to normal ones so strong signals are darker in color and normal signals are lighter in color. Buy when the line turns green and sell when it turns red.
Let me know if there are any other indicators or scripts you would like to see me publish!
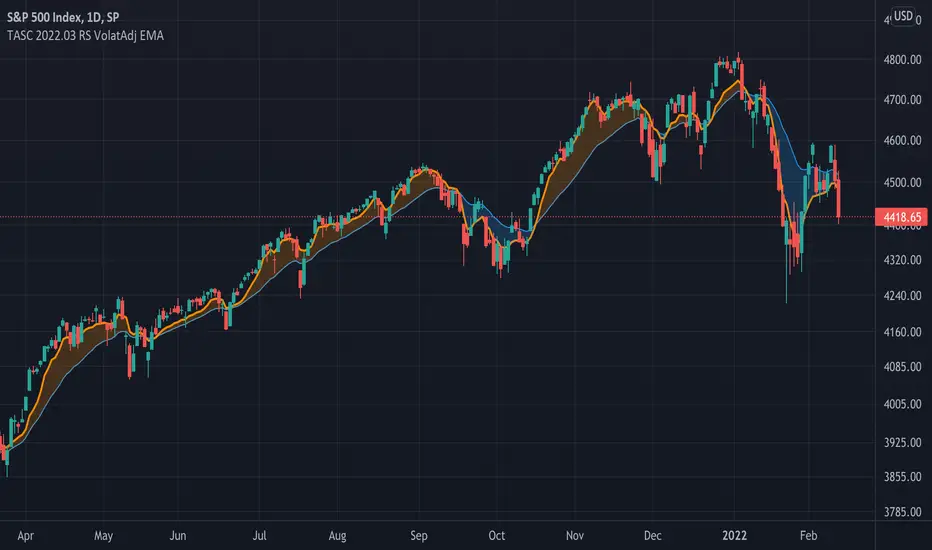
TASC 2022.03 Relative Strength Volatility-Adjusted EMA█ OVERVIEW
TASC's March 2022 edition of Traders' Tips includes the "Relative Strength Moving Averages - Part 3: The Relative Strength Volatility-Adjusted Exponential Moving Average" article authored by Vitali Apirine. This is the code that implements the "RS VolatAdj EMA" from the article.
█ CONCEPTS
In a three-part article series, Vitaly Apirine examines ways to filter price movements and define turning points by applying the Relative Strength concept to exponential moving averages . The resulting indicator is more responsive and is intended to account for the relative strength of volatility .
█ CALCULATIONS
The calculation process uses the following steps:
Select an appropriate volatility index (in our case it is VIX ).
Calculate up day volatility (UV) smoothed by a 10-day EMA.
Calculate down day volatility (DV) smoothed by a 10-day EMA.
Take the absolute value of the difference between UV and DV and divide by the sum of UV and DV. This is the Volatility Strength we need.
Calculate a MLTP constant - the weighting multiplier for an exponential moving average.
Combine Volatility Strength and MLTP to create an exponential moving average on current price data.
Join TradingView!
Relative Strength Volume Adjusted Exponential Moving Avg [CC]The Relative Strength Volume Adjusted Exponential Moving Average was created by Vitali Apirine (Stocks and Commodities Feb 2022 pgs 14-18) and this is very similar of course to the last Relative Strength Exponential Moving Average . It works under the same concept with using overbought and oversold methods to adjust the moving average and with this particular version you will notice that sudden drops or increases won't follow super closely so this can be useful along with the other as a good complementary indicator to use with each other to determine the short and medium term trend and to give good entry and exit points. I have strong buy and sell signals in addition to normal ones so darker colors are strong and lighter colors are normal. Buy when the indicator line turns green and sell when it turns red.
Let me know if there are any other indicators or scripts you would like to see me publish!
Relative Strength Exponential Moving Average [CC]The Relative Strength Exponential Moving Average was created by Vitali Apirine (Stocks and Commodities Jan 2022 pgs 22-25) and this is a handy moving average that combines a typical overbought/oversold mechanic with an overall trend indicator. Even though the typical length is so large it reacts extremely quickly when the stock becomes overbought or oversold. Because of this the indicator by itself doesn't work as well during choppy periods so Vitali recommends using a moving average crossover system during choppy so do one indicator with the default length of 50 and use a different length of 10 so when the shorter length crosses over the longer length then buy and vice versa you would sell. Generally speaking buy when the line turns green and sell when it turns red. I have used strong buy and sell signals in addition to normal signals so strong signals are darker in color and normal signals are lighter in color.
Let me know if there are any other scripts or indicators you would like me to publish!

Moving Average Band Width [CC]The Moving Average Band Width was created by Vitali Apirine (Stocks and Commodities Aug 2021 pg 25) and this is of course an extension based on my previous Moving Average Bands script. For those of you that aren't aware, the Band Width indicator is an indicator that tells you how close the upper and lower bands are to each other which is a great determination of how volatility is increasing or decreasing. This acts as both a trend indicator and a volatility indicator. I have included strong buy and sell signals in addition to normal ones so stronger signals are darker in color and normal ones are lighter. A great buy signal is when you are in an uptrend (so the line is green already) and the indicator line is moving up which means strong underlying volatility.
Let me know if there are any other indicators or scripts you would like to see me publish!

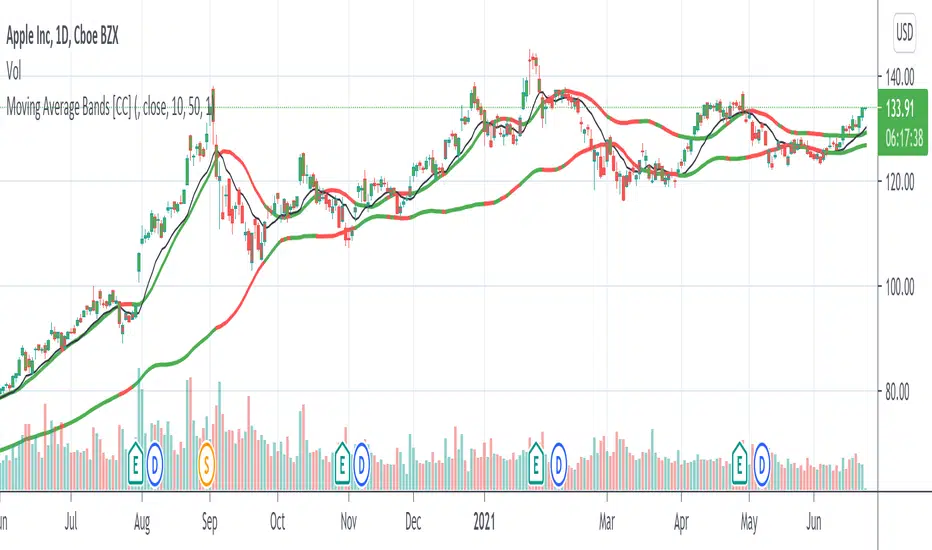
Moving Average Bands [CC]The Moving Average Bands were created by Vitali Apirine (Stocks and Commodities July 2021 pg 16) and this is a very handy trend following indicator that will give you the overall trend of the underlying stock. As the bands rise then the stock is in an uptrend and as they fall then it is a downtrend. If the bands stay flat then it is a sideways and/or choppy market. I did change the middle band from what he originally authored because I believe this gives more accurate buy and sell signals so keep that in mind. Feel free to use a different moving average than the original exponential moving average in the formula. As always buy when the indicator lines turn green and sell when they turn red.
Let me know if there are any other indicators you would like to see me publish!
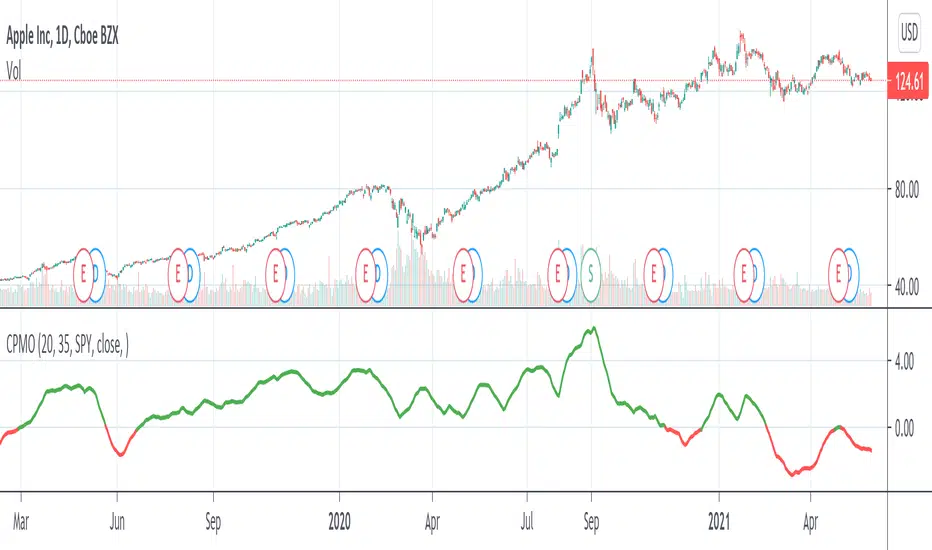
Compare Price Momentum Oscillator [CC]The Compare Price Momentum Oscillator was created by Vitali Apirine (Stocks and Commodities Aug 2020 pg 16) and this is a handy indicator to compare the momentum of the current symbol you are looking at to the s&p to determine the relative strength of the underlying security. Buy when the line turns green and sell when it turns red.
Let me know if there are any other scripts you would like to see me publish!
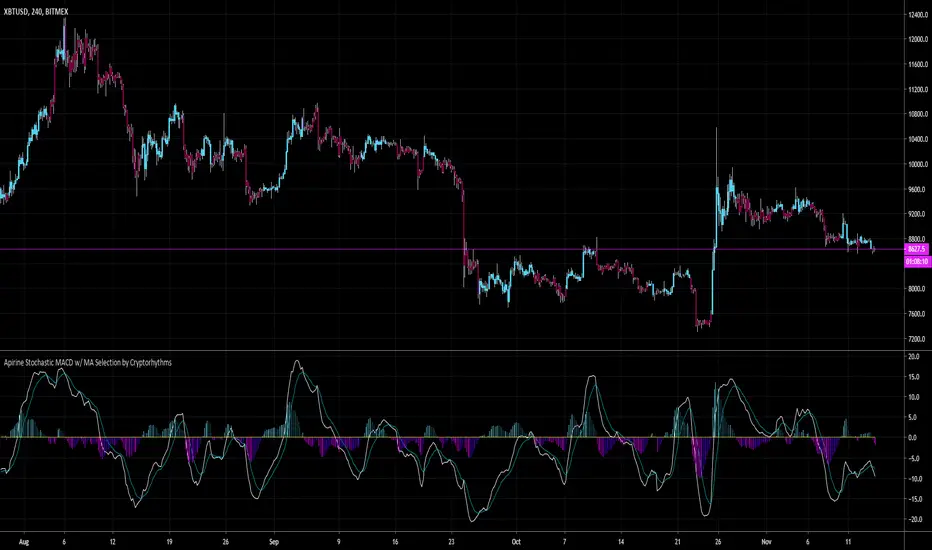
Apirine Stochastic MACD w/ MA Selection by Cryptorhythms📊 Apirine Stochastic MACD w/ MA Selection by Cryptorhythms
Intro
Had to re-release due to moderation.
This happens to be my first open source indicator, hope you all enjoy it!
Description
This indicated is ported from November 2019 issue of TASC. “The Stochastic MACD Oscillator” in this issue, author Vitali Apirine introduces a new indicator created by combining the stochastic oscillator and the MACD . He describes the new indicator as a momentum oscillator and explains that it allows the trader to define overbought and oversold levels similar to the classic stochastic but based on the MACD .
Options
-You can enable bar coloration for trade state (signal conditions setup in the "long" and "short" variables).
-You can choose histogram or columns for the convergence/divergence display.
-You can turn on/off and adjust the overbought / oversold zones.
-You can choose what type of moving average to use in the calculation from a small selection of options. This gives you more flexibility to adapt the indicator to your needs.
👍 We hope you enjoyed this indicator and find it useful! We post free crypto analysis, strategies and indicators regularly. This is our 70th script on Tradingview!
🤐Check my Signature for other information
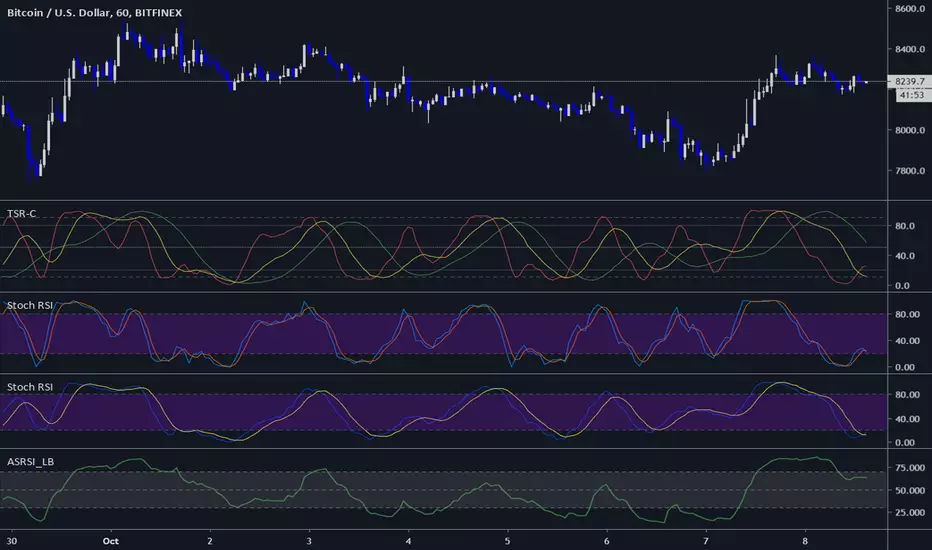
Three StochRSI ComboThree StochRSI with adjustable lengths in one indicator, with no extra bells or whistles. Lazybear's Apirine Slow RSI is used for the RSI formula for the third Stoch.
14-period StochRSI (red) is considered short term.
20-period StochRSI is another short to mid term preset I've seen used in various indicators on different platforms by default, and is included as the yellow stochRSI.
Lazybear's Apirine Slow RSI is used as the base for the third, slower stoch - parameter input adjustment for your specific timeframe and instrument is recommended. The Apirine Slow RSI doesn't have as effective strong divergences during established trends, so the way it would react in when run through a stoch should be more synergistic than not during trending periods for longer term trends.
StochRSI:
StochRSI measures the value of RSI relative to its high/low range over a set number of periods - It's important to note that StochRSI is technically an indicator of an indicator (RSI), which makes it the second derivative of price. This is part of the main contributing factors to how it looks and functions in relation to price.
A move above 80 ---> considered overbought.
A move below 20 ---> considered oversold.
Moves around the midline (50) can also be interpreted as continuation of upward/downwards trend depending on whether the midline is acting more of as a support (uptrend) or a resistance level (downtrend).
Stoch K-line disabled by default/D-line enabled by default.
Stoch K/D lengths are set to 3/3/14/14 (red), 6/6/20/20 (yellow), 12/12 (green) by default.
Midline (50) set to white/silver to make more visible on darkmode charts.
Additional adjustable levels for Overbought/Oversold beyond 20/80 (set at 10/90 by default - see dashed grey line. Dotted line is 20/80.)
Three stochRSI with 3/3/14/14, 6/6/20/20, and 12/12/14/14/6 length are shown below the indicator for reference.
Acknowledgements:
// Aprine Slow RSI - Lazybear
//
// Stockcharts for StochRSI reference
// school.stockcharts.com
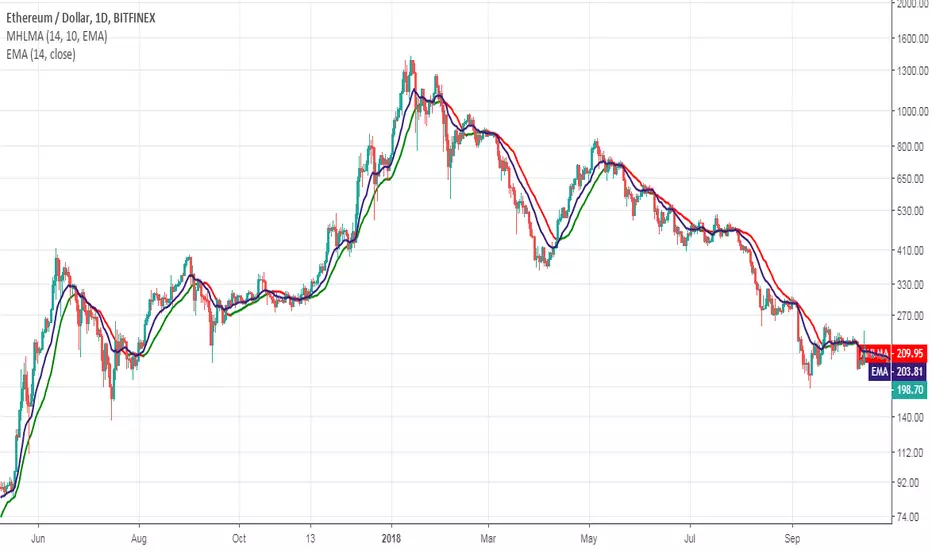
Middle-High-Low Moving AverageThis indicator was originally developed by Vitali Apirine (Stocks & Commodities , V.34:9 (August, 2016): "The Middle-High-Low Moving Average").
You can use it to create a crossover trading system in conjuction with EMA/SMA.
Good luck!
Adaptive Moving AverageAdaptive Moving Average indicator script. This indicator was originally developed by Vitali Apirine (Stocks & Commodities V.36:5: Adaptive Moving Averages).
