Mutanabby_AI | ONEUSDT_MR1
ONEUSDT Mean-Reversion Strategy | 74.68% Win Rate | 417% Net Profit
This is a long-only mean-reversion strategy designed specifically for ONEUSDT on the 1-hour timeframe. The core logic identifies oversold conditions following sharp declines and enters positions when selling pressure exhausts, capturing the subsequent recovery bounce.
Backtested Period: June 2019 – December 2025 (~6 years)
Performance Summary
| Metric | Value |
|--------|-------|
| Net Profit | +417.68% |
| Win Rate | 74.68% |
| Profit Factor | 4.019 |
| Total Trades | 237 |
| Sharpe Ratio | 0.364 |
| Sortino Ratio | 1.917 |
| Max Drawdown | 51.08% |
| Avg Win | +3.14% |
| Avg Loss | -2.30% |
| Buy & Hold Return | -80.44% |
Strategy Logic :
Entry Conditions (Long Only):
The strategy seeks confluence of three conditions that identify exhausted selling:
1. Prior Move Filter:*The price change from 5 bars ago to 3 bars ago must be ≥ -7% (ensures we're not entering during freefall)
2. Current Move Filter: The price change over the last 2 bars must be ≤ 0% (confirms momentum is stalling or reversing)
3. Three-Bar Decline: The price change from 5 bars ago to 3 bars ago must be ≤ -5% (confirms a significant recent drop occurred)
When all three conditions align, the strategy identifies a potential reversal point where sellers are exhausted.
Exit Conditions:
- Primary Exit: Close above the previous bar's high while the open of the previous bar is at or below the close from 9 bars ago (profit-taking on strength)
- Trailing Stop: 11x ATR trailing stop that locks in profits as price rises
Risk Management
- Position Sizing:Fixed position based on account equity divided by entry price
- Trailing Stop:11× ATR (14-period) provides wide enough room for crypto volatility while protecting gains
- Pyramiding:Up to 4 orders allowed (can scale into winning positions)
- **Commission:** 0.1% per trade (realistic exchange fees included)
Important Disclaimers
⚠️ This is NOT financial advice.
- Past performance does not guarantee future results
- Backtest results may contain look-ahead bias or curve-fitting
- Real trading involves slippage, liquidity issues, and execution delays
- This strategy is optimized for ONEUSDT specifically — results may differ on other pairs
- Always test before risking real capital
Recommended Usage
- Timeframe:*1H (as designed)
- Pair: ONEUSDT (Binance)
- Account Size: Ensure sufficient capital to survive max drawdown
Source Code
Feedback Welcome
I'm sharing this strategy freely for educational purposes. Please:
- Drop a comment with your backtesting results any you analysis
- Share any modifications that improve performance
- Let me know if you spot any issues in the logic
Happy trading
As a quant trader, do you think this strategy will survive in live trading?
Yes or No? And why?
I want to hear from you guys
Altcoin

ALT Risk Metric StrategyHere's a professional write-up for your ALT Risk Strategy script:
ALT/BTC Risk Strategy - Multi-Crypto DCA with Bitcoin Correlation Analysis
Overview
This strategy uses Bitcoin correlation as a risk indicator to time entries and exits for altcoins. By analyzing how your chosen altcoin performs relative to Bitcoin, the strategy identifies optimal accumulation periods (when alt/BTC is oversold) and profit-taking opportunities (when alt/BTC is overbought). Perfect for traders who want to outperform Bitcoin by strategically timing altcoin positions.
Key Innovation: Why Alt/BTC Matters
Most traders focus solely on USD price, but Alt/BTC ratios reveal true altcoin strength:
When Alt/BTC is low → Altcoin is undervalued relative to Bitcoin (buy opportunity)
When Alt/BTC is high → Altcoin has outperformed Bitcoin (take profits)
This approach captures the rotation between BTC and alts that drives crypto cycles
Key Features
📊 Advanced Technical Analysis
RSI (60% weight): Primary momentum indicator on weekly timeframe
Long-term MA Deviation (35% weight): Measures distance from 150-period baseline
MACD (5% weight): Minor confirmation signal
EMA Smoothing: Filters noise while maintaining responsiveness
All calculations performed on Alt/BTC pairs for superior market timing
💰 3-Tier DCA System
Level 1 (Risk ≤ 70): Conservative entry, base allocation
Level 2 (Risk ≤ 50): Increased allocation, strong opportunity
Level 3 (Risk ≤ 30): Maximum allocation, extreme undervaluation
Continuous buying: Executes every bar while below threshold for true DCA behavior
Cumulative sizing: L3 triggers = L1 + L2 + L3 amounts combined
📈 Smart Profit Management
Sequential selling: Must complete L1 before L2, L2 before L3
Percentage-based exits: Sell portions of position, not fixed amounts
Auto-reset on re-entry: New buy signals reset sell progression
Prevents premature full exits during volatile conditions
🤖 3Commas Automation
Pre-configured JSON webhooks for Custom Signal Bots
Multi-exchange support: Binance, Coinbase, Kraken, Bitfinex, Bybit
Flexible quote currency: USD, USDT, or BUSD
Dynamic order sizing: Automatically adjusts to your tier thresholds
Full webhook documentation compliance
🎨 Multi-Asset Support
Pre-configured for popular altcoins:
ETH (Ethereum)
SOL (Solana)
ADA (Cardano)
LINK (Chainlink)
UNI (Uniswap)
XRP (Ripple)
DOGE
RENDER
Custom option for any other crypto
How It Works
Risk Metric Calculation (0-100 scale):
Fetches weekly Alt/BTC price data for stability
Calculates RSI, MACD, and deviation from 150-period MA
Normalizes MACD to 0-100 range using 500-bar lookback
Combines weighted components: (MACD × 0.05) + (RSI × 0.60) + (Deviation × 0.35)
Applies 5-period EMA smoothing for cleaner signals
Color-Coded Risk Zones:
Green (0-30): Extreme buying opportunity - Alt heavily oversold vs BTC
Lime/Yellow (30-70): Accumulation range - favorable risk/reward
Orange (70-85): Caution zone - consider taking initial profits
Red/Maroon (85-100+): Euphoria zone - aggressive profit-taking
Entry Logic:
Buys execute every candle when risk is below threshold
As risk decreases, position sizing automatically scales up
Example: If risk drops from 60→25, you'll be buying at L1 rate until it hits 50, then L2 rate, then L3 rate
Exit Logic:
Sells only trigger when in profit AND risk exceeds thresholds
Sequential execution ensures partial profit-taking
If new buy signal occurs before all sells complete, sell levels reset to L1
Configuration Guide
Choosing Your Altcoin:
Select crypto from dropdown (or use CUSTOM for unlisted coins)
Pick your exchange
Choose quote currency (USD, USDT, BUSD)
Risk Metric Tuning:
Long Term MA (default 150): Higher = more extreme signals, Lower = more frequent
RSI Length (default 10): Lower = more volatile, Higher = smoother
Smoothing (default 5): Increase for less noise, decrease for faster reaction
Buy Settings (Aggressive DCA Example):
L1 Threshold: 70 | Amount: $5
L2 Threshold: 50 | Amount: $6
L3 Threshold: 30 | Amount: $7
Total L3 buy = $18 per candle when deeply oversold
Sell Settings (Balanced Exit Example):
L1: 70 threshold, 25% position
L2: 85 threshold, 35% position
L3: 100 threshold, 40% position (final exit)
3Commas Setup
Bot Configuration:
Create Custom Signal Bot in 3Commas
Set trading pair to your altcoin/USD (e.g., ETH/USD, SOL/USDT)
Order size: Select "Send in webhook, quote" to use strategy's dollar amounts
Copy Bot UUID and Secret Token
Script Configuration:
Paste credentials into 3Commas section inputs
Check "Enable 3Commas Alerts"
Save and apply to chart
TradingView Alert:
Create Alert → Condition: "alert() function calls only"
Webhook URL: api.3commas.io
Enable "Webhook URL" checkbox
Expiration: Open-ended
Strategy Advantages
✅ Outperform Bitcoin: Designed specifically to beat BTC by timing alt rotations
✅ Capture Alt Seasons: Automatically accumulates when alts lag, sells when they pump
✅ Risk-Adjusted Sizing: Buys more when cheaper (better risk/reward)
✅ Emotional Discipline: Systematic approach removes fear and FOMO
✅ Multi-Asset: Run same strategy across multiple altcoins simultaneously
✅ Proven Indicators: Combines RSI, MACD, and MA deviation - battle-tested tools
Backtesting Insights
Optimal Timeframes:
Daily chart: Best for backtesting and signal generation
Weekly data is fetched internally regardless of display timeframe
Historical Performance Characteristics:
Accumulates heavily during bear markets and BTC dominance periods
Captures explosive altcoin rallies when BTC stagnates
Sequential selling preserves capital during extended downtrends
Works best on established altcoins with multi-year history
Risk Considerations:
Requires capital reserves for extended accumulation periods
Some altcoins may never recover if fundamentals deteriorate
Past correlation patterns may not predict future performance
Always size positions according to personal risk tolerance
Visual Interface
Indicator Panel Displays:
Dynamic color line: Green→Lime→Yellow→Orange→Red as risk increases
Horizontal threshold lines: Dashed lines mark your buy/sell levels
Entry/Exit labels: Green labels for buys, Orange/Red/Maroon for sells
Real-time risk value: Numerical display on price scale
Customization:
All threshold lines are adjustable via inputs
Color scheme clearly differentiates buy zones (green spectrum) from sell zones (red spectrum)
Line weights emphasize most extreme thresholds (L3 buy and L3 sell)
Strategy Philosophy
This strategy is built on the principle that altcoins move in cycles relative to Bitcoin. During Bitcoin rallies, alts often bleed against BTC (high sell, accumulate). When Bitcoin consolidates, alts pump (take profits). By measuring risk on the Alt/BTC chart instead of USD price, we time these rotations with precision.
The 3-tier system ensures you're always averaging in at better prices and scaling out at better prices, maximizing your Bitcoin-denominated returns.
Advanced Tips
Multi-Bot Strategy:
Run this on 5-10 different altcoins simultaneously to:
Diversify correlation risk
Capture whichever alt is pumping
Smooth equity curve through rotation
Pairing with BTC Strategy:
Use alongside the BTC DCA Risk Strategy for complete portfolio coverage:
BTC strategy for core holdings
ALT strategies for alpha generation
Rebalance between them based on BTC dominance
Threshold Calibration:
Check 2-3 years of historical data for your chosen alt
Note where risk metric sat during major bottoms (set buy thresholds)
Note where it peaked during euphoria (set sell thresholds)
Adjust for your risk tolerance and holding period
Credits
Strategy Development & 3Commas Integration: Claude AI (Anthropic)
Technical Analysis Framework: RSI, MACD, Moving Average theory
Implementation: pommesUNDwurst
Disclaimer
This strategy is for educational purposes only. Cryptocurrency trading involves substantial risk of loss. Altcoins are especially volatile and many fail completely. The strategy assumes liquid markets and reliable Alt/BTC price data. Always do your own research, understand the fundamentals of any asset you trade, and never risk more than you can afford to lose. Past performance does not guarantee future results. The authors are not financial advisors and assume no liability for trading decisions.
Additional Warning: Using leverage or trading illiquid altcoins amplifies risk significantly. This strategy is designed for spot trading of established cryptocurrencies with deep liquidity.
Tags: Altcoin, Alt/BTC, DCA, Risk Metric, Dollar Cost Averaging, 3Commas, ETH, SOL, Crypto Rotation, Bitcoin Correlation, Automated Trading, Alt Season
Feel free to modify any sections to better match your style or add specific backtesting results you've observed! 🚀Claude is AI and can make mistakes. Please double-check responses. Sonnet 4.5

AltCoin & MemeCoin Index Correlation [Eddie_Bitcoin]🧠 Philosophy of the Strategy
The AltCoin & MemeCoin Index Correlation Strategy by Eddie_Bitcoin is a carefully engineered trend-following system built specifically for the highly volatile and sentiment-driven world of altcoins and memecoins.
This strategy recognizes that crypto markets—especially niche sectors like memecoins—are not only influenced by individual price action but also by the relative strength or weakness of their broader sector. Hence, it attempts to improve the reliability of trading signals by requiring alignment between a specific coin’s trend and its sector-wide index trend.
Rather than treating each crypto asset in isolation, this strategy dynamically incorporates real-time dominance metrics from custom indices (OTHERS.D and MEME.D) and combines them with local price action through dual exponential moving average (EMA) crossovers. Only when both the asset and its sector are moving in the same direction does it allow for trade entries—making it a confluence-based system rather than a single-signal strategy.
It supports risk-aware capital allocation, partial exits, configurable stop loss and take profit levels, and a scalable equity-compounding model.
✅ Why did I choose OTHERS.D and MEME.D as reference indices?
I selected OTHERS.D and MEME.D because they offer a sector-focused view of crypto market dynamics, especially relevant when trading altcoins and memecoins.
🔹 OTHERS.D tracks the market dominance of all cryptocurrencies outside the top 10 by market cap.
This excludes not only BTC and ETH, but also major stablecoins like USDT and USDC, making it a cleaner indicator of risk appetite across true altcoins.
🔹 This is particularly useful for detecting "Altcoin Season"—periods where capital rotates away from Bitcoin and flows into smaller-cap coins.
A rising OTHERS.D often signals the start of broader altcoin rallies.
🔹 MEME.D, on the other hand, captures the speculative behavior of memecoin segments, which are often driven by retail hype and social media activity.
It's perfect for timing momentum shifts in high-risk, high-reward tokens.
By using these indices, the strategy aligns entries with broader sector trends, filtering out noise and increasing the probability of catching true directional moves, especially in phases of capital rotation and altcoin risk-on behavior.
📐 How It Works — Core Logic and Execution Model
At its heart, this strategy employs dual EMA crossover detection—one pair for the asset being traded and one pair for the selected market index.
A trade is only executed when both EMA crossovers agree on the direction. For example:
Long Entry: Coin's fast EMA > slow EMA and Index's fast EMA > slow EMA
Short Entry: Coin's fast EMA < slow EMA and Index's fast EMA < slow EMA
You can disable the index filter and trade solely based on the asset’s trend just to make a comparison and see if improves a classic EMA crossover strategy.
Additionally, the strategy includes:
- Adaptive position sizing, based on fixed capital or current equity (compound mode)
- Take Profit and Stop Loss in percentage terms
- Smart partial exits when trend momentum fades
- Date filtering for precise backtesting over specific timeframes
- Real-time performance stats, equity tracking, and visual cues on chart
⚙️ Parameters & Customization
🔁 EMA Settings
Each EMA pair is customizable:
Coin Fast EMA: Default = 47
Coin Slow EMA: Default = 50
Index Fast EMA: Default = 47
Index Slow EMA: Default = 50
These control the sensitivity of the trend detection. A wider spread gives smoother, slower entries; a narrower spread makes it more responsive.
🧭 Index Reference
The correlation mechanism uses CryptoCap sector dominance indexes:
OTHERS.D: Dominance of all coins EXCLUDING Top 10 ones
MEME.D: Dominance of all Meme coins
These are dynamically calculated using:
OTHERS_D = OTHERS_cap / TOTAL_cap * 100
MEME_D = MEME_cap / TOTAL_cap * 100
You can select:
Reference Index: OTHERS.D or MEME.D
Or disable the index reference completely (Don't Use Index Reference)
💰 Position Sizing & Risk Management
Two capital allocation models are supported:
- Fixed % of initial capital (default)
- Compound profits, which scales positions as equity grows
Settings:
- Compound profits?: true/false
- % of equity: Between 1% and 200% (default = 10%)
This is critical for users who want to balance growth with risk.
🎯 Take Profit / Stop Loss
Customizable thresholds determine automatic exits:
- TakeProfit: Default = 99999 (disabled)
- StopLoss: Default = 5 (%)
These exits are percentage-based and operate off the entry price vs. current close.
📉 Trend Weakening Exit (Scale Out)
If the position is in profit but the trend weakens (e.g., EMA color signals trend loss), the strategy can partially close a configurable portion of the position:
- Scale Position on Weak Trend?: true/false
- Scaled Percentage: % to close (default = 65%)
This feature is useful for preserving profits without exiting completely.
📆 Date Filter
Useful for segmenting performance over specific timeframes (e.g., bull vs bear markets):
- Filter Date Range of Backtest: ON/OFF
- Start Date and End Date: Custom time range
OTHER PARAMETERS EXPLANATION (Strategy "Properties" Tab):
- Initial Capital is set to 100 USD
- Commission is set to 0.055% (The ones I have on Bybit)
- Slippage is set to 3 ticks
- Margin (short and long) are set to 0.001% to avoid "overspending" your initial capital allocation
📊 Visual Feedback and Debug Tools
📈 EMA Trend Visualization
The slow EMA line is dynamically color-coded to visually display the alignment between the asset trend and the index trend:
Lime: Coin and index both bullish
Teal: Only coin bullish
Maroon: Only index bullish
Red: Both bearish
This allows for immediate visual confirmation of current trend strength.
💬 Real-Time PnL Labels
When a trade closes, a label shows:
Previous trade return in % (first value is the effective PL)
Green background for profit, Red for losses.
📑 Summary Table Overlay
This table appears in a corner of the chart (user-defined) and shows live performance data including:
Trade direction (yellow long, purple short)
Emojis: 💚 for current profit, 😡 for current loss
Total number of trades
Win rate
Max drawdown
Duration in days
Current trade profit/loss (absolute and %)
Cumulative PnL (absolute and %)
APR (Annualized Percentage Return)
Each metric is color-coded:
Green for strong results
Yellow/orange for average
Red/maroon for poor performance
You can select where this appears:
Top Left
Top Right
Bottom Left
Bottom Right (default)
📚 Interpretation of Key Metrics
Equity Multiplier: How many times initial capital has grown (e.g., “1.75x”)
Net Profit: Total gains including open positions
Max Drawdown: Largest peak-to-valley drop in strategy equity
APR: Annualized return calculated based on equity growth and days elapsed
Win Rate: % of profitable trades
PnL %: Percentage profit on the most recent trade
🧠 Advanced Logic & Safety Features
🛑 “Don’t Re-Enter” Filter
If a trade is closed due to StopLoss without a confirmed reversal, the strategy avoids re-entering in that same direction until conditions improve. This prevents false reversals and repetitive losses in sideways markets.
🧷 Equity Protection
No new trades are initiated if equity falls below initial_capital / 30. This avoids overleveraging or continuing to trade when capital preservation is critical.
Keep in mind that past results in no way guarantee future performance.
Eddie Bitcoin

Mutanabby_AI | ATR+ | Trend-Following StrategyThis document presents the Mutanabby_AI | ATR+ Pine Script strategy, a systematic approach designed for trend identification and risk-managed position entry in financial markets. The strategy is engineered for long-only positions and integrates volatility-adjusted components to enhance signal robustness and trade management.
Strategic Design and Methodological Basis
The Mutanabby_AI | ATR+ strategy is constructed upon a foundation of established technical analysis principles, with a focus on objective signal generation and realistic trade execution.
Heikin Ashi for Trend Filtering: The core price data is processed via Heikin Ashi (HA) methodology to mitigate transient market noise and accentuate underlying trend direction. The script offers three distinct HA calculation modes, allowing for comparative analysis and validation:
Manual Calculation: Provides a transparent and deterministic computation of HA values.
ticker.heikinashi(): Utilizes TradingView's built-in function, employing confirmed historical bars to prevent repainting artifacts.
Regular Candles: Allows for direct comparison with standard OHLC price action.
This multi-methodological approach to trend smoothing is critical for robust signal generation.
Adaptive ATR Trailing Stop: A key component is the Average True Range (ATR)-based trailing stop. ATR serves as a dynamic measure of market volatility. The strategy incorporates user-defined parameters (
Key Value and ATR Period) to calibrate the sensitivity of this trailing stop, enabling adaptation to varying market volatility regimes. This mechanism is designed to provide a dynamic exit point, preserving capital and locking in gains as a trend progresses.
EMA Crossover for Signal Generation: Entry and exit signals are derived from the interaction between the Heikin Ashi derived price source and an Exponential Moving Average (EMA). A crossover event between these two components is utilized to objectively identify shifts in momentum, signaling potential long entry or exit points.
Rigorous Stop Loss Implementation: A critical feature for risk mitigation, the strategy includes an optional stop loss. This stop loss can be configured as a percentage or fixed point deviation from the entry price. Importantly, stop loss execution is based on real market prices, not the synthetic Heikin Ashi values. This design choice ensures that risk management is grounded in actual market liquidity and price levels, providing a more accurate representation of potential drawdowns during backtesting and live operation.
Backtesting Protocol: The strategy is configured for realistic backtesting, employing fill_orders_on_standard_ohlc=true to simulate order execution at standard OHLC prices. A configurable Date Filter is included to define specific historical periods for performance evaluation.
Data Visualization and Metrics: The script provides on-chart visual overlays for buy/sell signals, the ATR trailing stop, and the stop loss level. An integrated information table displays real-time strategy parameters, current position status, trend direction, and key price levels, facilitating immediate quantitative assessment.
Applicability
The Mutanabby_AI | ATR+ strategy is particularly suited for:
Cryptocurrency Markets: The inherent volatility of assets such as #Bitcoin and #Ethereum makes the ATR-based trailing stop a relevant tool for dynamic risk management.
Systematic Trend Following: Individuals employing systematic methodologies for trend capture will find the objective signal generation and rule-based execution aligned with their approach.
Pine Script Developers and Quants: The transparent code structure and emphasis on realistic backtesting provide a valuable framework for further analysis, modification, and integration into broader quantitative models.
Automated Trading Systems: The clear, deterministic entry and exit conditions facilitate integration into automated trading environments.
Implementation and Evaluation
To evaluate the Mutanabby_AI | ATR+ strategy, apply the script to your chosen chart on TradingView. Adjust the input parameters (Key Value, ATR Period, Heikin Ashi Method, Stop Loss Settings) to observe performance across various asset classes and timeframes. Comprehensive backtesting is recommended to assess the strategy's historical performance characteristics, including profitability, drawdown, and risk-adjusted returns.
I'd love to hear your thoughts, feedback, and any optimizations you discover! Drop a comment below, give it a like if you find it useful, and share your results.

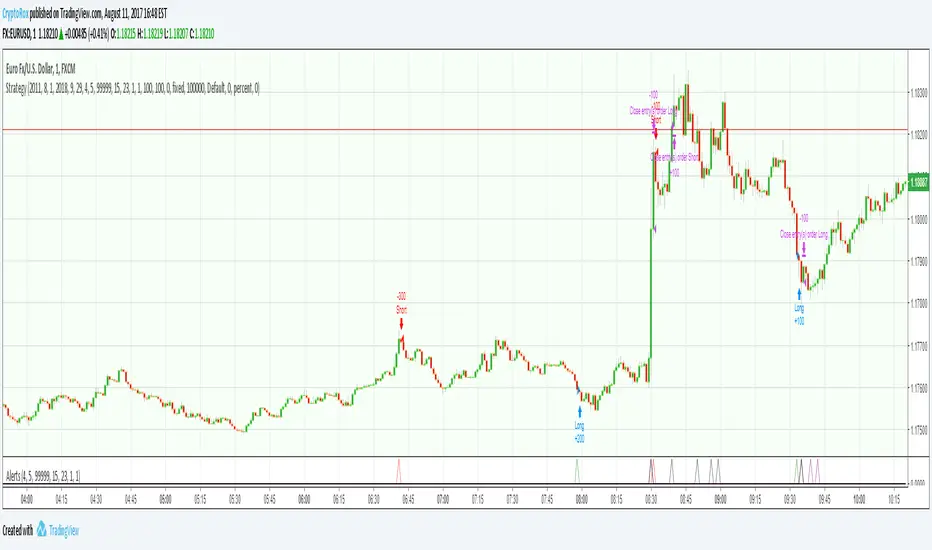
How to automate this strategy for free... Version 2Hello fellow traders and automation lovers.
It has been about 2 years since we originally created Autoview to connect your exchanges/brokers with your TradingView alerts. We've since added multiple exchanges, parameters and have built a large community filled with awesome, passionate traders.
One of the first strategies we built was sadly not a viable one for trading due to it using built-in variables that resulted in the backtest results being inaccurate in comparison to placing live trades. Luckily, we did not encounter repainting until a few strategies in, however, there was a point where we published a few of them as well. We will be going through all of our scripts again to not only eliminate any repainting and update to version 3, but to also include all the code snippets that we've learned to use over the years that allow for accurate backtesting and live trading.
The first script we are redoing is our How to automate this strategy for free using a chrome extension. .
Easter egg: This includes a new snippet of code that makes controlling how many orders you pyramid within a study fast and easy.
We look forward to bringing all of our scripts and delving deep into Pine again :)
Happy Trading
Autoview