Crypto Breadth Engine [alex975]
A normalized crypto market breadth indicator with a customizable 40 coin input panel — revealing whether rallies are broad and healthy across major coins and altcoins or led by only a few.
📊 Overview
The Crypto Breadth Engine measures the real participation strength of the crypto market by analyzing the direction of the 40 largest cryptocurrencies by market capitalization.
⚙️ How It Works
Unlike standard breadth tools that only count assets above a moving average, this indicator measures actual price direction:
+1 if a coin closes higher, –1 if lower, 0 if unchanged.
The total forms a Breadth Line, statistically normalized using standard deviation to maintain consistent readings across timeframes and volatility conditions.
🧩 Dynamic Input Mask
All 40 cryptocurrencies are fully editable via the input panel, allowing users to easily replace or customize the basket (Top 40, Layer-1s, DeFi, Meme Coins, AI Tokens, etc.) without touching the code.
This flexibility keeps the indicator aligned with the evolving crypto market.
🧭 Trend Bias
The indicator classifies market structure as Bullish, Neutral, or Bearish, based on how the Breadth Line aligns with its moving averages (10, 20, 50).
💡 Dashboard
A compact on-chart table displays in real time:
• Positive and negative coins
• Participation percentage
• Current trend bias
🔍 Interpretation
• Rising breadth → broad, healthy market expansion
• Falling breadth → narrowing participation and structural weakness
Ideal for TOTAL, TOTAL3, or custom crypto baskets on 1D,1W.
Developed by alex975 – Version 1.0 (2025).
-------------------------------------------------------------------------------------
🇮🇹 Versione Italiana
📊 Panoramica
Il Crypto Breadth Engine misura la partecipazione reale del mercato crypto, analizzando la direzione delle 40 principali criptovalute per capitalizzazione.
Non si limita a contare quante coin sono sopra una media mobile, ma calcola la variazione effettiva del prezzo:
+1 se sale, –1 se scende, 0 se invariato.
La somma genera una Breadth Line normalizzata statisticamente, garantendo letture coerenti su diversi timeframe e fasi di volatilità.
🧩 Mascherina dinamica
L’indicatore include una mascherina d’input interattiva che consente di modificare o sostituire liberamente i 40 ticker analizzati (Top 40, Layer-1, DeFi, Meme Coin, ecc.) senza intervenire nel codice.
Questo lo rende sempre aggiornato e adattabile all’evoluzione del mercato crypto.
⚙️ Funzionamento e Trend Bias
Classifica automaticamente il mercato come Bullish, Neutral o Bearish in base alla relazione tra la breadth e le medie mobili (10, 20, 50 periodi).
💡 Dashboard
Una tabella compatta mostra in tempo reale:
• Numero di coin positive e negative
• Percentuale di partecipazione
• Stato attuale del trend
🔍 Interpretazione
• Breadth in crescita → mercato ampio e trend sano
• Breadth in calo → partecipazione ridotta e concentrazione su pochi asset
Ideale per analizzare TOTAL, TOTAL3 o panieri personalizzati di crypto.
Funziona su timeframe 1D, 4H, 1W.
Sviluppato da alex975 – Versione 1.0 (2025).
Advancedeclineline

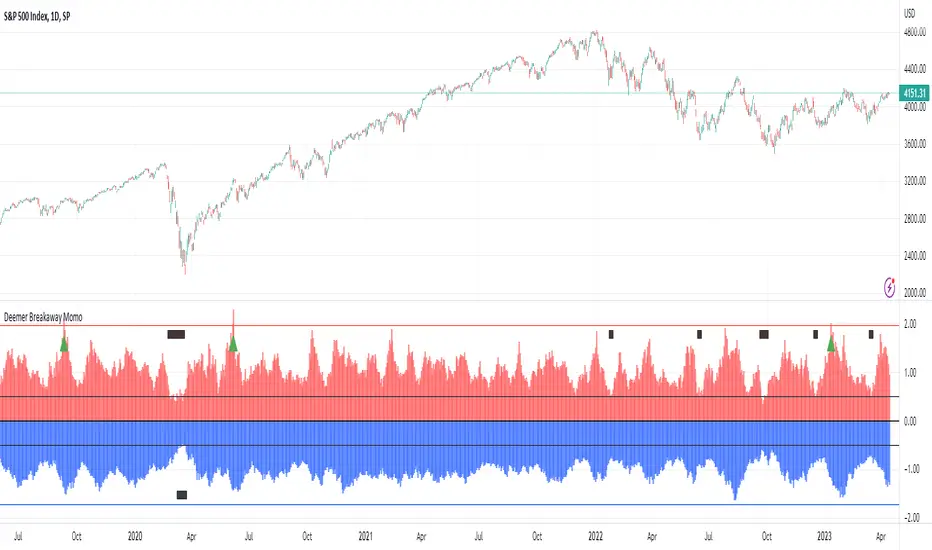
Walter Deemer Market Breadth Breakaway MomentumThis indicator is based on long time market analysts Walter Deemer's research. Below is a summary of what the indicator is used for. In short it can be used to spot market reversals.
In short, when the 10 day NYSE Advance:Decline ratio breaches 1.97, the market has achieved break away momentum. When the 20 day ratio achieves a 1.72 ratio this can be a "good" signal even if when the 10 day has not achieved a 1.97 ratio.
In addition to the NYSE, you can toggle NASDAQ, AMEX, or the average of the three.
You can read more about it here: walterdeemer.com
"Downside momentum usually peaks at the end of a decline, as prices cascade into a primary low. On the upside, though, momentum peaks at the beginning of an advance, then gradually dissipates as the advance goes on, and the more powerful the momentum at the move's beginning, the stronger the overall move; REALLY strong momentum is found only at the beginning of a REALLY strong move: a new bull market or a new intermediate leg up within a bull market. We coined the term "breakaway momentum" in the 1970's to describe this REALLY powerful upside momentum. The following is a review of what it is and how it is typically generated.
Breakaway momentum (some people call it a "breadth thrust") occurs when ten-day total advances on the NYSE are greater than 1.97 times ten-day total NYSE declines. It is a relatively uncommon phenomenon...24 times it has occurred since World War II (an average of once every 3 1/2 years). Cyclical bull markets, though, are traditionally heralded by breakaway momentum, so we are hopeful that it will be generated this time around, too.
....The real trick in generating breakaway momentum? It's not a lot of advances; it's a lack of declines."
Advance/Decline Line [IQ]Advance/Decline Line is a Market Breath indicator.
A/D line calculates a ratio between total number stocks advancing and total number of stocks in one day, providing another way to grasp the market breath at any moment.
We think the indicator covers the whole market, as we use data from the three main exchanges: NYSE, NASDAQ and AMEX.
The New York Stock Exchange (NYSE), nicknamed "The Big Board") is by far the world's largest stock exchange by market capitalization of its listed companies.
The Nasdaq Stock Market (NASDAQ) is ranked second on the list of stock exchanges by market capitalization of shares traded, behind the New York Stock Exchange.
The American Stock Exchange (AMEX) is the third largest stock exchange in the U.S. after the NYSE and the NASDAQ, and handles approximately 10% of all American trades.
How to interpret it:
Green columns mean more than 50% of NASDAQ stocks are advancing, red columns mean more than 50% of NASDAQ stocks are declining.
Green values above the top band mean correlation to the upside, red values bellow the low band mean correlation to the downside.
Correlation means rising probability of capitulation (to the upside or to the downside) and is market by a white bar (as signal).
Important:
For a better interpretation, the Advance/Decline Line indicator should be used in conjunction with other indicators (volatility, volume, etc.).

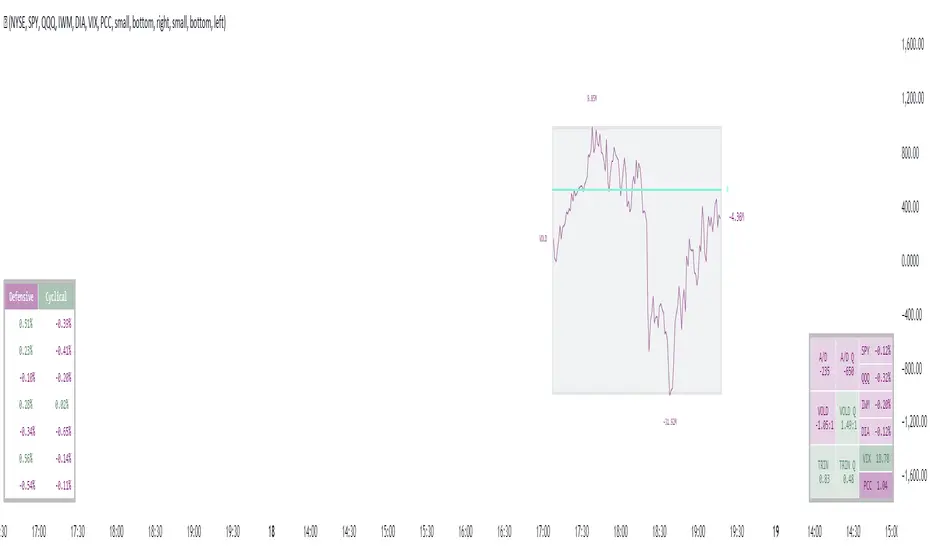
Tick PlusTick Plus
Tick+ is an all-in-one market internals dashboard.
Tick+ features a real-time NYSE or NASDAQ Tick chart, a dynamic Advancers/Decliners vs. VOLD chart, a market internals table readout including both NYSE and NASDAQ instruments, defensive and cyclical sector’s, and daily inflow/out analysis. Also included are customizable symbols readouts, so you can keep an eye on securities that are important to you!
The Tick chart displays a candlestick TICK chart for your chosen exchange and keeps track of the current day's high tick and low tick. Drawn behind these are our Key Reversal Zones.
The Advancers/Decliners vs. VOLD chart dynamically scales both instruments together to easily detect divergences that are known to cut the noise from the market and give an accurate indication of the day's trend.
Market Sync Indicator
This is a small but powerful indicator that analyzes the inflow and outflow of each exchange's underlying securities. When all the markets are in harmony, it will print a green or red symbol below the tick chart. We have also included this signal within the internals table labeled “trending,” which is simply the same signal presented in a more apparent area. Alerts can also be set with these signals to take advantage of the system across tickers.
Note: A gray readout indicates that every market is not moving in the same direction at that moment.
This indicator has been made to be customizable to fit your individual layout style! You are able to stack the Tick & Comparison Charts, as well as display the tables vertically or horizontally!
Note: We are measuring % change of symbols from the daily open to current price, this is so you can make an analysis based on today's info.
All of the default settings are our recommended settings.
Please check the Author Instructions Below for how to gain access to our indicators.
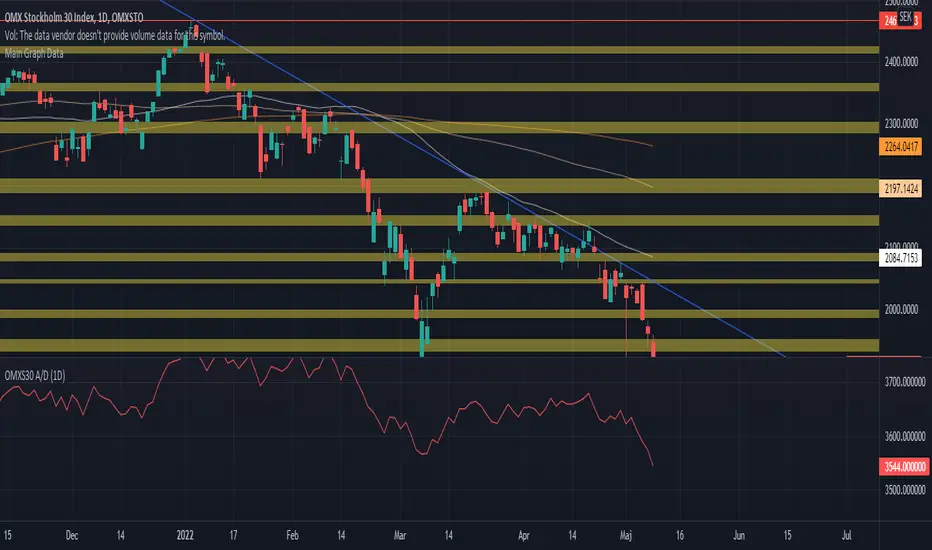
OMXS30 A/DThe script implements the Advance / Decline indicator (A/D) for the Swedish index OMXs30.
The logic for the script is implemented accordingly:
A/D = Ʃ (A - D)
A = Number of daily advancing stocks in the OMXS30 index
D = Number of daily declining stocks in the OMXS30 index
The stocks included in this script as part of the OMXs30 index was last updated 2022-05-09
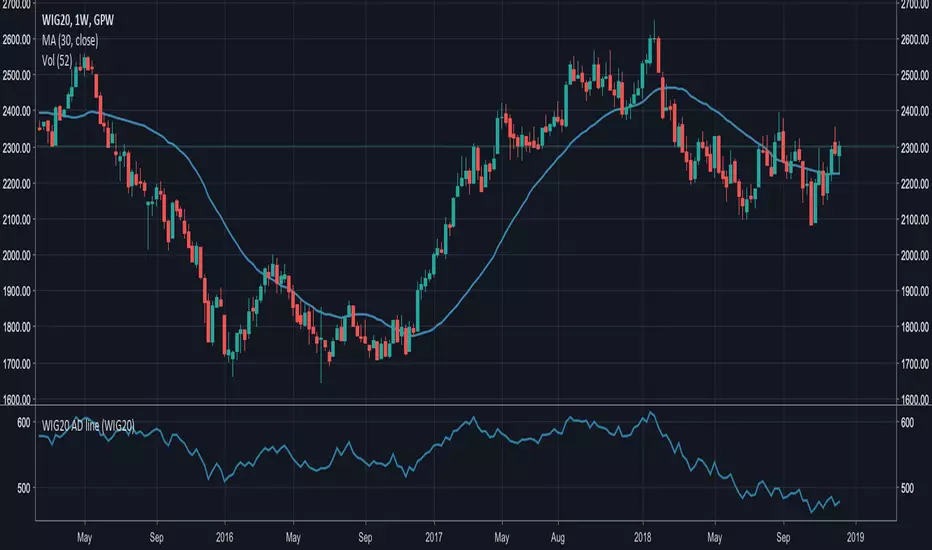
WIG20/30 Advance-decline LineAdvance-decline line for Warsaw Stock Exchange (GPW)
EN: Since GPW doesn't give us advance/decline data similar to NYSE, it's not hard to calculate it manually (WIG20 and WIG30 - can be changed in settings)
PL: Wskaźnik A/D line dla giełdy Warszawskiej (działa dla WIG20 i WIG30)
📊 Advanced Charts Suite v2.1 by 🇨🇷🇾🇵🇹🇴🇷🇹🇭🇾🇭🇲🇸📊With the advanced charts suite you get multiple indicators you can overlay on your charts, while only using one indicator slot.
🎁We made this after requests from our members, to assist those who use a free TV account. Its not advised to use them all at once, use them in combinations and see what works for you!
🕥 It can take a minute or more to load... be patient! I wanted to include more indicators, but hit some of the limits imposed by pine script. All options are off by default.
📊 Indicators Included are:
✅Ichimoku Cloud
✅Support Resistance Fractal
✅Trailing Long/Short Stoploss
✅Bull Bear Squares
✅Triple Hull Moving Average
✅Standard Hull Moving Average
✅Fibonacci Daily
✅Advance Decline Lines
👍If you enjoy the Charts Suite, please like the indicator, and follow me on TradingView!
💬Come chat with us in telegram (link in signature) if you have any questions or would like a trial of a premium indicators (linked below).
