DisplayPriceMoveThresholds-by-STTAEnglish
Name: DisplayPriceMoveThresholds-by-STTA
- This study shows symbols in chart where a defined price movement percent threshold between a configurabele range of current bar and historic bar is exceeded.
- This information can be used to backtest possible PUT and CALL strike distances for option trading.
- User can configure if rising or falling or both price movements shall be displayed.
- This study can be used with all symbols and all time periods.
- A Extended functionality can be selected, where all price movements will be displayed in chart
German
- Dieser Indikator zeigt im Chart Symbole an, wenn der Preis bestimmte konfigurierbare Prozent-Schwellen zwischen zwei Kerzen mit konfigurierbarem Abstand überschreitet.
- Diese Information kann beim Optionshandel nützlich sein, wenn passende Strike Abstände gewählt werden sollen.
- Der Benutzer kann konfigurieren, ob steigende, fallende oder beide Preisrichtungen ausgewertet werden sollen.
- Dieser Indikator kann für alle Symbole und Zeitperioden verwendet werden
- Eine erweiterte Funktion kann ausgewählt werden, wo alle Preisbewegungen mit Schwellen als zusätzlicher Linienchart gezeichnet wird.
Inputs
- displayed triangle symbols above or below candle in chart window
Settings/Parameter
- Resolution: defines the resolution for calculation
- Source: defines bar value as open, close, high, low
- Direction: specifies price direction
-- UP: evaluates only rising price movements
-- DOWN: evaluates only falling price movements
-- BOTH: evaluates rising and falling price movements
-- ALL: evaluates rising and falling price movements; additionally plots all percentage values and thresholds as linegraph in chart
- Up Threshold in %: Float value of rising price movement threshold in percent: Min Value:0.0
- Down Threshold in %: Float value of falling price movement threshold in percent: Max Value:0.0
Outputs
- Up Threshold Exceeded: triangle symbol in chart above bar
- Down Threshold Exceeded: triangle symbol in chart below bar
- ALL Output:
-- plot of all percentage values as linegraph in chart when Direction ALL is selected
-- Line Up Threshold: plot of Up Threshold horizontal line in chart when Direction ALL is selected
-- Line Down Threshold: plot of Down Threshold horizontal line in chart when Direction ALL is selected
If you are interested to obtain access to this indicator, please send me a message via Tradingview or Signature contact data below this description
Solltest Du Interesse für einen Zugriff auf diesen Indikator haben, sende mir bitte eine Nachricht über Tradingview oder meine Signatur Kontaktdaten unter dieser Beschreibung
[i]price

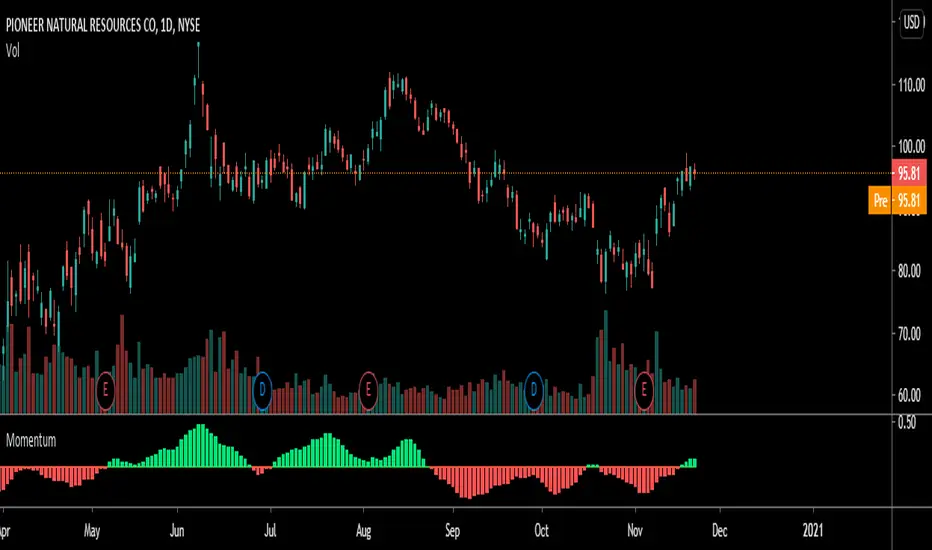
Price/Volume momentumThis indicator will help you measure when to keep adding on your longs and when to get out.
What you want to see is increasing price with increasing volume to keep adding.
You can also begin to enter a position that has changing momemtum, meaning the volume/price pair has stop going down and it's reversing.
I use this indicator with my volatility indicator and my Matrix indicator on the daily
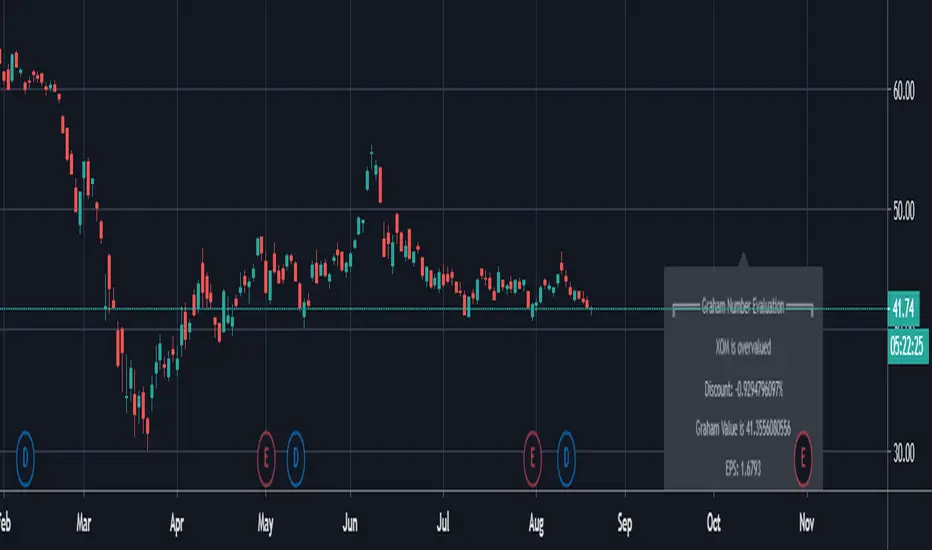
Real Value by AxbofReal Value is a measure of what an asset is worth. This measure is arrived at by means of an objective calculation or complex financial model, rather than using the currently trading market price of that asset.
In financial analysis this calculation method is used in conjunction with the work of identifying, as nearly as possible, the underlying value of a company and its cash flow.
By performing a calculation of the company's financials, however, the findings might show that the company is undervalued.
In the end, however, any such estimation is at least partly subjective. The analyst compares the value derived by this model to the asset's current market price to determine whether the asset is overvalued or undervalued.
In financial analysis, Real value by Axbof is the calculation of an asset's worth based on a financial model.
investors should keep in mind that the Real Price Calculation Result is only an estimate.
TÜRKÇE
Yatırımcı olarak sizler, bu indikatör tarafından hesaplanan değeri, hissenin aşırı değerli mi yoksa düşük değerli mi olduğunu belirlemek için varlığın cari piyasa fiyatı ile karşılaştırmak için kullanabilirsiniz.
Şirketin Net Varlık Değeri Hesaplanmakta (Kısa, Uzun Vadeli Borçlar ve Aktifler ile)
ardından Şirketin Ödenmiş Sermayesi ile oranının hesaplanması ile oluşturulan bir modelidir.
Hesaplanan Bu Değer, bir varlığın değerinin gerçek içsel ölçüsüdür. Bu ölçüme, o varlığın hali hazırda işlem gören piyasa fiyatını kullanmak yerine objektif bir hesaplama (mali ve finansal değerler) yoluyla ulaştım.
Finansal analizde bu İçsel Değer hesaplama yöntemi, bir şirketin temel değerini ve nakit akışını mümkün olduğu kadar yakın bir şekilde belirleme çalışmasıyla bağlantılı olarak kullanılır.
Bununla birlikte, şirketin mali durumunun bir hesaplamasını yaparak, bulgular şirketin değerinin düşük veya yüksek olduğunu gösterebilir.
Yatırımcılar, İçsel Hesaplama Sonucunun yalnızca bir tahmin olduğunu unutmamalıdır.

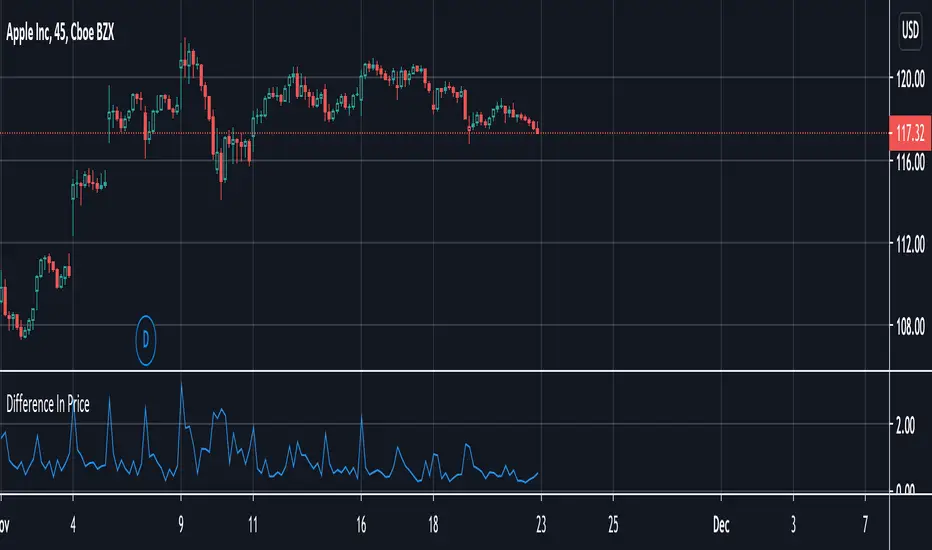
Difference In PriceWith the difference in price indicator, you can view price change volatility. Specifically, you can view the difference in price for a single candle segment, at any desired candlestick timeframe. This simply takes the sessions high minus the low and gives the difference. Difference in price trend lines help determine if a stock has a history of high volatility or not. This is useful for those looking to invest in stable stocks.
Market EmotionsThis is a simple and fun indicator I built out of boredom one night. It's great for a quick laugh, but other than that, it's useless. It simply displays emotes for various thresholds of change in price between the open and close of a candle. For example, unicorn candles are any candles that gain 25% or more from opening price to closing price.

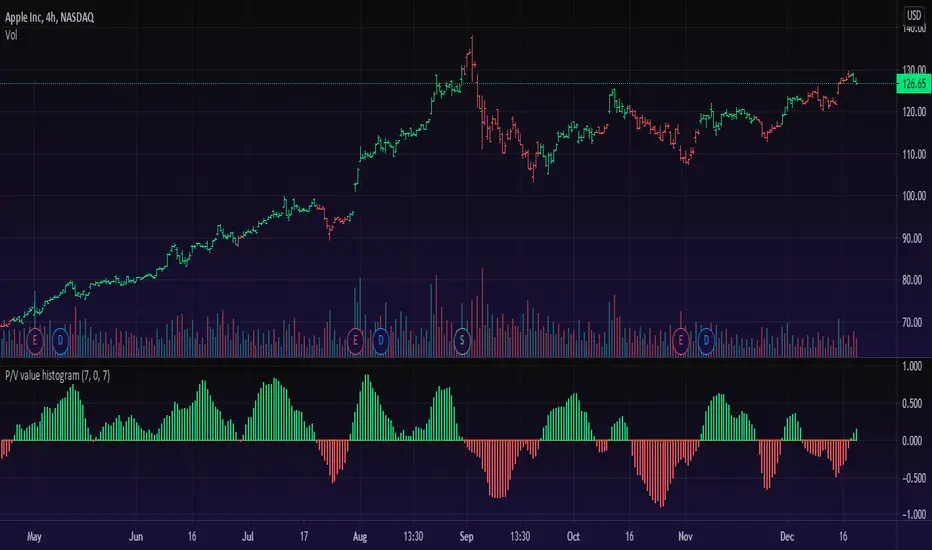
Price/Volume Value HistogramAn interesting implementation of mine to measure an asset changes based on asset price velocity and volume velocity. The indicator acts as asset value calculator. Long and Short.
==Points System Rules==
UPTRENDING
If Current Close is higher than previous Close and Current Volume is bigger than previous Volume: Adds Close Points and Volume Points
Otherwise check
If Current Close is higher than previous Close: Adds Only Close Points
DOWNTRENDING
If Current Close is lower than previous Close and Current Volume is bigger than previous Volume: Reduces Close Points and Volume Points
Otherwise check
If Current Close is lower than previous Close: Reduces Only Close Points
==Plotting==
Result of the values are summed up to a histogram.
Obviously on increasing prices and volume the histogram will be above zero line and on the Bullish side (green color), otherwise, on the Bearish side (red color).
You can't cheat the price movement, it's just what it is.
Optional to smooth it by EMA (set to true by default).
Like if you Like and Enjoy!
Follow for upcoming indicators.
Rise from All Time LowThis very simple script lets you see how much the asset rose from the All Time Low (ATL).
First, the ATL is calculated and plotted. Then, we measure the distance from ATL and current bar close.
Two labels are plotted :
ATL label
Current close label with rise and rise
It can be useful for penny stocks trading when you want to buy lows but must see how much the price rose last bars to improve entries.
For example, SQBG is actually "only" at x 1.85 from ATL (not an advice in investment) :
If you have ideas to complete or improve this script, let me know in comments ;)

Renko MTF - Traditional and ATRSomehow there aren't too many renko bars that have the traditional setting built-in so I put one up. This one has the option to choose between Traditional and ATR, the size number corresponds to the option that was chosen. And just in case if anyone wanted, I put up a multi-time frame option to choose the time frame the bars take place. D is for day, W is for week, flat numbers are in minutes, and leaving it blank looks at the current time frame the chart is in. The calculation comes from how Tradingview handles renko bars.
Renko bars don't paint a color unless the market moves a certain amount based on its settings. When the market moves up it turns green, if it moves down it turns red, simple color changes alone can say a lot. They're a good way to try to find trends somewhat objectively and seem to be a good way to eliminate time and can replace other time-based indicators that can whipsaw or lag. The bars have a tendency to repeat themselves so it's a good way to find trends. There aren't too many settings for the box size, most people either just choose 5, 10, 14, etc where as other indicators have many options that differ on different markets. The numbers can be chosen easily enough to pick a sweet spot with just a single input where other indicators such as MACD have multiple inputs to pick the right number that can make it difficult to choose from(although it won't be as precise as a MACD would sometimes but can be worth the objectiveness and consistency and same setting repeatability in different markets in my opinion). Some example strategies could be to use them as an alternative trailing stop, finding trends, a simple color change for entry and exit on top of other strategies, etc. It can do the job of many in an all in one price action type indicator(although not better all the time, it can come close enough). Despite all this, it does seem to depend on which time-frame it's being looked at, how TV does the calculation for it, and how one can use this with the lack of practical information on it out there.

ATR TRex [ipooya]To appreciate dear Mr.Khakestar efforts I have converted his mt4 ATR formula to pine script. All credits go to him.
you can view the ATR result of each candle in the past:
The first black number is the ATR of the M1 chart.
The second black number is the ATR of the M5chart.
The third black number is the ATR of the M15 chart.
The fourth black number is the ATR of the H1 chart.
The fifth black number is the ATR of the H4 chart.
The sixth black number is the ATR of the Daily chart.
The seventh black number is the ATR of the Weekly chart.
**and the second number of every line is live ATR ( current ATR candle)
What makes this ATR formula so different?
This formula invented by Mr.Khakestar and it shows the power of the price to move in each cycle of the chart. We can use it in RTM strategy and Price Action trading. To learn how to use it you need to learn TRex strategy (Presented by Mr.Khakestart for free in Persian).

Backwards price projection - few bars ahead reverse chartEver wondered what the chart would look like if it's flipped upside down and flipped horizontally into the future? The idea is that when there is a trend, a repeating pattern tends to occur. Going backwards and projecting that movement into the future can supposedly show what the future price will be.
Somehow I haven't found anyone try it like this and I am currently trying to find a way to use a reversed moving average or plot of some kind to project further ahead. TV at the moment does not allow offsets on candle plot(as far as I know) and I am only allowed a certain number of plots to go on the chart, so I put as many price moves ahead as I could to project the future price. It's a bit sloppy with all those forced plots but it gets the job done. I'll see if I can improve it with a moving average or something and possibly make a strategy out of it in the future.

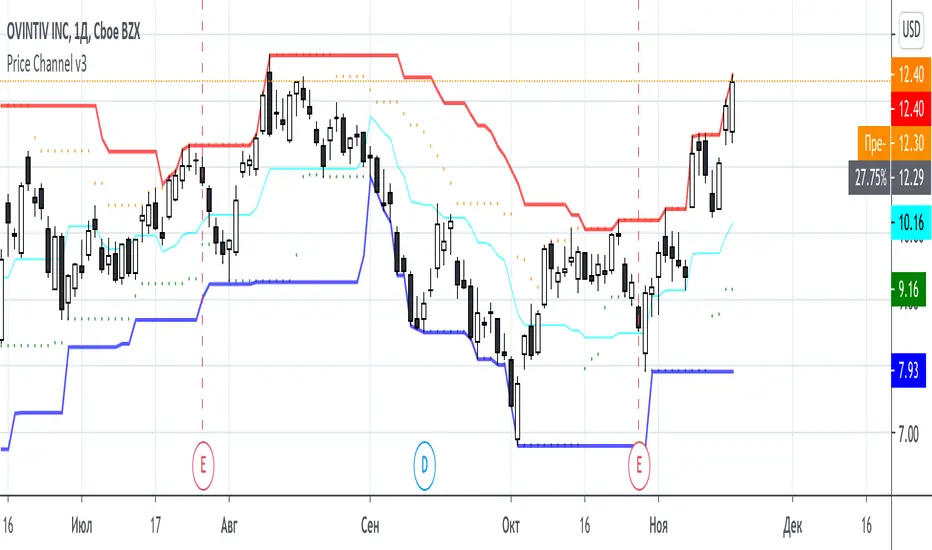
[blackcat] L2 Price Envelope TrackerLevel: 2
Background
Price envelopes sare shown at a set percentage above and below a moving average. They are used to indicate overbought and oversold levels and can be traded individually or in conjunction with a momentum indicator.
Function
L2 Price Envelope Tracker is an innovative indicator that use customized envelope of price to disclose overbought and oversold periods. With this function, long and short entries can be further developped in this pine script.
Key Signal
sma5 --> typical price moving average line
resistance --> upper envelope as resistance line
support ---> lower envelope as support line
Pros and Cons
Pros:
1. easy observe overbought and oversold zone
2. disclose exact long and short entries in overbought and oversold zones
Cons:
1. Only applicable for the trading pairs that support financial() functions. crypto/xau/xag/indice are not applicable
2. Need to tune r1 and s1 for different trading pairs
Remarks
NA
Readme
In real life, I am a prolific inventor. I have successfully applied for more than 60 international and regional patents in the past 12 years. But in the past two years or so, I have tried to transfer my creativity to the development of trading strategies. Tradingview is the ideal platform for me. I am selecting and contributing some of the hundreds of scripts to publish in Tradingview community. Welcome everyone to interact with me to discuss these interesting pine scripts.
The scripts posted are categorized into 5 levels according to my efforts or manhours put into these works.
Level 1 : interesting script snippets or distinctive improvement from classic indicators or strategy. Level 1 scripts can usually appear in more complex indicators as a function module or element.
Level 2 : composite indicator/strategy. By selecting or combining several independent or dependent functions or sub indicators in proper way, the composite script exhibits a resonance phenomenon which can filter out noise or fake trading signal to enhance trading confidence level.
Level 3 : comprehensive indicator/strategy. They are simple trading systems based on my strategies. They are commonly containing several or all of entry signal, close signal, stop loss, take profit, re-entry, risk management, and position sizing techniques. Even some interesting fundamental and mass psychological aspects are incorporated.
Level 4 : script snippets or functions that do not disclose source code. Interesting element that can reveal market laws and work as raw material for indicators and strategies. If you find Level 1~2 scripts are helpful, Level 4 is a private version that took me far more efforts to develop.
Level 5 : indicator/strategy that do not disclose source code. private version of Level 3 script with my accumulated script processing skills or a large number of custom functions. I had a private function library built in past two years. Level 5 scripts use many of them to achieve private trading strategy.

Moving Average of Upper and Lower Wicks with optional smoothingIn the book, The New Technical Trader by Tushar Chande and Stanley Kroll there is a part that talks about candlestick analysis and how the wicks play a role on how the price will behave. When wick lengths increase then there could be uncertainty. Weakening of support and resistance levels can also be seen by the size of the candlestick wicks or shadows. Shoutouts to Mango2Juice from Tradingview and the The Academy of Forex for helping me out in making this and providing the moving averages function.
When combined with other indicators or strategies, I find that this increases their accuracy when used correctly. For those that believe in price action, this might be worth a try. The book has only a brief section on candlestick wicks but it is one of the most interesting ideas I found. The book likes to include a simple moving average in its indicators with a certain length to provide a smoothing type of effect or a sort of extra indicator for the other to be above to give off quicker signals at the cost of accuracy. For this indicator it acts as a smoothing type effect which I put in because it is hard to see the slope and direction of where the moving averages of the wicks are going. The type of moving averages to use and the correct lengths are questionable and are not explained well in the book. If anyone can figure out a good use for this or know better settings or tips, please let me know.

LER - Law of Effort vs ResultsLaw of Effort vs Results is a tool to find the price changes based on volume.
This tool shows that if there is a high volume occur but the price has small difference in one candle, this will trigger a 'spike'. This spike represents that a high activity has occurred but the price did not reflect as the volume changes.
The analogy of this tool can be represented as we drive a car on a steep hill: despite we hit the gas harder, the car just slightly move higher.

Candle-BB-MovesToday I propose a simple indicator to get an idea of market sentiment
Color distinctions are as follows
-White background = Bollinger Band Squeezed
-Purple columns = Total candle length wick to wick
-Lime columns = Green candle body length
-Red columns = Red candle body length
-Yellow columns = Wick to wick size higher than the previous candle by defined %, this si changeable in setting, default value 1.5%
-Lime "-" = Price above Bollinger Band basis
-Red "-" = Price bellow Bollinger Band basis
-Lime "_" = Price above Bollinger Band upper level
-Red "_" = Price below Bollinger Band lower level
As one can tell, this indicator is good at identifying trending and squeezed areas of price action. It can also give you early hint at unusual price movements and if you can get this bias then it is easier to take trade
Please note that this indicator is not meant to trade independently and would work best with combinations of S/R.
Past performance does not indicate future success, this is meant to be an educational purpose only and the author takes no responsibility of your profit or loss.

Position CalculatorThis script calculates how much cryptos or dollars you have to bet with 4 variables : Risk Loss , Leverage, Entry and Stop Loss.
When you want to open a position, just complete the parameters and the script will tell you how much you have to bet in dollars or cryptos units, depending the way you're trading.
Note : don't foreget that you have to pay fees on exchanges whose are not included here, specially with high leverage trades.

Fast ROI checker 50% Gann RetracementThis script is based on the Gann's 50% Retracement rule.
First, the ATH (All Time High) and ATL (All Time Low) are calculated; then, the 50% retracement level is found.
With this 50% level, we'll calculate the maximum price entry to keep a ROI which is set in the parameters.
For exemple, I only want to buy assets which can make a x16 before the 50% retracement , the script will calculate the maximum entry to respect this ROI .
If the Max entry price is above the ATL , the line will be green; if not, the line will be red.
To faster the search in the watchlist, when the price is between the Max Entry line and the ATL line, the background is painted in green.
It's not an investment strategy, you have to find your proper indicators to make purchases.
Enjoy !

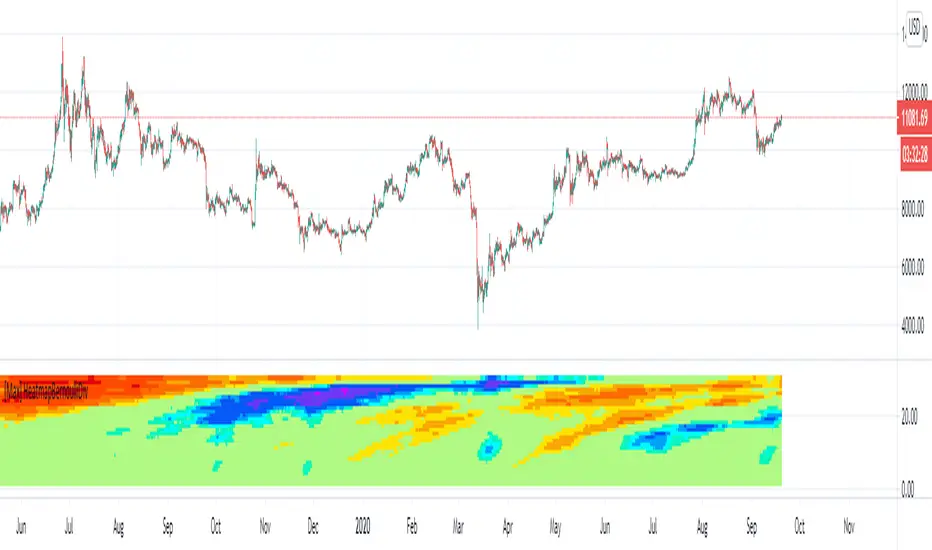
[Max] Volume Entropy Divergence HeatmapA divergence between volume and price indicator, based on custom filter function.
Each lines represent a length on wich the divergence is calculated. It goes to 60 len a the base to 2000 at the high. ( You have to decrease the timeframe if your looking on a new chart).
Colors represent a level of the oscillator who is calculated for each lengths.
What can you find, reversals, confirmation of continuation, divergences between volume and price,.. (if you find other usages I will be happy to hear it and share the code).
I recommand to be attentive to lower timeframes and confirm with higher ones and be attentive between different kind of clouds there is.
You are in charge to figure out how to use it, if you have some doubts on something you can DM me but I will not teach my way to use it.
It provide for me nice transformations, nice enough to share this indicator in private.
Big thanks to @midtownsk8rguy for the heatmap color function.
Have a nice daytrading all !
Gann-Fun-price-SquaresThis needs no explanation, this is the secrete system that has made many millionaires - By selling courses and indicators of course -I jest
This was just a fun project, that doesn't mean it was not geared towards tradable S/R generation. People who use Gann and Murrey methods will find this useful, others can marvel at it or lol at it, it's all good.
The author takes no responsibility for your profit or loss, this was fun and educational purpose project only.
Have fun :3

Slippage Calculator Hello everyone,
This is the first script I publish, also my English is not the best my apologies.
This simple study script is an attempt to estimate the slippage during a trade. By no means it is a precise calculation, it is just an approach that can be improved.
You are welcome to take this simple script and use it and change it at your convenience just ask your acknowledge.
My approach considers the total fluctuation the price gets as a consequence for the total volume on that specific bar.
The volume on each bar is given in BTC, thus you get that by using the formula.
vol = volume * vwap
The total variation in price is considered as twice the size of the bar plus the gap between to consecutive bars. that is the
total fluctuation of price on each bar = (2 * (high - low) + abs(open - close )) which is not totally true since inside each bar price can fluctuate a lot more.
The script considers you are trading your total equity (eq_BTC ) each time. The fraction of your equity of the volume bar is eq_BTC / vol
Then eq_BTC / vol is the portion or the total fluctuation in price that is due to your entry or exit from the market.
(2 * (high - low) + abs(open - close )) * eq_BTC / vol
is the average change in price due you enter o exit a position.
** the 2 factor accounts for the two directions in the market buying and selling. There is more behind this formula I can explain you in more detail if you like.
I haven't seen anywhere a formula like this one, so it is intended to be a first attempt to get a better approach.
Finally the output of the scripts is how many ticks the price might change due to your trade on each bar
round(slippage/syminfo.mintick)
The script is focused in crypto but it can be used as well on forex markets.
Take care,
@yvponce

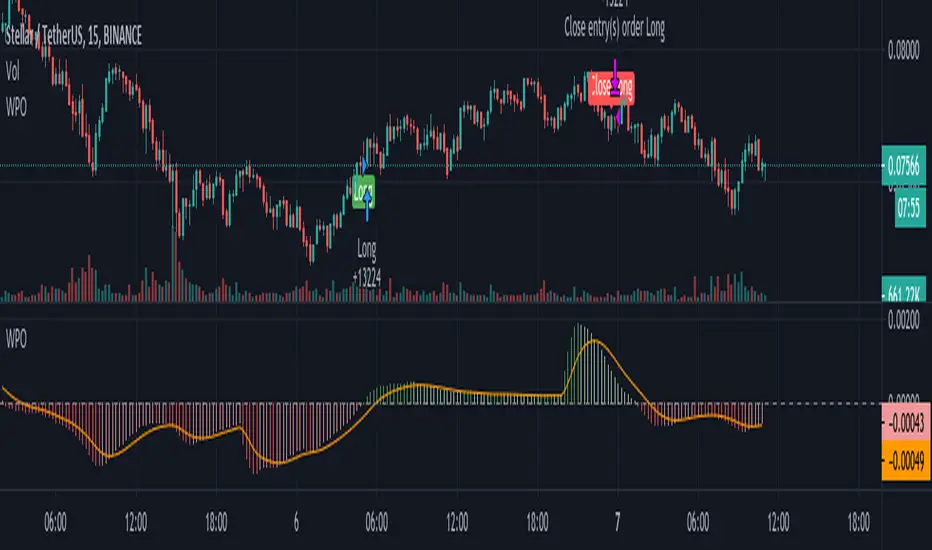
Weighted Price OscillatorThis is the study version of the Weighted Price Oscillator (STRATEGY) indicator.
Weighted Price Oscillator is an unique indicator that shows the relationship between two custom variables that trigger signals upon specific conditions. When WPO (short for weighted price oscillator ) crosses over the signal or zero line, it creates a buy signal and conversely below the signal or zero line, it generates a take profit signal. All of which are provided that the specific conditions are met.
Inside the script's options, the following options are: signal sensitivity, enable signal background color, and take profit percentage. The signal sensitivity allows you to adjust the script's trigger sensitivity, so that the script can fire signals appropriate for a specific timeframe. Enabling signal background color will provide a visual on the oscillator when a buy or take profit signal is being created. And lastly, the take profit percentage option is for configuring the trade size percentage of which you want to take profit with.
PM me for access.
3 MA w price slope The MA is indicating historical cost on the market.
This script will help you observe MA with price and slope.
This stript is inspired by LEI & LoneCapital.
All thanks to LEI.

Graham FormulaThis is an Tradingview implementation of the Grahams Formula as described in Benjamin Grahams book "The Intelligent Investor".
In theory this can be used to screen for over- and undervalued stocks, however as Graham himself notes, you should look into other fundamentals when using them in conjunction with Grahams formula.