Market Flow Indicator
This is a forked and even simpler version of the premium indicator Trend Volume RSI Analysis. Please, read its description on my profile page so that you can understand what changes have been made here and why.
Although in Trend Volume RSI Analysis you have only one parameter to configure (length), you need to choose between 3 options for the analysis - Trend, Volume, or RSI. You also have an option to highlight the buy and sell zones. For me, this is a lot of switching. Alternatively, if I want to see the whole picture, I have to apply the indicator twice or even three times, which limits the space on my screen for the candlestick chart. However, a lot of work has gone into creating that indicator and it works great. If it isn't broken, why fix it, right?
So, I forked Trend Volume RSI Analysis and modified some of the formulas, as well as effectively combined the Trend and the RSI parts into one simpler indicator. No more switching. Also, the Buy and Sell colors change based on crossovers. No more zones either.
WHAT DOES THIS INDICATOR DO ?
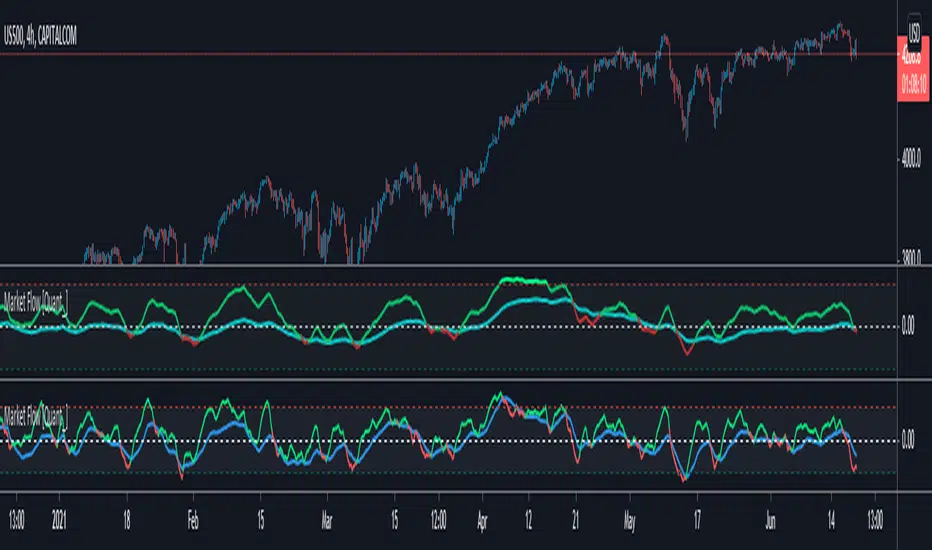
Market Flow Indicator shows two things - price direction (blue line) and momentum (green line). In the first screenshot below the indicator is applied to the 1h chart of SPX500 to show direction and on the second screenshot I use a 1h chart of BTC/USD in which you notice divergence, formed as a result of exhausted momentum. The indicator works equally well with cryptocurrencies, indices, commodities, and currency pairs.
The line colored in green and red is a modified RSI and the blue line is called Momentum (those are their names for now, but please check the updates below if anything has changed). Their colors are configurable in the settings panel.
In order to standardize the numbers without any modifications to the formulas, the RSI numbers are brought down by 50. In other words, the equivalent of an RSI overbought extreme (100) is 50 in the Market Flow Indicator, and the equivalent of an oversold extreme (0) is -50 in this indicator. Default lines here are set at 25 and -25, which are the equivalent of 75 and 25 respectively.
That's pretty much it. The idea behind Market Flow Indicator was to be super simple and to be used with minimum configuration if any at all. Once you get a grasp of it, it shouldn't take you more than a few seconds to know if you should stay flat or look for a long/short position.
HOW MUCH DOES IT COST ?
Although this may look like a simple indicator, I have spent a great deal of time testing and optimizing it to achieve this level of simplicity and practicality. Also, I will continue to update Market Flow Indicator as well as introduce user-requested features if they will improve its overall performance. For these reasons, this is a paid indicator, but I do give a free trial so that you can test it out for yourself. If you want to gain access, please use the provided information below or just message me. Thank you for your time.
Disclaimer: The purpose of all indicators is to indicate potential setups, which may lead to profitable results. No indicator is perfect and certainly, no indicator has a 100% success rate. They are subject to flaws, wrongful interpretation, bugs, etc. This indicator makes no exception. It must be used with a sound money management plan that puts the main emphasis on protecting your capital. Please, do not rely solely on any single indicator to make trading decisions instead of you. Indicators are storytellers, not fortune tellers. They help you see the bigger picture, not the future.
✔️ Set the source for generating the indicator (default changed from "close" to "hlc3"
✔️ Set generic length (the only option available in the previous version)
✔️ Momentum Smoothing MA (choose between 9 different moving averages)
✔️ Momentum Smoothing Length
✔️ RSI Smoothing MA (same as above)
✔️ RSI Smoothing Length
✔️ Better UI as the different indicators are separated into sections
https://ibb.co/m0yX95K
In other words, you now have way more freedom in configuring the indicator according to the security and time frame that you trade on.
Skript nur auf Einladung
Ausschließlich Nutzer mit einer Erlaubnis des Autors können Zugriff auf dieses Script erhalten. Sie müssen diese Genehmigung bei dem Autor beantragen. Dies umfasst üblicherweise auch eine Zahlung. Wenn Sie mehr erfahren möchten, dann sehen Sie sich unten die Anweisungen des Autors an oder kontaktieren Sie Quant_ direkt.
TradingView empfiehlt NICHT, für die Nutzung eines Scripts zu bezahlen, wenn Sie den Autor nicht als vertrauenswürdig halten und verstehen, wie das Script funktioniert. Sie können außerdem auch kostenlose Open-Source-Alternativen in unseren Community-Scripts finden.
Hinweise des Autors
Haftungsausschluss
Skript nur auf Einladung
Ausschließlich Nutzer mit einer Erlaubnis des Autors können Zugriff auf dieses Script erhalten. Sie müssen diese Genehmigung bei dem Autor beantragen. Dies umfasst üblicherweise auch eine Zahlung. Wenn Sie mehr erfahren möchten, dann sehen Sie sich unten die Anweisungen des Autors an oder kontaktieren Sie Quant_ direkt.
TradingView empfiehlt NICHT, für die Nutzung eines Scripts zu bezahlen, wenn Sie den Autor nicht als vertrauenswürdig halten und verstehen, wie das Script funktioniert. Sie können außerdem auch kostenlose Open-Source-Alternativen in unseren Community-Scripts finden.