PROTECTED SOURCE SCRIPT
Aktualisiert LA_Periodic_Fibonacci Levels
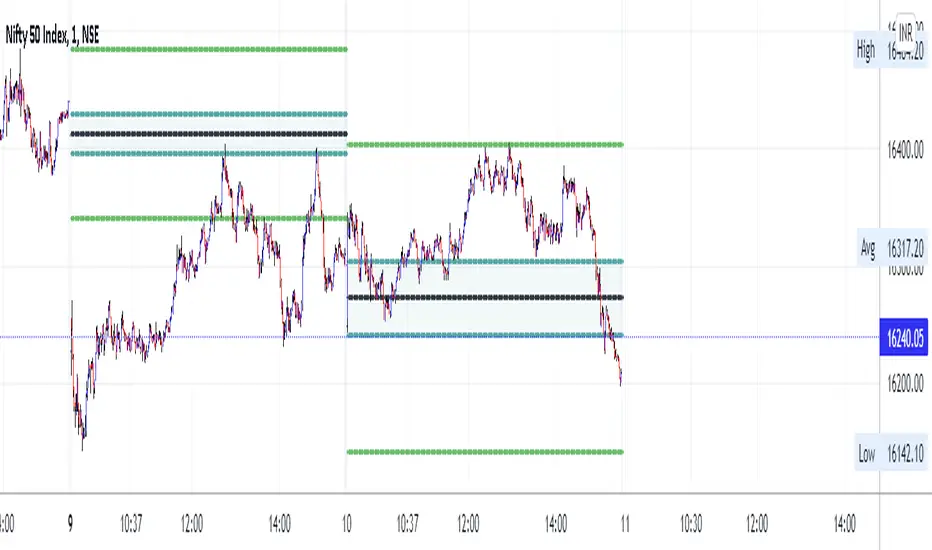
This indicator is used to plot the previous high and low of the chosen timeframe along with the Fibonacci levels of 0.50, +/- 0.618 and +/- 0.786.
Provision is given to plot levels for three different time frames at a time.
Options are given to select/unselect the levels as per the user requirement. For plotting the Fibonacci levels of a specific period, user has to select the option "TF1_Fib" or "TF2_Fib" or "TF3_Fib" along with the respective levels (50, +/- 0.618, +/- 0.786).
User has to add different time frames in their layout which can then be used in the drop down menu. By default, daily, weekly and monthly time frames are given.
Indicator is plotted as the candle progresses and not plotted for future time frames in advance.
Below are few examples on larger timeframes.
BTCUSD on 1 min TF (timeframe)

BTCUSD on Daily TF

DJI on Daily TF

Provision is given to plot levels for three different time frames at a time.
Options are given to select/unselect the levels as per the user requirement. For plotting the Fibonacci levels of a specific period, user has to select the option "TF1_Fib" or "TF2_Fib" or "TF3_Fib" along with the respective levels (50, +/- 0.618, +/- 0.786).
User has to add different time frames in their layout which can then be used in the drop down menu. By default, daily, weekly and monthly time frames are given.
Indicator is plotted as the candle progresses and not plotted for future time frames in advance.
Below are few examples on larger timeframes.
BTCUSD on 1 min TF (timeframe)
BTCUSD on Daily TF
DJI on Daily TF
Versionshinweise
We have included the 1.272 and 1.618 levels for projections. User can select the levels accordinglyNifty50 on a Daily chart with indicator for 12 months
Nifty50 on 1min chart with indicator for 1 hour
Geschütztes Skript
Dieses Script ist als Closed-Source veröffentlicht. Sie können es kostenlos und ohne Einschränkungen verwenden – erfahren Sie hier mehr.
@aravindleo_45
Haftungsausschluss
Die Informationen und Veröffentlichungen sind nicht als Finanz-, Anlage-, Handels- oder andere Arten von Ratschlägen oder Empfehlungen gedacht, die von TradingView bereitgestellt oder gebilligt werden, und stellen diese nicht dar. Lesen Sie mehr in den Nutzungsbedingungen.