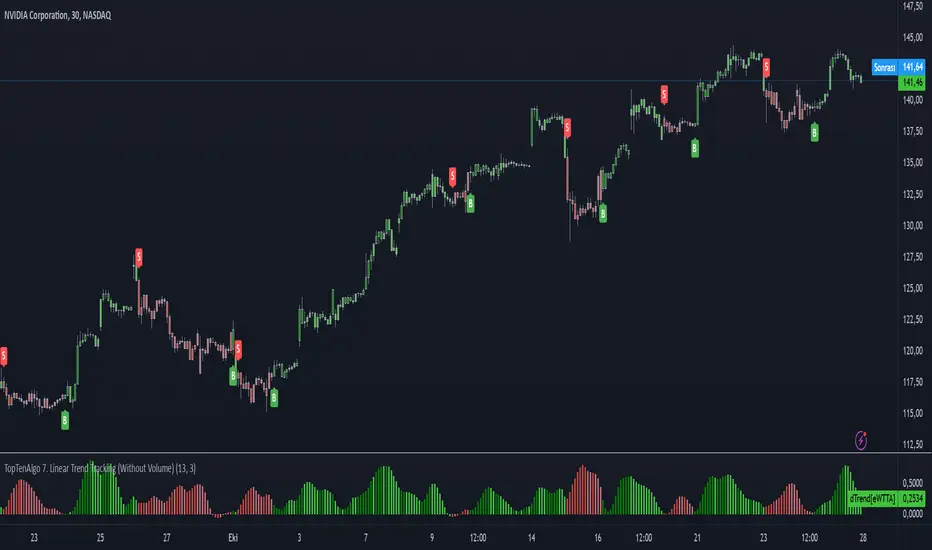
TopTenAlgo 7. Linear Trend Tracking (Without Volume & Coloring)

Dogrusal Trend Takipcisi is used in conjunction with Gosterge Trend. Both indicators are for approval of each other. While the Indicator looks at Logarithmic to prices, It looks at Linear. Although its mathematical function is stuck between two trend lines like Gösterge Trend, the Dogrusal Trend Takipcisi can also be used as the main histogram, the absolute value of the difference between the trend and the down trend line .
If the uptrend line is larger than the downtrend, histogram bars are light green or dark green areas. When the bullish trend line now crosses the down trend line , the bar is dark green. When the up trend line is larger than the down trend line and the up trend line increases, the bars also become dark green. This tendency starts to keep getting stronger. If the bullish trend line is larger than the bearish trend line but decreases, the bars are light green. This is when the bullish trend loses strength, So, Uptrend is weakening.
If the downtrend line is larger than the bullish trend line , a negative occur, and the bars become red or light red. If the bearish trend line has exceeded the bullish trend line or the value is increasing, the bar is in red. If the bearish trend line is larger than the bullish trend line but the value is decreasing, the bars are light red. This comes when the downward trend is losing power. So, Downtrend is weakening. For symbols for which the Volume Indicator cannot be read.
This algorithm is prepared with Top10Algo ...
TR: Doğrusal Trend Takipçisi Gösterge Trendle ile beraber kullanılır. Her iki göstergede birbirinin onayını almak içindir. Gösterge Trend fiyatlara logaritmik bakarken, Doğrusal Tren Takipçisi Linear bakar. Matematiksel fonsiyonu Gösterge Trend gibi iki trend çizgisi arasına sıkışmış olsada Doğrusal Trend Takipçisi ayrıca ana histogram olarak gösterilen yukarı trend ve aşağı trend çizgisi arasındaki farkın mutlak değerini linear olarak hesaplayarak momentumun gücünü ölçer ve size zayıflayan trendleri haber eder.gösterir.
Yukarı trend çizgisi aşağı trendden büyükse (bu nedenle pozitif hareketi gösterir), histogram çubukları açık yeşil veya koyu yeşil olacaktır. Artış trendi çizgisi şimdi aşağı trend çizgisini geçtiğinde, çubuk koyu yeşil olacaktır. Yukarı trend çizgisi aşağı trend çizgisinden daha büyük olduğunda ve yukarı trend çizgisi arttığında çubuklar da koyu yeşil olur. Bu eğilimin güçlenmeye devam ettiği anlamına geliyor. Yükseliş trendi çizgisi düşüş trendi çizgisinden büyükse ancak azalıyorsa, çubuklar açık yeşil olacaktır. Bu yükseliş eğiliminin güç kaybettiği anlamına gelir.Yani yükseliş trendi zayıflıyordur.
Düşüş trendi çizgisi yükseliş trendi çizgisinden büyükse, olumsuz bir eğilim oluşur ve çubuklar kırmızı veya açık kırmızı olur. Düşüş trendi çizgisi yükseliş trendi çizgisini aştıysa veya değer artıyorsa, çubuk kırmızı olacaktır. Düşüş trendi çizgisi yükseliş trendi çizgisinden büyükse, ancak değer azalıyorsa, çubuklar açık kırmızı olacaktır. Bu düşüş eğiliminin güç kaybettiği anlamına gelir. Yani düşüş trendi zayıflıyordur. Hacim Göstergesinin okunamadığı semboller içindir.
Bu algoritma Top10Algo ile beraber hazırlanmıştır...
Added Alerts and Signal
Skript nur auf Einladung
Ausschließlich Nutzer mit einer Erlaubnis des Autors können Zugriff auf dieses Script erhalten. Sie müssen diese Genehmigung bei dem Autor beantragen. Dies umfasst üblicherweise auch eine Zahlung. Wenn Sie mehr erfahren möchten, dann sehen Sie sich unten die Anweisungen des Autors an oder kontaktieren Sie nFinans direkt.
TradingView empfiehlt NICHT, für die Nutzung eines Scripts zu bezahlen, wenn Sie den Autor nicht als vertrauenswürdig halten und verstehen, wie das Script funktioniert. Sie können außerdem auch kostenlose Open-Source-Alternativen in unseren Community-Scripts finden.
Hinweise des Autors
Join Our Discord Community: discord.com/invite/c9bwqrKxm3
Indicators Tuttorial:
youtube.com/watch?v=rSwz1ISU9r0&list=PL6r4M5EOm1fMCJZxE7RDafk-DnrxLJY5y
Haftungsausschluss
Skript nur auf Einladung
Ausschließlich Nutzer mit einer Erlaubnis des Autors können Zugriff auf dieses Script erhalten. Sie müssen diese Genehmigung bei dem Autor beantragen. Dies umfasst üblicherweise auch eine Zahlung. Wenn Sie mehr erfahren möchten, dann sehen Sie sich unten die Anweisungen des Autors an oder kontaktieren Sie nFinans direkt.
TradingView empfiehlt NICHT, für die Nutzung eines Scripts zu bezahlen, wenn Sie den Autor nicht als vertrauenswürdig halten und verstehen, wie das Script funktioniert. Sie können außerdem auch kostenlose Open-Source-Alternativen in unseren Community-Scripts finden.
Hinweise des Autors
Join Our Discord Community: discord.com/invite/c9bwqrKxm3
Indicators Tuttorial:
youtube.com/watch?v=rSwz1ISU9r0&list=PL6r4M5EOm1fMCJZxE7RDafk-DnrxLJY5y