PROTECTED SOURCE SCRIPT
1H / 1D / 1W Çoklu Zaman Ölçekli Destek–Direnç (Reg Kanal Özeti)
Multi-Timeframe Regression Channel — Support & Resistance Map
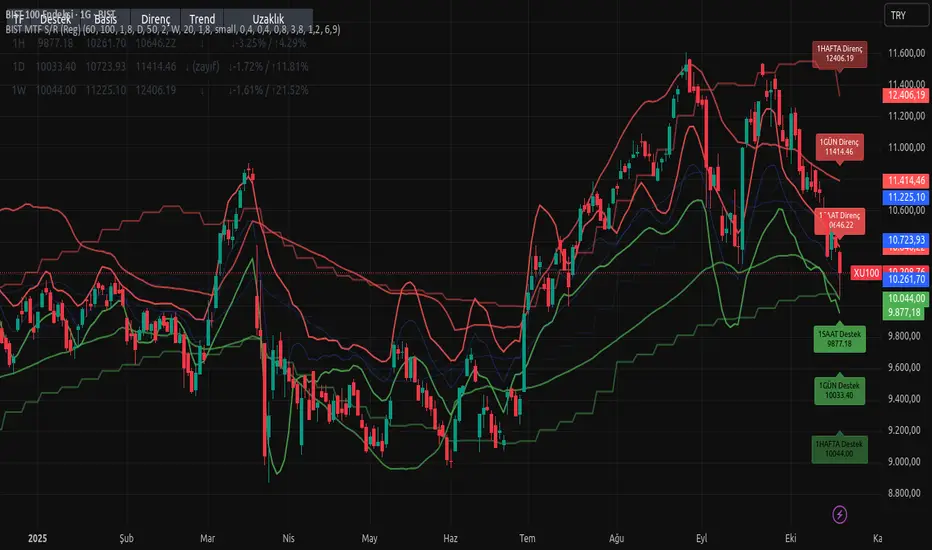
This indicator automatically plots regression-based support and resistance levels for three major timeframes — 1H (short-term traders), 1D (swing traders), and 1W (long-term investors) — all displayed on the same chart.
It combines linear regression channels and standard deviation offsets to reveal the active trend and volatility structure across multiple time horizons.
Each timeframe includes:
Upper band (Resistance) — potential selling or overextension zone
Basis line (Regression mean) — fair-value trend midpoint
Lower band (Support) — potential accumulation or reaction zone
A summary table in the top-left corner shows current levels, slope direction (↑ / ↓ / →), RSI-based strength notes, and percentage distances to each band.
All levels auto-update with the latest data, regardless of the chart timeframe.
Ideal for:
Multi-timeframe confluence analysis
Swing trading setups and breakout confirmations
Trend-following or mean-reversion strategies
✅ Tip:
When price holds above the lower band, the structure remains bullish.
A clean break above resistance often signals momentum continuation, while a close below support can mark a trend weakening.
Geschütztes Skript
Dieses Script ist als Closed-Source veröffentlicht. Sie können es kostenlos und ohne Einschränkungen verwenden – erfahren Sie hier mehr.
Haftungsausschluss
Die Informationen und Veröffentlichungen sind nicht als Finanz-, Anlage-, Handels- oder andere Arten von Ratschlägen oder Empfehlungen gedacht, die von TradingView bereitgestellt oder gebilligt werden, und stellen diese nicht dar. Lesen Sie mehr in den Nutzungsbedingungen.