Adaptive Trend [StabTrading]
💡 Features
- EMA-Based Trend - The Adaptive Trend Indicator is grounded in the EMA, providing a reliable foundation for tracking market trends.
- Adaptive Values - The indicator’s values change dynamically based on money flow, allowing it to adjust to market conditions automatically.
- Designed for Longer Trades - This tool is specifically designed to keep traders in trades for extended periods, maximizing potential profits.
- Automated Algorithm - The fully automated nature of this indicator ensures that it adapts without manual intervention, making it user-friendly and efficient.
- Pre-Trend Flip Signals - Traders can utilize this indicator to spot entry and exit points before a trend reversal, offering a strategic advantage in trade timing.
📈 How to Use the Adaptive Trend Indicator
The Adaptive Trend Indicator is designed to help traders identify potential entry and exit points by observing the relationship between price and the trend line. Generally, the price should follow the trend line's momentum. However, when the price deviates from the trend line, this indicates a divergence in momentum, signalling a potential trading opportunity.
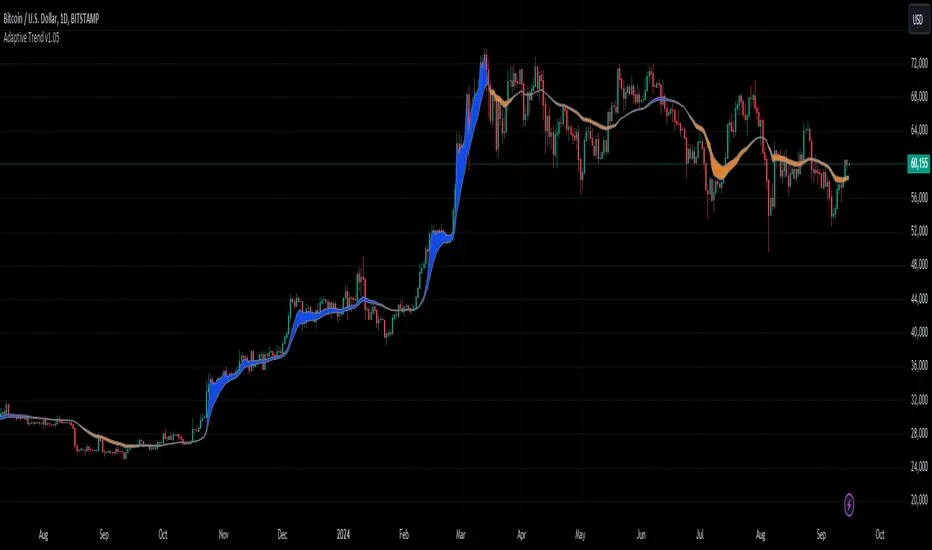
Monitor the Trend Line - Pay attention to the color and flatness of the trend line. A blue trend line indicates bullish momentum, while a yellow trend line signals bearish momentum. When the trend line starts to flatten, it suggests that the current momentum is weakening. This is the time to watch for price deviations from the trend line as potential trade signals.
🛠️ Usage/Practice
- As the downward trend begins to lose momentum, the trend line flattens and shows early signs of money flow moving up. This flattening indicates a potential shift in market sentiment, suggesting that a reversal may be on the horizon.
- The trend line changes to blue, indicating a bullish shift in momentum. Since the price is close to the trend line, this serves as a strong confirmation to enter a long trade. The proximity to the trend line offers a favourable risk-to-reward ratio.
- The trend line begins to level out, signalling a potential slowdown in momentum. Notice how the price starts to deviate from the trend line. As price rises above the trend line, this presents an opportunity to take partial profits or initiate a covered sell position.
- The price briefly dips below the blue trend line, and the trend itself remains flat, indicating the bullish trend’s resilience. As the trend line stays blue, this suggests that the upward momentum remains intact, and the dip may be temporary, offering another potential entry point.
- Despite the trend line flattening, the price continues to respect the trend, suggesting that the uptrend has not exhausted itself. This continuation implies that the bullish trend is still likely to persist.
- The trend line flips, signalling a clear end to the previous upward trend. This flip is a strong indication that the bullish momentum has been fully exhausted, and a reversal may be in progress. Notice how the price has respected the trend line as it flips.
- The trend line has shifted to yellow, signalling downward price action. As the trend begins to flatten and shows signs of moving upward again, traders should wait for the price to cross above the trend line. This crossing could indicate a safer entry point for a sell trade, as the market may still be in a bearish phase.
- The price drops sharply below the trend line, but the trend itself remains relatively stable, suggesting that the downward momentum may not be as strong as the price action suggests. This discrepancy signals an opportune moment to take profits and potentially enter a buy position.
- The price is not aligning with the trend line, suggesting the market may be trending sideways. The trend currently shows bullish momentum, but it lacks strong upward acceleration, and the price is significantly above the trend line. This weakening momentum indicates a potential area to consider a sell trade. Similar to point 8, the lack of acceleration and the distance from the trend line suggest that the upward movement may be losing strength.
- While the trend remains in a downward (yellow) phase, it begins to rise without flipping to blue. This suggests that upward momentum is weak. As the price significantly deviates above the trend line, traders might consider entering a new sell trade, as the upward movement within a downward trend could indicate a temporary correction rather than a full reversal.
🔶 Conclusion
The Adaptive Trend allows traders to maintain their positions longer while providing strategic entry and exit points before trends fully reverse. As part of a comprehensive trading system, this indicator is particularly valuable for those looking to capitalize on subtle shifts in market momentum. By following its guidelines and signals, traders can better align their strategies with market dynamics.
Skript nur auf Einladung
Ausschließlich Nutzer mit einer Erlaubnis des Autors können Zugriff auf dieses Script erhalten. Sie müssen diese Genehmigung bei dem Autor beantragen. Dies umfasst üblicherweise auch eine Zahlung. Wenn Sie mehr erfahren möchten, dann sehen Sie sich unten die Anweisungen des Autors an oder kontaktieren Sie StabTrading direkt.
TradingView empfiehlt NICHT, für die Nutzung eines Scripts zu bezahlen, wenn Sie den Autor nicht als vertrauenswürdig halten und verstehen, wie das Script funktioniert. Sie können außerdem auch kostenlose Open-Source-Alternativen in unseren Community-Scripts finden.
Hinweise des Autors
Haftungsausschluss
Skript nur auf Einladung
Ausschließlich Nutzer mit einer Erlaubnis des Autors können Zugriff auf dieses Script erhalten. Sie müssen diese Genehmigung bei dem Autor beantragen. Dies umfasst üblicherweise auch eine Zahlung. Wenn Sie mehr erfahren möchten, dann sehen Sie sich unten die Anweisungen des Autors an oder kontaktieren Sie StabTrading direkt.
TradingView empfiehlt NICHT, für die Nutzung eines Scripts zu bezahlen, wenn Sie den Autor nicht als vertrauenswürdig halten und verstehen, wie das Script funktioniert. Sie können außerdem auch kostenlose Open-Source-Alternativen in unseren Community-Scripts finden.