OPEN-SOURCE SCRIPT
Aktualisiert Matt Liq Lines
Indicator Overview
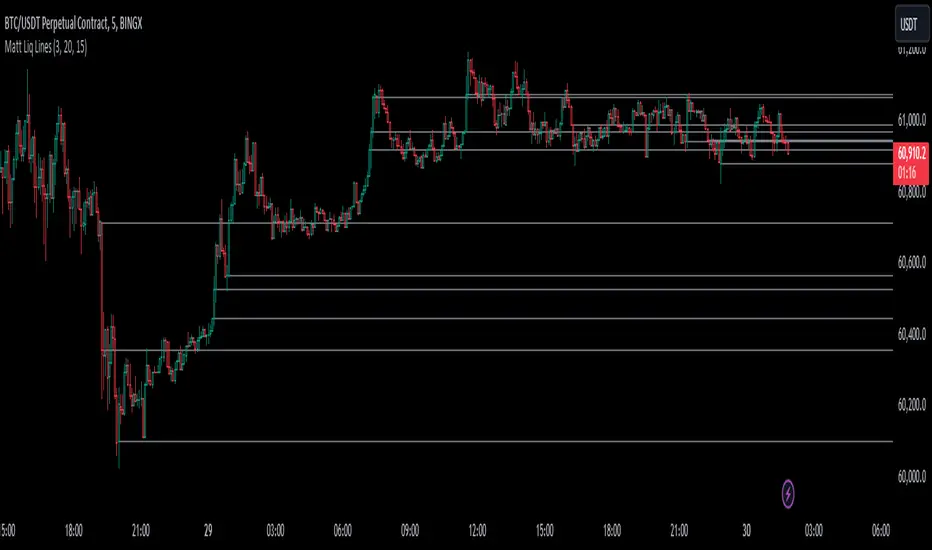
The "Matt Liq Lines" indicator is designed to help traders identify significant price levels where high-volume trading occurred. These levels are often referred to as liquidation levels and can act as support or resistance in the market. The indicator plots horizontal lines on the chart at these identified levels, helping traders make informed decisions based on volume spikes.
Key Features
Volume Multiplier: A user-defined threshold to identify high-volume candles. If a candle's volume is greater than the average volume multiplied by this multiplier, it is considered a high-volume candle.
Lookback Period: The period over which the average volume is calculated. This helps in smoothing out volume data to identify significant spikes.
Max Levels: The maximum number of liquidation levels to display on the chart. This helps in keeping the chart clean and focuses on the most relevant levels.
Indicator Components
Average Volume Calculation:
avgVolume = ta.sma(volume, lookbackPeriod)
Calculates the simple moving average (SMA) of the volume over the specified lookback period.
High Volume Identification:
highVolume = volume > (avgVolume * volumeMultiplier)
Identifies if the current candle's volume is greater than the average volume multiplied by the volume multiplier.
Liquidation Levels Storage:
Uses arrays to store the levels, their corresponding bar indices, and volumes.
Adding Liquidation Levels:
When a high-volume candle is identified, its open price is added as a liquidation level. If the maximum number of levels is exceeded, the oldest level is removed to make room for the new one.
Cleaning Levels:
A function f_clean_levels removes crossed levels (where the price has already moved above and below the level) and keeps the levels with the highest volumes.
Plotting Liquidation Lines:
Horizontal lines are drawn at the identified liquidation levels. These lines extend to the right and help traders visualize important price levels.
How to Use the Indicator
Set the Volume Multiplier: Adjust the volume multiplier to filter out minor volume spikes and focus on significant ones.
Adjust the Lookback Period: Set a lookback period that reflects the typical trading volume for the asset you are analyzing.
Configure Max Levels: Decide the number of levels you want to display on the chart to avoid clutter.
Interpret the Lines: Use the plotted lines as potential support or resistance levels. These lines indicate where significant trading activity has occurred, which could influence future price movements.
By following these steps and understanding the indicator's components, traders can effectively use the "Matt Liq Lines" indicator to identify key price levels influenced by high trading volumes, aiding in better decision-making
Versionshinweise
added colored lines, based on positioning of the liq level relative to price.added color themes for red/green + teal/purple
added touch & pass, touch & go, and other alerts
Open-source Skript
Ganz im Sinne von TradingView hat dieser Autor sein/ihr Script als Open-Source veröffentlicht. Auf diese Weise können nun auch andere Trader das Script rezensieren und die Funktionalität überprüfen. Vielen Dank an den Autor! Sie können das Script kostenlos verwenden, aber eine Wiederveröffentlichung des Codes unterliegt unseren Hausregeln.
Haftungsausschluss
Die Informationen und Veröffentlichungen sind nicht als Finanz-, Anlage-, Handels- oder andere Arten von Ratschlägen oder Empfehlungen gedacht, die von TradingView bereitgestellt oder gebilligt werden, und stellen diese nicht dar. Lesen Sie mehr in den Nutzungsbedingungen.