PROTECTED SOURCE SCRIPT
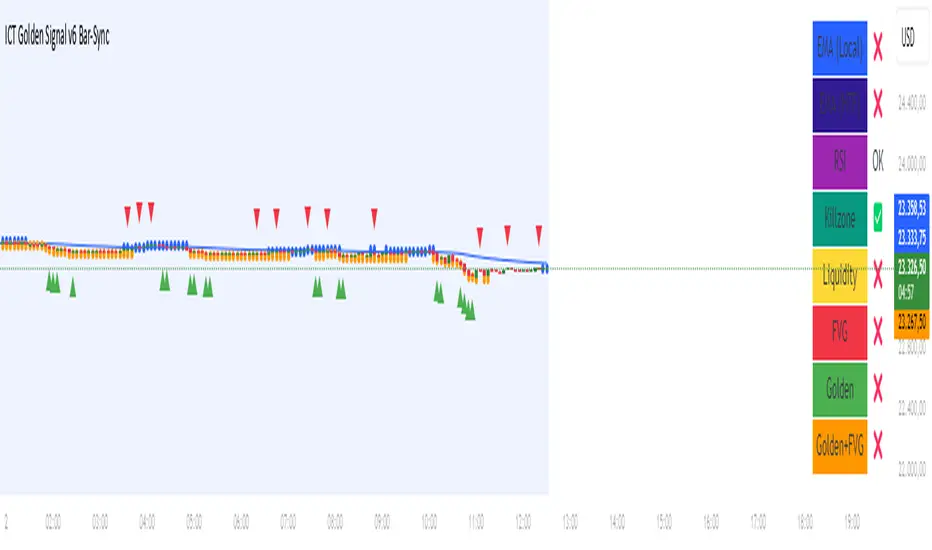
ICT Golden Signal v6 Bar-Sync
1️⃣ EMA (Exponential Moving Average)
Blue line: Local EMA (50 periods).
Dashboard: “EMA (Local)” → ✅ price above EMA, ❌ below EMA.
HTF EMA (1H): Shows higher timeframe trend, displayed in the dashboard.
Meaning:
Price above EMA → overall trend is up.
Price below EMA → overall trend is down.
2️⃣ RSI (Relative Strength Index)
RSI Overbought / Oversold levels: 70 and 30.
Dashboard:
OB → RSI is overbought
OS → RSI is oversold
OK → normal range
Meaning:
RSI crossing above OS → potential buy signal.
RSI crossing below OB → potential sell signal.
3️⃣ Equal High / Equal Low (Liquidity Levels)
Orange line: Equal Low (equal bottoms)
Blue line: Equal High (equal tops)
Yellow arrows / plotchar:
▲ Break below bottom → possible Stop Hunt Short
▼ Break above top → possible Stop Hunt Long
Meaning:
These are liquidity collection points in the market.
Stop Hunt may occur here → prerequisite for Golden Signal.
4️⃣ Fair Value Gap (FVG)
Green ▲ → FVG upward (buy opportunity)
Red ▼ → FVG downward (sell opportunity)
Dashboard “FVG” → ✅ price is within FVG, ❌ outside
Meaning:
Market often fills the price gap.
Golden Signal + FVG → strong entry opportunity.
5️⃣ Killzones
London: 03:00–05:00
New York: 08:30–10:30
Dashboard → ✅ trading session active, ❌ outside session
Meaning:
Strategy only generates signals during killzones.
Signals outside these times are ignored.
6️⃣ Entry and Golden Signals
B (green) → normal Long Entry
S (red) → normal Short Entry
★ (lime/maroon) → Golden Long / Short
🔥 (teal/purple) → Golden + FVG
Meaning:
Golden Signal → Stop Hunt + EMA trend + RSI conditions met.
Golden + FVG → top-level buy/sell opportunity, very strong signal.
7️⃣ Dashboard
Top-right table shows all indicator conditions at a glance:
EMA local / HTF
RSI status
Killzone status
Liquidity (Stop Hunt)
FVG status
Golden & Golden + FVG status
Benefit:
You can quickly see all information in one place instead of searching through the chart.
Summary
Trend determined by EMA.
Momentum checked with RSI.
Equal High/Low → liquidity and Stop Hunt points.
FVG → price gaps.
Killzones → signals only during certain hours.
Golden / Golden + FVG → strongest entry opportunities.
Dashboard → all signals and conditions at a glance.
Geschütztes Skript
Dieses Script ist als Closed-Source veröffentlicht. Sie können es kostenlos und ohne Einschränkungen verwenden – erfahren Sie hier mehr.
Haftungsausschluss
Die Informationen und Veröffentlichungen sind nicht als Finanz-, Anlage-, Handels- oder andere Arten von Ratschlägen oder Empfehlungen gedacht, die von TradingView bereitgestellt oder gebilligt werden, und stellen diese nicht dar. Lesen Sie mehr in den Nutzungsbedingungen.