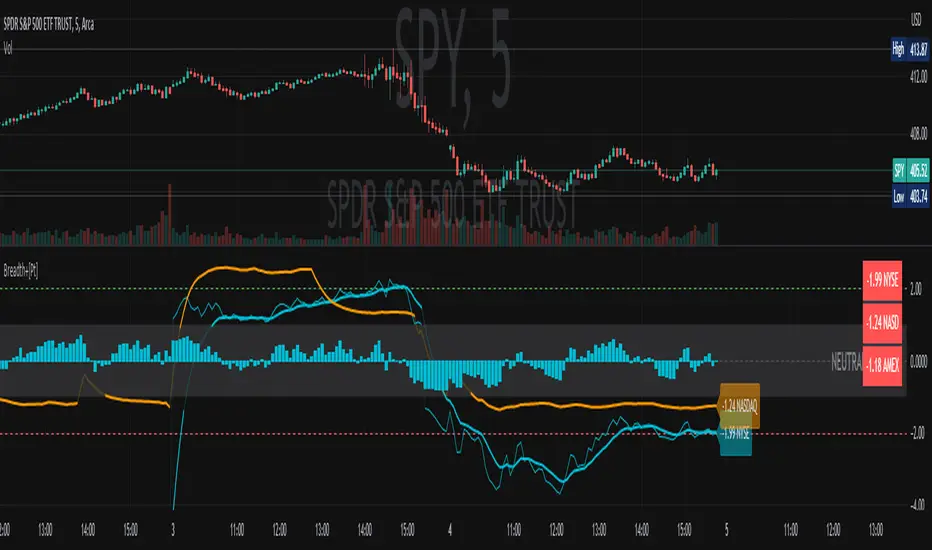
Market Breadth Ratio+ [Pt]

https://www.tradingview.com/script/5YFNhX0V-Market-Breadth-Ratio-Pt/
DESCRIPTION
The Market Breadth Ratio+ [Pt] indicator is a tool that can help traders gain a more comprehensive understanding of market breadth by providing a ratio between Up volume (UVOL) and Down volume (DVOL).
While the VOLD indicator provides a straightforward measure of the difference between UVOL and DVOL, it doesn't account for the rate of change. The Market Breadth Ratio+ [Pt] indicator, on the other hand, takes the rate of change into account, providing a plot line that is easier to interpret and understand.
The Up Volume vs Down Volume Ratios measure the strength of buying versus selling pressure in the market. A ratio greater than 1 indicates that there is more buying pressure, while a ratio less than -1 indicates more selling pressure. The ratio is calculated by dividing the total volume of stocks that closed up on the day by the total volume of stocks that closed down.
|| ------------------------------------------------------------------------------------------------------------------------------------------------------------------------------------||
This script includes the following premium unique features.
1) Custom Moving Average line for Breadth Ratio line. There are a few MA type to choose from: SMA, EMA, RMA, WMA, VWMA, HMA
- This feature provide a smoother plot for better interpretation of the market trend
- MA crossovers can also be used as trend reversal signals
2) Breadth Strength Index (BSI)
- This graph shows the relative strength of the Breadth Ratio. This is a momentum based oscillator that measure the rate of change of the Breadth Ratio. It shows the strength and weakness in the Breadth Ratio plot.
- A bar close to 1 means the market is very strong in the Bullish direction, conversely, a bar close to -1 means the market is very weak, but very strong in the Bearish direction
- Above 0 shows Bullish strength
- Below 0 shows Bearish strength
3) Two display modes for Breadth Strength Index
- Histogram
- Line
- These can be combined to show different markets together, such as NYSE and NASDAQ
4) Custom Moving Average can be applied to the BSI
- This will provide smoother graph for easier interpretation
https://www.tradingview.com/x/xlAmlimI/
5) Aggregated Market Strength
- This feature combines the BSI of multiple markets, such as NYSE and NASDAQ, to provide a more comprehensive view of the overall US market. Often time, one of these indices will have a stronger 'pull' on the entire market. By observing the dominant color (of your choosing), you can see which index is pulling the market. And by trading the market that has the bigger pull, traders can leverage on the possible higher volatility for greater trade opportunities.
6) Custom Moving Average can be applied to the Aggregated Market Strength
- This will provide smoother graph for easier interpretation
https://www.tradingview.com/x/MatmShWP/
7) Show alternating trend colors on Aggregated Market Strength
- This provides an intuitive view of the market strength that's based on market breadth ratio
https://www.tradingview.com/x/8w4UYNiH/
- Added Data Table location options
- Added Data Table orientation options
- Added TICK Data option onto Data Table
Skript nur auf Einladung
Ausschließlich Nutzer mit einer Erlaubnis des Autors können Zugriff auf dieses Script erhalten. Sie müssen diese Genehmigung bei dem Autor beantragen. Dies umfasst üblicherweise auch eine Zahlung. Wenn Sie mehr erfahren möchten, dann sehen Sie sich unten die Anweisungen des Autors an oder kontaktieren Sie PtGambler direkt.
TradingView empfiehlt NICHT, für die Nutzung eines Scripts zu bezahlen, wenn Sie den Autor nicht als vertrauenswürdig halten und verstehen, wie das Script funktioniert. Sie können außerdem auch kostenlose Open-Source-Alternativen in unseren Community-Scripts finden.
Hinweise des Autors
PayPal - paypal.me/PtGambler
You can reach me privately through my Discord Channel: discord.gg/WMQfaVGyQC
Haftungsausschluss
Skript nur auf Einladung
Ausschließlich Nutzer mit einer Erlaubnis des Autors können Zugriff auf dieses Script erhalten. Sie müssen diese Genehmigung bei dem Autor beantragen. Dies umfasst üblicherweise auch eine Zahlung. Wenn Sie mehr erfahren möchten, dann sehen Sie sich unten die Anweisungen des Autors an oder kontaktieren Sie PtGambler direkt.
TradingView empfiehlt NICHT, für die Nutzung eines Scripts zu bezahlen, wenn Sie den Autor nicht als vertrauenswürdig halten und verstehen, wie das Script funktioniert. Sie können außerdem auch kostenlose Open-Source-Alternativen in unseren Community-Scripts finden.
Hinweise des Autors
PayPal - paypal.me/PtGambler
You can reach me privately through my Discord Channel: discord.gg/WMQfaVGyQC