Nifty's Indicator
Use it in only in 3m and 1m timeframe. No other timeframe is to be used.
This indicator gives only sell signals on intraday basis.
When you apply this indicator on charts then you will see 2 things ploted there.
1. Barcolor
2. Background color
Barcolor :
We have use unique trend analysing tool in this indicator, which identifies price is in Uptrend or Downtrend. If price is in uptrend
then candle color will become GREEN and it will remain green until price comes in downtrend. In downtrend candle color becomes RED.
Background color :
We have observed that price behaves a certain way when it is in downtrend. So we try to catch that behaviour of Nifty and Banknifty .
And when ever we observe that behaviour, a red color background is formed in background. This red color background indicates user that
price may fall now.
HOW TO USE :
ENTRY => You should trade only on 3m timeframe. When you see a RED COLOR candle inside RED ZONE then take a SELL trade. That means red background
is indicating that price may fall and red color bar also indicating the same. And your entry should be in between 09:15-10:30 and 12:30-14:55.
This is the time slot when price is volatile.
EXIT => You exit when red zone ends or the trading day ends.
BACKTESTING :
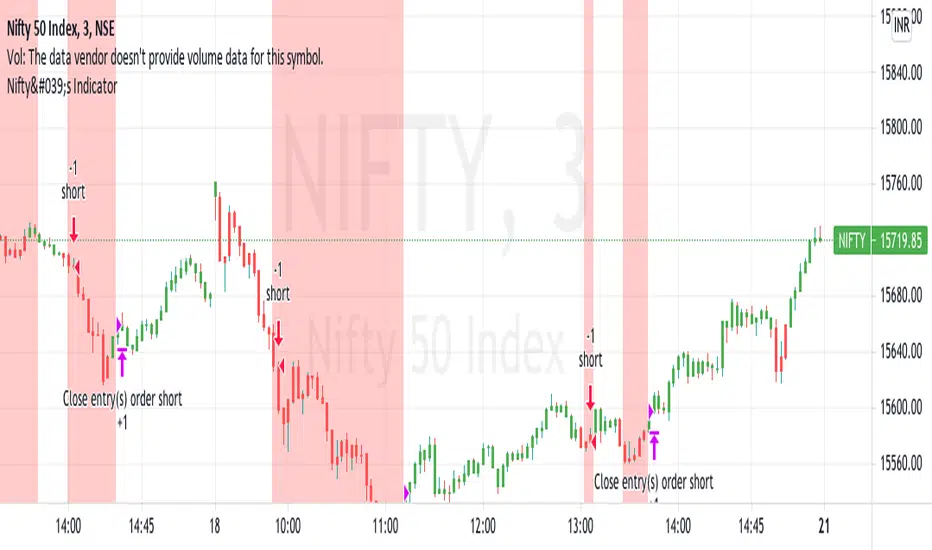
Based on these entry and exit conditions , we have backtested this strategy ( taking only 1 share when sell signal comes ). You can see down arrow on
chart when sell signals comes and uparrow when we exit from trade.
Use it in only in 3m and 1m timeframe. No other timeframe is to be used.
This indicator gives only sell signals on intraday basis.
When you apply this indicator on charts then you will see 2 things ploted there.
1. Barcolor
2. Background color
Barcolor :
We have use unique trend analysing tool in this indicator, which identifies price is in Uptrend or Downtrend. If price is in uptrend
then candle color will become GREEN and it will remain green until price comes in downtrend. In downtrend candle color becomes RED.
Background color :
We have observed that price behaves a certain way when it is in downtrend. So we try to catch that behaviour of Nifty and Banknifty .
And when ever we observe that behaviour, a red color background is formed in background. This red color background indicates user that
price may fall now.
HOW TO USE :
ENTRY => You should trade only on 3m timeframe. When you see a RED COLOR candle inside RED ZONE then take a SELL trade. That means red background
is indicating that price may fall and red color bar also indicating the same. And your entry should be in between 09:15-10:30 and 12:30-14:55.
This is the time slot when price is volatile.
EXIT => You exit when red zone ends or the trading day ends.
BACKTESTING :
Based on these entry and exit conditions , we have backtested this strategy ( taking only 1 share when sell signal comes ). You can see down arrow on
chart when sell signals comes and uparrow when we exit from trade.
Skript nur auf Einladung
Ausschließlich Nutzer mit einer Erlaubnis des Autors können Zugriff auf dieses Script erhalten. Sie müssen diese Genehmigung bei dem Autor beantragen. Dies umfasst üblicherweise auch eine Zahlung. Wenn Sie mehr erfahren möchten, dann sehen Sie sich unten die Anweisungen des Autors an oder kontaktieren Sie KapoorChandra direkt.
TradingView empfiehlt NICHT, für die Nutzung eines Scripts zu bezahlen, wenn Sie den Autor nicht als vertrauenswürdig halten und verstehen, wie das Script funktioniert. Sie können außerdem auch kostenlose Open-Source-Alternativen in unseren Community-Scripts finden.
Hinweise des Autors
+9911706040
IIT-Delhi
Haftungsausschluss
Skript nur auf Einladung
Ausschließlich Nutzer mit einer Erlaubnis des Autors können Zugriff auf dieses Script erhalten. Sie müssen diese Genehmigung bei dem Autor beantragen. Dies umfasst üblicherweise auch eine Zahlung. Wenn Sie mehr erfahren möchten, dann sehen Sie sich unten die Anweisungen des Autors an oder kontaktieren Sie KapoorChandra direkt.
TradingView empfiehlt NICHT, für die Nutzung eines Scripts zu bezahlen, wenn Sie den Autor nicht als vertrauenswürdig halten und verstehen, wie das Script funktioniert. Sie können außerdem auch kostenlose Open-Source-Alternativen in unseren Community-Scripts finden.
Hinweise des Autors
+9911706040
IIT-Delhi