PROTECTED SOURCE SCRIPT
LiqD HeatMap [RubiXalgo]
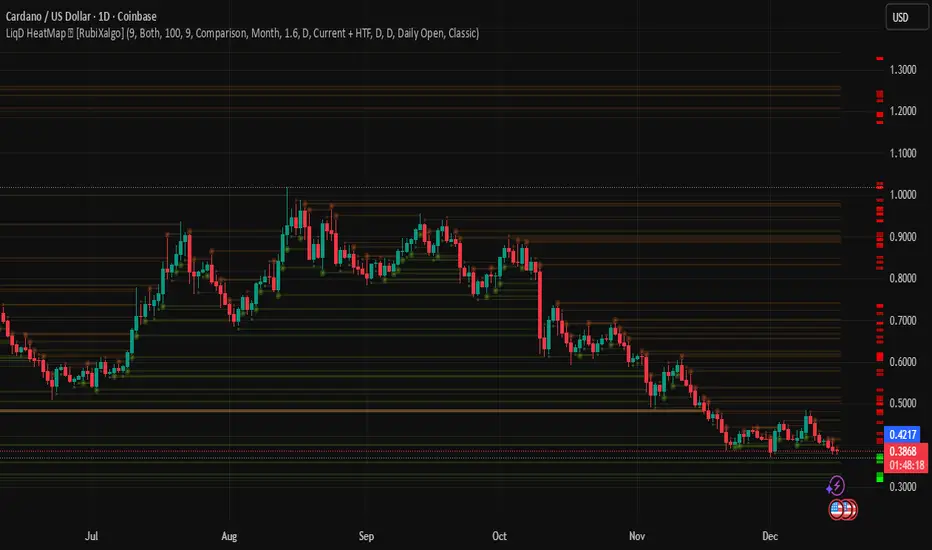
LiqD HeatMap 👑 [RubiXalgo] – Advanced Liquidation & Liquidity Visualizer
Discover potential liquidation zones with this powerful AI-enhanced heatmap indicator. It visualizes high-volume liquidity pools where price may attract or reverse, using dynamic bubbles, horizontal levels, and gradient colors for intuitive signals.
Key Features:
• Liquidation Heatmap Bubbles — Circles plotted above/below bars indicate potential long/short liquidation clusters. Larger/darker bubbles highlight stronger volume-based zones.
• Multi-Timeframe Liquidity Levels — Horizontal lines from 30min to Monthly timeframes (thicker/brighter for higher TFs) mark key support/resistance where liquidations often occur.
• Dynamic Color Gradients — Green/teal for bullish bias, red/purple for bearish, yellow/orange for max-volume hotspots. Adjustable intensity for clearer signals.
• Additional Tools:
- Customizable VWAP with ATR bands for directional bias.
- A.I. Volume Profit-Trend polyline predictions.
- Stochastic Money Flow & Bollinger Band Width percentages.
- Daily 0.618 Fibonacci Range Expansion projections.
• Filters & Customization — Market bias (Long/Short/Both), leverage scaling, dynamic lookback, and color themes (Classic or Crypto).
How to Trade with It:
Long Signals: Look for dark green bubbles below price or price bouncing/breaking thick green MTF levels → strong bullish liquidation potential.
Short Signals: Dark red bubbles above price or breakdowns of thick red levels → bearish liquidation zones.
Yellow/orange highlights max-volume areas often acting as magnets or reversal points.
Perfect for crypto, forex, or futures traders seeking volume-driven edge without clutter. 👑 Powered by RubiXalgo logic.
Geschütztes Skript
Dieses Script ist als Closed-Source veröffentlicht. Sie können es kostenlos und ohne Einschränkungen verwenden – erfahren Sie hier mehr.
Haftungsausschluss
Die Informationen und Veröffentlichungen sind nicht als Finanz-, Anlage-, Handels- oder andere Arten von Ratschlägen oder Empfehlungen gedacht, die von TradingView bereitgestellt oder gebilligt werden, und stellen diese nicht dar. Lesen Sie mehr in den Nutzungsbedingungen.