PROTECTED SOURCE SCRIPT
Aktualisiert GARO Lite - Free Regime Engine
GARO — Gamma Regime Engine
Overview
GARO (Gamma Regime Oscillator) is a visual regime engine that shows market conditions in real-time. This free edition is for educational and charting purposes only.
Key Features
Regime Detection: Highlights Expansion, Contraction, and Spike conditions using trend, volatility, and volume-based calculations.
Core and Bands: Central reference line with upper and lower bands.
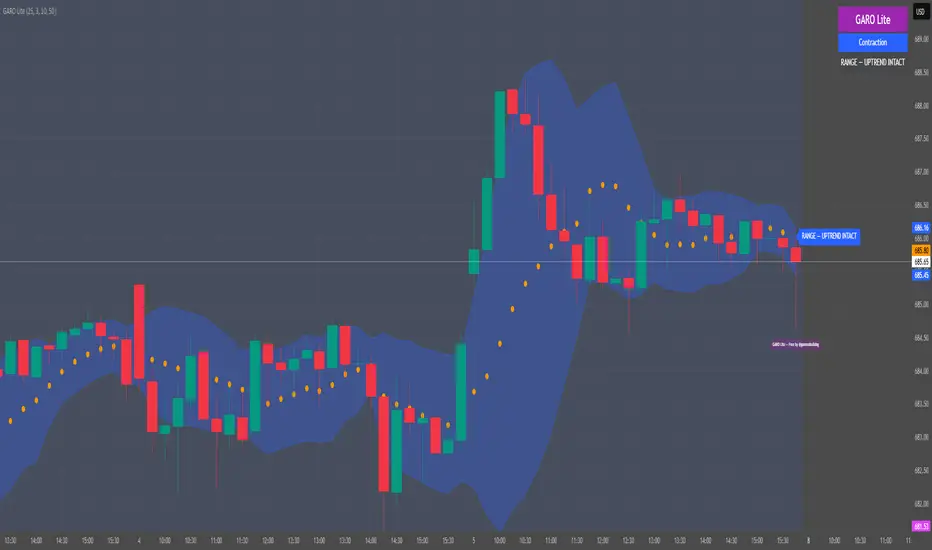
Visual Alerts: Orange dots appear under candles during compressions; background colors indicate current regime.
Signal Labels: Labels provide visual guidance based on regime and trend slope.
Gamma Exposure (GEX) Proxy & Zero Gamma Flip: Optional visual overlays for contextual awareness.
User Inputs: Some settings are visible in the input panel but are disabled in this free edition.
How to Use
Regime Colors:
Expansion (green background): Market trending/expanding; core line indicates direction.
Contraction (blue background): Market range-bound; orange dots indicate compression.
Spike (red background): High volatility; visual alert only.
Labels & Signals:
Labels highlight potential regime moves; not trade advice.
Combine colors, core/band positions, and label cues with your own analysis.
Core Line & Bands:
Core line shows central reference per regime.
Upper/lower bands provide context for potential support/resistance zones.
Orange Dots:
Indicate compressions or regime-specific signals; visual only.
Gamma Exposure & Zero Gamma Flip (Optional):
Illustrates potential price sensitivity; charting/educational use only.
Important:
Protected code; underlying calculations are not visible.
For educational and visual guidance only; not financial or trading advice.
Works on any timeframe; free edition gives visual regime insights.
Overview
GARO (Gamma Regime Oscillator) is a visual regime engine that shows market conditions in real-time. This free edition is for educational and charting purposes only.
Key Features
Regime Detection: Highlights Expansion, Contraction, and Spike conditions using trend, volatility, and volume-based calculations.
Core and Bands: Central reference line with upper and lower bands.
Visual Alerts: Orange dots appear under candles during compressions; background colors indicate current regime.
Signal Labels: Labels provide visual guidance based on regime and trend slope.
Gamma Exposure (GEX) Proxy & Zero Gamma Flip: Optional visual overlays for contextual awareness.
User Inputs: Some settings are visible in the input panel but are disabled in this free edition.
How to Use
Regime Colors:
Expansion (green background): Market trending/expanding; core line indicates direction.
Contraction (blue background): Market range-bound; orange dots indicate compression.
Spike (red background): High volatility; visual alert only.
Labels & Signals:
Labels highlight potential regime moves; not trade advice.
Combine colors, core/band positions, and label cues with your own analysis.
Core Line & Bands:
Core line shows central reference per regime.
Upper/lower bands provide context for potential support/resistance zones.
Orange Dots:
Indicate compressions or regime-specific signals; visual only.
Gamma Exposure & Zero Gamma Flip (Optional):
Illustrates potential price sensitivity; charting/educational use only.
Important:
Protected code; underlying calculations are not visible.
For educational and visual guidance only; not financial or trading advice.
Works on any timeframe; free edition gives visual regime insights.
Versionshinweise
Minor Code ChangeGeschütztes Skript
Dieses Script ist als Closed-Source veröffentlicht. Sie können es kostenlos und ohne Einschränkungen verwenden – erfahren Sie hier mehr.
Haftungsausschluss
Die Informationen und Veröffentlichungen sind nicht als Finanz-, Anlage-, Handels- oder andere Arten von Ratschlägen oder Empfehlungen gedacht, die von TradingView bereitgestellt oder gebilligt werden, und stellen diese nicht dar. Lesen Sie mehr in den Nutzungsbedingungen.
Geschütztes Skript
Dieses Script ist als Closed-Source veröffentlicht. Sie können es kostenlos und ohne Einschränkungen verwenden – erfahren Sie hier mehr.
Haftungsausschluss
Die Informationen und Veröffentlichungen sind nicht als Finanz-, Anlage-, Handels- oder andere Arten von Ratschlägen oder Empfehlungen gedacht, die von TradingView bereitgestellt oder gebilligt werden, und stellen diese nicht dar. Lesen Sie mehr in den Nutzungsbedingungen.