PROTECTED SOURCE SCRIPT
Exponential Smoothed RSI

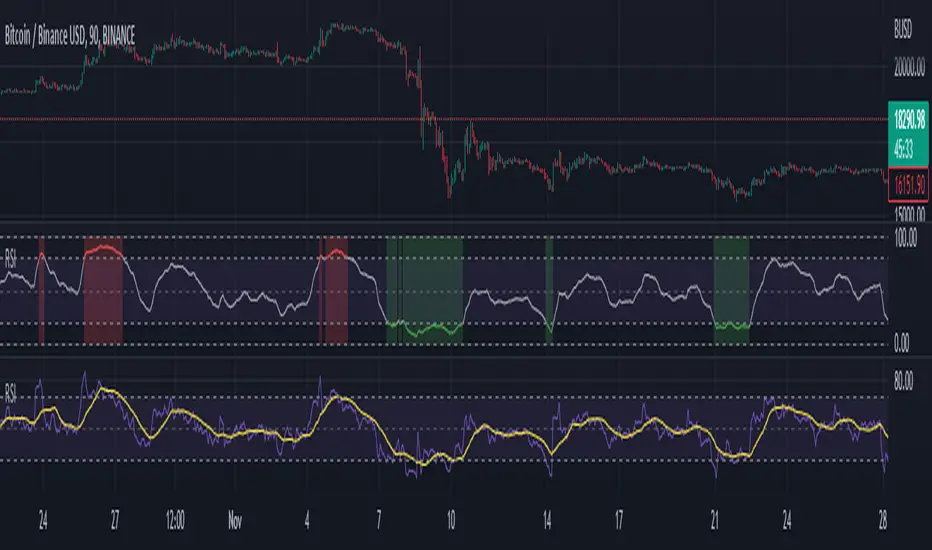
I wanted to create a custom RSI to get clearer signals, so I coded this. It is an RSI average (to prevent the classic RSI in and out oversold/overbought zones) that is approaching the 0 and 100 levels with an exponential math formula.
If the "RSI smoothing factor" input increases, the rsi gets easily closer to the 0 and 100 limits.
This RSI will never be lower than 0 or higher than 100, its smoothing is asymptotic to the limits levels
I also added the possibility to change timeframe if you need
Note: the image is a simple confrontation between built-in RSI and exponentially smoothed RSI
Geschütztes Skript
Dieses Script ist als Closed-Source veröffentlicht. Sie können es kostenlos und ohne Einschränkungen verwenden – erfahren Sie hier mehr.
Haftungsausschluss
Die Informationen und Veröffentlichungen sind nicht als Finanz-, Anlage-, Handels- oder andere Arten von Ratschlägen oder Empfehlungen gedacht, die von TradingView bereitgestellt oder gebilligt werden, und stellen diese nicht dar. Lesen Sie mehr in den Nutzungsbedingungen.