Price Reversal Probability + Price Forecast [TradeDots]
📝 HOW IT WORKS
The indicator provides two types of reversal signals:
- Bullish Reversal: Marked with a green label, indicating an expected upward market reversal.
- Bearish Reversal: Marked with a red label, indicating an expected downward market reversal.
⭐️ Computation
This tool identifies significant reversal patterns using a mathematical model on a designated window of candlesticks to calculate price action changes. It incorporates candlestick data and price indicators, such as the Open, Close, High, Low of candlesticks and Average True Range (ATR), to detect similar occurrences in real-time.
Potential market turning points are marked with reversal labels and percentage changes, calculated using pivot high or low price data from the last reversal patterns of the opposite side.
For example, a green label on the chart indicates a bullish reversal pattern, showing the market is expected to reverse upward. However, signals are based on historical price actions and are not 100% accurate. If the price breaks down from the bullish reversal pivot low, the original signal will turn half transparent until the next reversal pattern is detected.
The algorithm groups consecutive bullish reversal patterns until a bearish reversal pattern appears. The last bullish label occurrence indicates the maximum number of bullish patterns required to confirm a reversal in the group. This information is stored to apply Bayesian statistical models and probability models to generate market insights.
⭐️ Statistical Analysis
Reversal signals are categorized into bullish and bearish groups, with each group storing consecutive reversal signals.
In the indicator table, each new reversal is labeled sequentially (e.g., "🟢 #1" for the first bullish reversal after a bearish signal). The number increases for each new signal on the same side and resets when a reversal signal on the opposite side appears.
The indicator provides two forecasts: the probability of reversal and the expected price change if the pattern is successful or unsuccessful.
⭐️ Probability of Reversal
By counting the number of consecutive reversal patterns on one side before a reversal pattern on the opposite side appears, we can calculate the probability of reversal of each signal throughout the entire price action history.
Using Bayes’ Theorem, the probability increases with each consecutive pattern. The values are displayed in the first two columns of the indicator table, with the current condition highlighted in orange.
⭐️ Price Forecast
The price forecast uses the pivot point of the last reversal pattern of the opposite side as a reference for calculating the percentage change.
For example, for a group of bullish patterns, the pivot high of the most recent bearish pattern is taken. A percentage is calculated with the pivot low of all bullish patterns in the same group. Repeating this model throughout the entire historical price action patterns gives the average price percentage difference between all bearish and bullish patterns.
Whenever a new reversal pattern is detected, a price can be forecasted using the percentage difference from the statistical model. The target price is calculated and displayed in the third and fourth columns of the indicator table.
Assisting Traders To Make Data-Informed Trading Decisions
All included features in this indicator:
- Labeling of bullish and bearish reversal patterns
- Success probability of each reversal pattern
- Price targets of each reversal pattern
- Visual aid for pattern confirmation
- More (check the changelog below for current features)
🛠️ HOW TO USE
⭐️ Reversal Signals
There are two types of reversal signals identified by the algorithm that detects reversal patterns using price action analysis with candlestick data and price indicators. When the price breaks out from the labeled pivot, the label will turn half transparent.
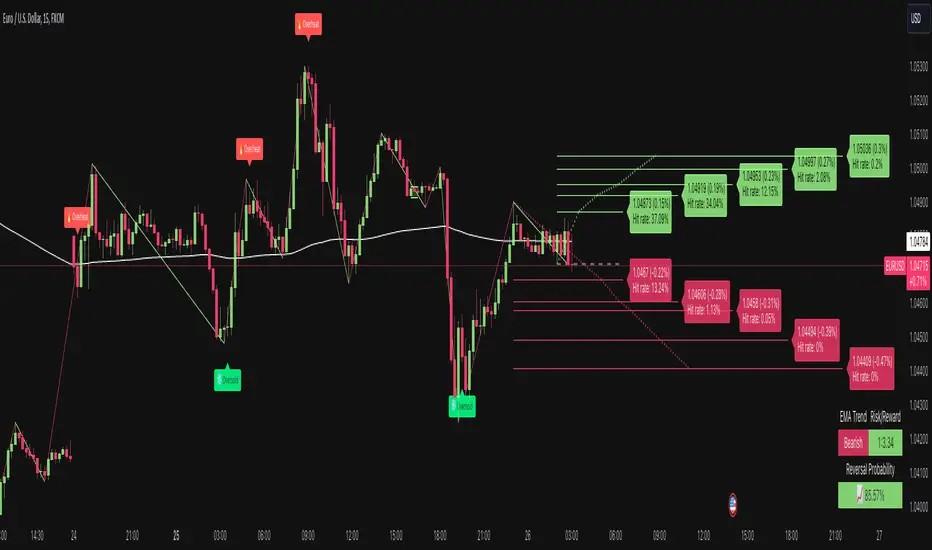
- Bullish reversal signals: Labeled in green. The number represents the price of the candlestick "low," and the percentage value indicates the price difference from the previous bearish reversal pattern's candlestick "high."
- Bearish reversal signals: Labeled in red. The number represents the price of the candlestick "high," and the percentage value indicates the price difference from the previous bullish reversal pattern's candlestick "low."
⭐️ Probability Table
The probability table shows the likelihood of reversal for each number of occurrences of bullish and bearish reversal signals, displayed in the first two columns.
It also shows the target prices for both bullish and bearish conditions for each number of reversal patterns.
⭐️ Price Targets
By combining the probability of reversal and the price forecast, price targets for new reversal patterns are calculated. These insights help traders align their strategies with price action analysis and statistics by simply observing the candlestick chart in real-time.
- Bullish Price Target: The average percentage price and probability that the next bearish reversal signal might hit.
- Bearish Price Target: The average percentage price and probability that the next bullish reversal signal might hit.
⭐️ Market Trend Panel
The market trend panel is a small table that indicates the market trend using a 200 Exponential Moving Average (EMA) alongside reversal signals. A bullish reversal pattern above the moving average indicates a "bullish" market, while a bearish reversal pattern below it indicates a "bearish" market. If the price fluctuates around the moving average, it is identified as "choppy."
The panel also shows the risk and reward for each trade by taking the closing bullish and bearish targets from the most recent reversal pattern's price reference. Lastly, it displays the probability of reversal, consistent with the number highlighted in the probability table.
⭐️ Other Visual Aid
Other visual aids visualize the market trend and potential direction for users on the candlestick chart.
- Background colors reflect the current market trend (green = bullish, red = bearish, blue = choppy).
- A white plotted line represents the moving average for categorizing market trends.
❗️LIMITATIONS
- Price targets represent only the mean of percentage differences. Therefore, the price could reverse before hitting either side of the price target.
- When the market is in extreme price action or a new market pattern, the price targets may not be forecasted accurately and might move out of the model's range.
- This model works best for assets with less price variation and a near-Gaussian distribution in returns. It may be less accurate for assets with random price movements.
CONCLUSION
This indicator uses fundamental statistics and mathematical models to generate reversal probabilities and price forecasts. It does not have the ability to predict the future with certainty. Traders should combine this indicator with other confirmation strategies to make informed investment decisions.
See Author's instructions below to get instant access to this indicator.
RISK DISCLAIMER
Trading entails substantial risk, and most day traders incur losses. All content, tools, scripts, articles, and education provided by TradeDots serve purely informational and educational purposes. Past performances are not definitive predictors of future results.
NOTES*
- Calculations are based on historical data and do not guarantee future results.
- Reversals exceeding ten consecutive occurrences are rare (likely <1% of total occurrences).
- Users SHOULD NOT blindly follow the price targets as their trading strategy.
- If you encounter a timeout with this indicator, reapply it to your chart.
- Minor bug fix
⭐️ Price Prediction Lines for Bullish and Bearish Targets
📝 HOW IT WORKS
This indicator identifies the average number of bars and average return for each reversal pattern occurrence.
Each line represents the average percentage return and the number of bars required for the next reversal pattern to emerge.
Users can tweak the price target sensitivity settings to balance accuracy with risk and reward.
The lines update with each new reversal pattern, ensuring that the data and percentages are always based on the most recent patterns.
⭐️ Autopilot Mode for Price Prediction Targets
📝 HOW IT WORKS
For each new reversal pattern that appears on the chart, the variance of time and returns is assessed to determine market volatility.
Using this new volatility value, the target lines are automatically adjusted to reflect the most current market conditions for greater accuracy.
This feature is particularly effective for assets like Forex and Cryptocurrencies, which exhibit high intrinsic volatility.
For stocks, which usually experience occasional spikes and dips (e.g., post-earnings reports), this feature may be less accurate.
Note: During periods of extreme volatility, predictions may be less frequent, as prices might have deviated significantly from the normal trend. Similarly, if the price forms a new market pattern, such as an all-time high, the prediction accuracy might decrease.
OTHER FEATURES
- New dashboard settings
- Visual changes
- Minor changes
- Updated risk and reward calculation
- Customizable table location
- Customizable text size
- New dashboard settings
- Visual updates
- Minor changes
- New alert features: Bullish/Bearish Reversals & Extreme buy/sell alerts
- Extreme buy/sell labels (market unusual activities)
- New dashboard settings
- Minor bug fix
- Improve script efficiency
- Improve default script settings
- New dashboard settings
- Minor bug fix
Skript nur auf Einladung
Ausschließlich Nutzer mit einer Erlaubnis des Autors können Zugriff auf dieses Script erhalten. Sie müssen diese Genehmigung bei dem Autor beantragen. Dies umfasst üblicherweise auch eine Zahlung. Wenn Sie mehr erfahren möchten, dann sehen Sie sich unten die Anweisungen des Autors an oder kontaktieren Sie tradedots direkt.
TradingView empfiehlt NICHT, für die Nutzung eines Scripts zu bezahlen, wenn Sie den Autor nicht als vertrauenswürdig halten und verstehen, wie das Script funktioniert. Sie können außerdem auch kostenlose Open-Source-Alternativen in unseren Community-Scripts finden.
Hinweise des Autors
Haftungsausschluss
Skript nur auf Einladung
Ausschließlich Nutzer mit einer Erlaubnis des Autors können Zugriff auf dieses Script erhalten. Sie müssen diese Genehmigung bei dem Autor beantragen. Dies umfasst üblicherweise auch eine Zahlung. Wenn Sie mehr erfahren möchten, dann sehen Sie sich unten die Anweisungen des Autors an oder kontaktieren Sie tradedots direkt.
TradingView empfiehlt NICHT, für die Nutzung eines Scripts zu bezahlen, wenn Sie den Autor nicht als vertrauenswürdig halten und verstehen, wie das Script funktioniert. Sie können außerdem auch kostenlose Open-Source-Alternativen in unseren Community-Scripts finden.