OPEN-SOURCE SCRIPT
Aktualisiert EBL - Enigma BOS Logic
The EBL - Enigma BOS Logic indicator is designed to detect key trend reversal points with precision by leveraging a unique concept based on two-candle price action analysis. Inspired by the balance of pairs in creation, this indicator identifies trend changes by focusing on significant bullish and bearish candle pairs, storing key levels, and waiting for confirmation to provide actionable trade signals. It goes beyond conventional trend-following indicators by offering real-time alerts and clear visual cues for traders.
How It Works
Bullish Setup:
The indicator identifies a bullish candle followed by a bearish candle. It then stores the high of the bullish candle as a potential reversal level.
A bullish confirmation occurs when a future bullish candle closes above the stored high. When this happens:
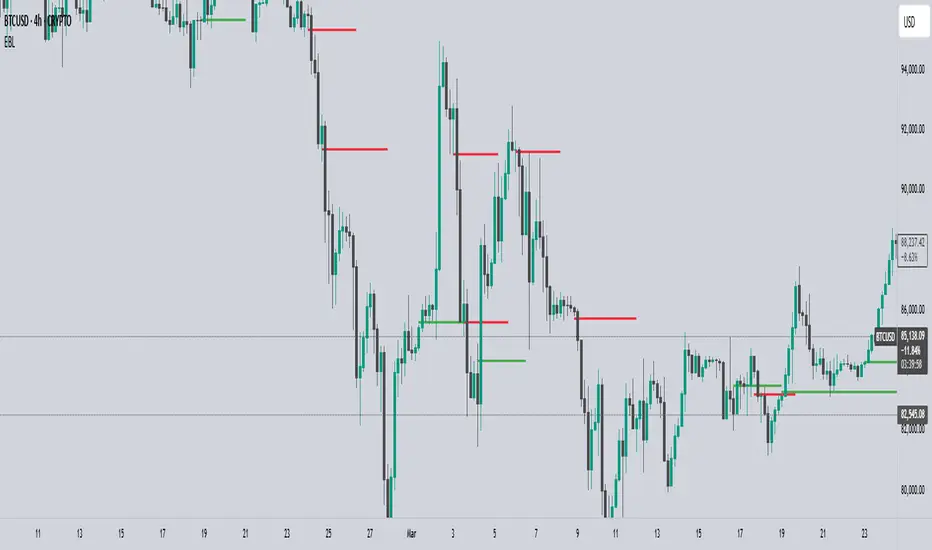
A green arrow is plotted below the confirming candle.
A horizontal green line is drawn at the stored high level, extending forward by a user-defined number of bars.
An alert is triggered to notify the trader of a confirmed bullish trend.
Bearish Setup:
The indicator identifies a bearish candle followed by a bullish candle. It stores the low of the bearish candle as a potential reversal level.
A bearish confirmation occurs when a future bearish candle closes below the stored low. When this happens:
A red arrow is plotted above the confirming candle.
A horizontal red line is drawn at the stored low level, extending forward by a user-defined number of bars.
An alert is triggered to notify the trader of a confirmed bearish trend.
Touch or Cross Alerts:
In addition to initial trend confirmation, the indicator tracks price movements relative to the drawn horizontal lines.
If the price returns to touch or cross a previously drawn horizontal line, an alert is triggered, indicating a potential re-entry or retracement opportunity.
Customization Options
To make the indicator versatile and adaptable for different trading styles, several customization options are provided:
Line Colors: Traders can customize the colors of the bullish and bearish lines.
Show/Hide Arrows and Lines: Users can choose whether to display the arrows and horizontal lines on the chart.
Line Length: The length of the horizontal lines (number of bars they extend into the future) is user-defined, offering flexibility based on trading timeframes and preferences.
Use Cases
Trend Reversal Detection: EBL is ideal for identifying key trend reversals, allowing traders to enter trades with a high probability of success.
Breakout Confirmation: The indicator provides visual and alert-based confirmation of breakouts beyond critical support or resistance levels.
Re-entry Opportunities: With alerts for price touching or crossing horizontal lines, traders can spot potential re-entry points during retracements.
Conceptual Foundation
The methodology behind this indicator is rooted in the principle that markets often move in pairs of bullish and bearish forces. By tracking the interaction between consecutive bullish and bearish candles and waiting for clear confirmations, this indicator ensures that only high-probability trend changes are signaled. This reduces noise and enhances trading accuracy, making it suitable for scalping, day trading, and swing trading across various timeframes.


How to Use
Apply the indicator to any chart and timeframe of your choice.
Set your preferred customization options, including line colors, arrow display, and line length.
Watch for arrows and listen for alerts to identify confirmed trend changes.
Pay attention to touch or cross alerts on horizontal lines, as these can signal potential re-entry or secondary trade opportunities.
Combine with other analysis: While EBL is powerful on its own, combining it with support/resistance analysis, moving averages, or volume indicators can further enhance its effectiveness.
This indicator is a powerful tool for traders seeking precision in identifying trend changes and actionable trade signals. Its unique logic, real-time alerts, and clear visual cues make it a valuable addition to any trader’s toolkit.
How It Works
Bullish Setup:
The indicator identifies a bullish candle followed by a bearish candle. It then stores the high of the bullish candle as a potential reversal level.
A bullish confirmation occurs when a future bullish candle closes above the stored high. When this happens:
A green arrow is plotted below the confirming candle.
A horizontal green line is drawn at the stored high level, extending forward by a user-defined number of bars.
An alert is triggered to notify the trader of a confirmed bullish trend.
Bearish Setup:
The indicator identifies a bearish candle followed by a bullish candle. It stores the low of the bearish candle as a potential reversal level.
A bearish confirmation occurs when a future bearish candle closes below the stored low. When this happens:
A red arrow is plotted above the confirming candle.
A horizontal red line is drawn at the stored low level, extending forward by a user-defined number of bars.
An alert is triggered to notify the trader of a confirmed bearish trend.
Touch or Cross Alerts:
In addition to initial trend confirmation, the indicator tracks price movements relative to the drawn horizontal lines.
If the price returns to touch or cross a previously drawn horizontal line, an alert is triggered, indicating a potential re-entry or retracement opportunity.
Customization Options
To make the indicator versatile and adaptable for different trading styles, several customization options are provided:
Line Colors: Traders can customize the colors of the bullish and bearish lines.
Show/Hide Arrows and Lines: Users can choose whether to display the arrows and horizontal lines on the chart.
Line Length: The length of the horizontal lines (number of bars they extend into the future) is user-defined, offering flexibility based on trading timeframes and preferences.
Use Cases
Trend Reversal Detection: EBL is ideal for identifying key trend reversals, allowing traders to enter trades with a high probability of success.
Breakout Confirmation: The indicator provides visual and alert-based confirmation of breakouts beyond critical support or resistance levels.
Re-entry Opportunities: With alerts for price touching or crossing horizontal lines, traders can spot potential re-entry points during retracements.
Conceptual Foundation
The methodology behind this indicator is rooted in the principle that markets often move in pairs of bullish and bearish forces. By tracking the interaction between consecutive bullish and bearish candles and waiting for clear confirmations, this indicator ensures that only high-probability trend changes are signaled. This reduces noise and enhances trading accuracy, making it suitable for scalping, day trading, and swing trading across various timeframes.
How to Use
Apply the indicator to any chart and timeframe of your choice.
Set your preferred customization options, including line colors, arrow display, and line length.
Watch for arrows and listen for alerts to identify confirmed trend changes.
Pay attention to touch or cross alerts on horizontal lines, as these can signal potential re-entry or secondary trade opportunities.
Combine with other analysis: While EBL is powerful on its own, combining it with support/resistance analysis, moving averages, or volume indicators can further enhance its effectiveness.
This indicator is a powerful tool for traders seeking precision in identifying trend changes and actionable trade signals. Its unique logic, real-time alerts, and clear visual cues make it a valuable addition to any trader’s toolkit.
Versionshinweise
EBL - Enigma BOS Logic
---
#### **Overview:**
The **EBL - Enigma BOS Logic** indicator is designed to assist traders in identifying and trading Break of Structure (BOS) levels effectively. This tool dynamically detects key bullish and bearish levels in real time and plots precise horizontal lines on the chart. These lines adapt to price action, ensuring traders can focus on critical retest and rejection zones for high-probability entries.
This indicator leverages a unique mechanism to track, confirm, and visualize structural shifts in the market, offering a robust solution for traders who rely on price action and structural analysis in their strategies.
---
#### **What Makes This Indicator Unique?**
Unlike traditional indicators that rely on lagging calculations, this script:
1. Dynamically tracks bullish and bearish market structures in real time.
2. Adapts horizontal lines to exact retest levels when price revisits key areas.
3. Removes invalidated lines automatically if price breaks through them.
4. Offers a clean and clutter-free visualization by dynamically extending lines only when price respects a level.
5. Combines simplicity and precision, making it ideal for both scalpers and swing traders who prioritize structure-based setups.
---
#### **How It Works:**
1. **Detection of BOS Levels:**
- Identifies key bullish and bearish patterns using candle formations (e.g., a bullish candle followed by a bearish candle signifies a potential bearish structure).
- Captures the high of bullish structures and the low of bearish structures as BOS levels.
2. **Confirmation and Line Plotting:**
- Waits for price to confirm these levels by rejecting them or retesting them.
- Once confirmed, plots a horizontal line at the exact retest level.
3. **Dynamic Line Management:**
- If price respects a level, the line extends dynamically, providing a clear indication of a valid structural level.
- If price invalidates a level by breaking through it, the line is removed automatically, keeping the chart clean.
4. **Visual and Alert Features:**
- Displays arrows for confirmed bullish and bearish levels.
- Alerts traders when price touches or crosses a level, ensuring they never miss an opportunity.
---
#### **How to Use the Indicator:**
1. **Scalping and Intraday Trading:**
- Use the dynamic lines as potential support and resistance levels.
- Enter trades at retests of these levels with confirmation from candlestick patterns.
2. **Swing Trading:**
- Utilize the lines to identify structural shifts on higher timeframes.
- Wait for price to revisit these levels for low-risk entry points.
3. **Custom Settings:**
- **Bullish Line Color:** Customize the color of bullish BOS lines.
- **Bearish Line Color:** Customize the color of bearish BOS lines.
- **Arrows and Lines:** Toggle the visibility of arrows and lines.
- **Line Length:** Adjust how far the lines extend across the chart.
---
#### **Concepts Underlying the Calculations:**
This indicator is rooted in price action theory, specifically the concept of **Break of Structure (BOS):**
- A BOS occurs when price breaks a significant high (bullish structure) or low (bearish structure), signaling a potential trend reversal or continuation.
- Retests of BOS levels are critical zones where traders can identify low-risk, high-reward trade setups.
By automating the detection and visualization of BOS levels, this indicator provides traders with actionable insights and reduces the manual effort required to track market structure.
---
#### **Why Use This Indicator?**
- Eliminate guesswork in identifying key market levels.
- Enhance precision in entries and exits.
- Stay focused on valid setups with real-time alerts and visual cues.
- Adaptable for multiple trading styles (scalping, intraday, and swing trading).
---
Feel free to reach out with any questions or feedback after using the **EBL - Enigma BOS Logic** indicator. Happy trading! 🎯
Versionshinweise
The "EBL - Enigma BOS Logic" indicator is a unique and powerful tool designed to identify and visualize Break of Structure (BOS) patterns in price action, a concept widely used in market structure analysis and Smart Money Concepts (SMC). Unlike generic trend-following or scalping tools, EBL focuses on pinpointing precise moments where market structure shifts occur—those critical points where price breaks key levels after specific candle formations. This indicator stands out by combining a selective candle-pair detection method with dynamic level management, noise filtration, and customizable visuals, making it adaptable to various trading styles, from scalping to swing trading.What It Does
EBL identifies potential reversal or continuation setups by detecting two-candle patterns:
Bullish BOS: A bullish candle (close > open) followed by a bearish candle (close < open), with the high of the bullish candle stored as a key level.
Bearish BOS: A bearish candle (close < open) followed by a bullish candle (close > open), with the low of the bearish candle stored as a key level.
Once these levels are set, EBL waits for price to break above (bullish) or below (bearish) them, signaling a confirmed BOS. It then:
Draws horizontal lines at these levels to mark the structure.
Places arrows (▲ for bullish, ▼ for bearish) when the break is confirmed.
Adjusts or removes lines based on price action, using a buffer zone to filter out false breaks.
How It Works
The indicator’s logic is rooted in market structure analysis, specifically BOS, which occurs when price breaks a prior significant high or low, indicating a shift in supply/demand dynamics. Here’s the step-by-step process:
Candle Pair Detection:
EBL looks for a bullish candle followed by a bearish one (or vice versa). This pattern suggests a potential structure point where momentum may have peaked or bottomed temporarily.
A minimum candle size filter (based on ATR multiples) ensures only significant candles are considered, reducing noise from small, indecisive movements.
Level Storage:
The high of the bullish candle or low of the bearish candle is stored as a key level. These are the "structure points" traders watch for breaks.
Break Confirmation:
A bullish BOS is confirmed when price closes above the stored high, signaling potential bullish momentum.
A bearish BOS is confirmed when price closes below the stored low, indicating potential bearish momentum.
Dynamic Line Management:
Horizontal lines extend from the stored levels for a user-defined number of bars (default: 10).
If price respects the level (e.g., stays above a bullish line), the line extends further.
If price breaks through the level by a buffer zone (e.g., 0.1% of price), the line is deleted, indicating the structure is no longer valid.
Lines also adjust to exact retest points if price touches them without breaking.
Visuals and Alerts:
Arrows mark confirmed breaks, with customizable colors matching the lines (default: green for bullish, red for bearish).
Alerts notify users of confirmed BOS events, ideal for real-time trading.
Originality
EBL’s originality lies in its hybrid approach to BOS detection:
Selective Pattern Recognition: Unlike many indicators that rely on simple highs/lows or moving averages, EBL uses a specific two-candle sequence to define structure points, inspired by SMC principles but simplified for broader use.
Noise Reduction: The ATR-based candle size filter ensures only meaningful setups trigger, avoiding the clutter of generic breakout tools.
Adaptive Lines: The dynamic adjustment and buffer zone logic prevent premature invalidation, making it more practical than static level indicators.
User Control: Extensive customization options (colors, visibility, length, filters) cater to individual preferences, unlike rigid, one-size-fits-all tools.
Underlying Concepts
The calculations are grounded in market structure theory and price action analysis:
Break of Structure (BOS): A core SMC concept where price breaking a prior high or low signals a shift in market control (e.g., buyers overcoming sellers).
True Range (TR) and ATR: Used to position arrows and filter candle size, ensuring signals align with market volatility.
Buffer Zone: A percentage-based threshold (e.g., 0.1%) adds a layer of confirmation, preventing false breaks in choppy conditions.
This isn’t a generic trend detector or oscillator—it’s a precision tool for traders who analyze structure and trade breakouts or retests.
How to Use It
Add to Chart: Copy the script into TradingView’s Pine Editor and add it to your chart.
Customize Settings (via the gear icon):
Bullish/Bearish Line Color: Match your chart theme (default: green/red).
Show Arrows/Lines: Toggle visuals based on preference (default: both on).
Horizontal Line Length: Set how long lines extend (default: 10 bars).
Min Candle Size: Increase (e.g., 1.0) for stricter setups, decrease (e.g., 0.3) for more signals (default: 0.5 ATR).
Buffer Zone %: Adjust sensitivity to invalidation (default: 0.1%).
Interpret Signals:
Bullish BOS (▲): Look for buying opportunities or trend continuation when price breaks above a stored high.
Bearish BOS (▼): Consider selling or shorting when price breaks below a stored low.
Watch lines for retests—price often returns to test these levels before continuing.
Set Alerts: Right-click the indicator, select "Add Alert," and choose "Bullish BOS Confirmed" or "Bearish BOS Confirmed" for real-time notifications.
Best Timeframes: Works on any timeframe, but shines on 5m–1h for scalping/day trading or 4h–D for swing trading.
Trading Tips
Confluence: Combine EBL with support/resistance, Fibonacci levels, or volume to confirm signals.
Volatility: Test on volatile assets (e.g., crypto, forex) for clearer BOS patterns; adjust Min Candle Size for quieter markets.
Risk Management: Use BOS breaks as entry points, with stops below/above the structure level.
Why Use EBL?
If you’re tired of vague trend indicators or overcomplicated systems, EBL offers a clear, structure-based approach to spotting high-probability setups. It’s not just another breakout tool—it’s a disciplined, customizable way to trade market shifts with confidence.
Versionshinweise
EBL - Enigma BOS LogicOverview: EBL - Enigma BOS Logic is a unique tool for spotting Breakout of Structure (BOS) events, inspired by ICT/Smart Money market structure analysis. Unlike typical trend or scalping indicators, it detects two-candle reversal patterns signaling momentum shifts, confirms breakouts, and draws adaptive horizontal lines at key levels.
What It Does: EBL identifies BullBear (bullish then bearish candle) and BearBull (bearish then bullish candle) pairs, storing their highs/lows. When price breaks these levels with confirmation, it plots lines to mark breakout zones, which extend or vanish based on price action, highlighting support/resistance.
How It Works:
Candle Detection: Filters significant BullBear/BearBull pairs using ATR-based size (range or body).
Breakout Confirmation: Confirms when price sustains above highs (bullish) or below lows (bearish) for 1–5 bars.
Line Management: Draws lines at breakout levels, extending them while price stays on the right side, deleting them if it crosses a buffer (ATR or %).
Concepts: Rooted in market structure, EBL targets reversal setups (e.g., ICT inducements) at supply/demand zones, using ATR to filter noise and adapt to volatility, unlike static or lagging tools.
Usage:
Settings: Adjust line colors (green/red), length (10 bars), width (1), ATR period (14), candle size (0.5x ATR), buffer (0.1% or ATR), confirmation bars (1), and pair highlights (off).
Signals: Green lines signal bullish BOS; red lines signal bearish BOS. Creator niko-picasso369 uses it on the 30-minute chart during key sessions (e.g., London/NY), trading breakouts or retracements to lines as support/resistance.
Tips: Pair with trends, volume, or levels (Fibonacci) for confluence.
Originality: Combines pattern recognition, dynamic confirmation, and adaptive lines, scaling across markets with ATR precision.
Best Practices: Test on demo; use the 30-minute timeframe as a start; set alerts for "Bullish/Bearish BOS Confirmed."
Character Count
This version is approximately 1,900 characters (including spaces), fitting within TradingView’s limit. It retains the essence of:
Purpose: BOS detection via unique candle pairs.
Functionality: How it detects, confirms, and visualizes.
Usage: Creator’s 30-minute strategy (breakout/retracement during key sessions).
Concepts: Market structure and ATR adaptability.
Originality: What sets it apart.
Notes
Versionshinweise
EBL - Enigma BOS Logic Indicator
The EBL - Enigma BOS Logic Indicator is a sophisticated and original tool designed to identify key breakout levels (Break of Structure, or BOS) in the market using a unique candle-pair detection system combined with a trend-filtering mechanism. Unlike traditional breakout indicators that rely solely on price action or static levels, this indicator integrates a dynamic trend filter (via a customizable moving average) and a multi-timeframe approach to provide traders with precise, context-aware entry and exit levels. Built for versatility, it caters to both higher timeframe (30-minute and above) trend traders and lower timeframe (e.g., 5-minute) precision seekers, such as scalpers or swing traders looking for discounted entries.
What It Does
This indicator:
Detects Breakout Levels: Identifies potential BOS levels by analyzing specific candle patterns (BullBear or BearBull pairs) that signal a shift in market structure.
Filters by Trend: Uses a customizable Exponential Moving Average (EMA) or Simple Moving Average (SMA) to ensure signals align with the prevailing trend—green lines for bullish trends, red lines for bearish trends.
Multi-Timeframe Logic: Generates primary signals on timeframes of 30 minutes or higher, while offering refined levels on lower timeframes (e.g., 5-minute) that respect the higher timeframe trend.
Visualizes Key Levels: Plots horizontal lines at confirmed breakout levels, with customizable length, width, and color, making it easy to spot support/resistance zones.
How It Works
The indicator’s core logic revolves around a two-candle pattern detection system combined with trend confirmation:
Candle Pair Detection: It looks for a "BullBear" pair (a bullish candle followed by a bearish one) or a "BearBull" pair (a bearish candle followed by a bullish one). The first candle in the pair must exceed a minimum size threshold (measured as a multiple of the Average True Range, ATR), ensuring it represents significant momentum.
Trend Filter: A customizable moving average (default: 9-period EMA) determines the trend direction. Signals are only generated when the price action aligns with the trend—bullish signals in an uptrend (price above MA), bearish signals in a downtrend (price below MA).
Confirmation: A breakout is confirmed when price crosses the stored high (for bullish) or low (for bearish) of the candle pair and remains above/below it for a user-defined number of bars (default: 1).
Multi-Timeframe Integration: On timeframes of 30 minutes or higher, it plots primary BOS levels. On lower timeframes, it displays additional levels below (bullish) or above (bearish) these primary levels, filtered by the trend, to help traders find optimal entry points.
The lines are dynamically managed: they extend as price respects them and are removed if price breaches a buffer zone (calculated as a percentage of price or ATR multiple), preventing clutter on the chart.
Originality
The EBL - Enigma BOS Logic Indicator stands out due to its:
Unique Candle Pair System: Rather than relying on generic price breakouts or pivots, it uses a specific two-candle sequence to pinpoint structure breaks, reducing noise.
Trend-Adaptive Signals: The integration of a moving average filter ensures signals are contextually relevant, unlike many indicators that generate signals indiscriminately.
Timeframe Hierarchy: The ability to generate primary levels on higher timeframes and refine them on lower timeframes offers a structured approach not commonly found in other BOS indicators.
Customizable Parameters: From candle size thresholds to buffer zones, every aspect can be tailored to suit different markets or trading styles.
How to Use It
Setup:
Add the indicator to your chart on TradingView.
Adjust inputs like Moving Average Period (e.g., 9 for short-term, 50 for longer-term trends), MA Type (EMA or SMA), and Min Candle Size (ATR multiple) to match your trading style.
Set Show Lines to true to visualize breakout levels.
Higher Timeframe Analysis (30-minute and above):
Use this timeframe to identify primary BOS levels. Green lines appear in bullish trends (price above MA), indicating potential support for buy entries. Red lines appear in bearish trends (price below MA), marking resistance for sell entries.
Example: On a 30-minute gold chart, a green line at 1.72483 in a bullish trend suggests a key support level.
Lower Timeframe Precision (e.g., 5-minute):
Switch to a lower timeframe to find discounted entry points below (bullish) or above (bearish) the primary levels. Only lines consistent with the higher timeframe trend will appear.
Example: If the 30-minute chart shows a bullish green line at 1.72483, the 5-minute chart will plot additional green lines below this level for precise long entries.
Trading Strategy:
Trend Trading: Enter long when price respects a green line in a bullish trend, or short at a red line in a bearish trend.
Scalping: Use lower timeframe lines to capture quick moves toward the higher timeframe levels.
Combine with other tools (e.g., RSI, volume) for confirmation.
Underlying Concepts
Break of Structure (BOS): A BOS occurs when price breaks a significant high or low, signaling a potential continuation of the trend. This indicator automates that detection with a focus on reliability.
ATR-Based Sizing: By using ATR to filter candle size, it ensures signals are based on statistically significant moves rather than minor fluctuations.
Trend Contextualization: The moving average filter anchors the indicator in Dow Theory principles—price action should align with the trend for higher-probability trades.
Tips for Traders
Markets: Works well on volatile instruments like forex (e.g., EUR/AUD), gold, or crypto, where clear structure breaks are common.
Customization: Increase MA Period for smoother trends or decrease it for faster signals. Adjust Min Candle Size to filter out noise in choppy markets.
Alerts: Enable alerts for "Bullish BOS Confirmed" or "Bearish BOS Confirmed" to stay updated on key breaks.
Final Note
The EBL - Enigma BOS Logic Indicator is a powerful ally for traders seeking to combine trend-following with precise breakout detection. Its multi-timeframe design bridges the gap between strategic planning and tactical execution, making it suitable for both swing traders and scalpers. Experiment with the settings to align it with your unique approach—happy trading!
Versionshinweise
The EBL - Enigma BOS Logic indicator is a unique tool designed to identify and visualize Breakout of Structure (BOS) events in price action, a key concept in market structure analysis often used by traders employing ICT (Inner Circle Trader) or Smart Money methodologies. Unlike generic trend-following or scalping tools, EBL focuses on detecting specific two-candle reversal patterns that signal potential shifts in market control, followed by confirmation of breakout levels. This indicator is original in its combination of candle pair detection, dynamic breakout confirmation, and adaptive line management, making it a versatile addition to any trader’s toolkit.What It Does
EBL identifies BullBear and BearBull candle pairs—specific two-candle formations where momentum shifts—and marks critical price levels (highs or lows) from these patterns. Once price breaks these levels with sufficient confirmation, the indicator draws horizontal lines to highlight the breakout zones. These lines dynamically extend or disappear based on price behavior, helping traders visualize key support/resistance levels and anticipate continuation or reversal opportunities.
How It Works
The indicator operates through a three-step process:
Candle Pair Detection:
BullBear Pair: A bullish candle (close > open) followed by a bearish candle (close < open), indicating a potential rejection of higher prices.
BearBull Pair: A bearish candle (close < open) followed by a bullish candle (close > open), suggesting a rejection of lower prices.
A size filter ensures these candles are significant, measured either by their full range (high - low) or body size (close - open), compared to a multiple of the Average True Range (ATR).
Breakout Confirmation:
The high of a BullBear pair or the low of a BearBull pair is stored as a breakout level.
A breakout is confirmed when price closes above the stored high (bullish) or below the stored low (bearish) for a user-defined number of bars (e.g., 1–5 bars). This multi-bar confirmation reduces false signals by ensuring sustained momentum.
Line Visualization and Management:
Upon confirmation, a horizontal line is drawn at the breakout level, extending for a customizable number of bars.
Lines persist as long as price remains on the "correct" side (above for bullish, below for bearish). If price crosses a buffer zone in the opposite direction (e.g., a percentage of price or ATR multiple), the line is deleted, keeping the chart clean and relevant.
Underlying Concepts
EBL is rooted in market structure analysis, a method that interprets price action through the lens of supply and demand zones, order blocks, and liquidity grabs. The two-candle patterns it detects are inspired by reversal setups often seen at key structural points, such as failed attempts to sustain a trend (e.g., an "inducement" in ICT terms). The ATR-based size filter ensures that only significant candles—those likely driven by institutional activity—are considered, filtering out noise. The confirmation delay and buffer zone adapt the indicator to varying market conditions, balancing sensitivity and reliability.
This approach differs from traditional trend-following indicators (e.g., moving averages) or oscillators (e.g., RSI) by focusing on discrete structural events rather than continuous trend signals. It’s not strictly a scalping tool but can be used across timeframes, from intraday (e.g., 5-minute charts) to swing trading (e.g., daily charts), depending on the trader’s strategy.
How to Use It
Add to Chart:
Load the indicator on any TradingView chart. It’s an overlay, so it works directly on price action.
Customize Settings:
Line Colors: Adjust Bullish Line Color (default: green) and Bearish Line Color (default: red) for visibility.
Show Lines: Toggle lines on/off (default: on).
Line Length: Set how many bars lines extend (default: 10).
Line Width: Adjust thickness (default: 1).
ATR Period: Define the ATR lookback (default: 14) for size and buffer calculations.
Candle Size Type: Choose "Range" (high-low) or "Body" (close-open) for the size filter (default: Range).
Min Candle Size: Set the ATR multiple for candle significance (default: 0.5).
Buffer Type: Select "Percentage" or "ATR" for the buffer zone (default: Percentage).
Buffer Zone Value: Define the buffer size (default: 0.1, i.e., 0.1% or 0.1x ATR).
Confirmation Bars: Set how many bars price must stay beyond the level (default: 1).
Highlight Candle Pairs: Toggle background highlights for detected pairs (default: off).
Interpret Signals:
Bullish BOS: A green line appears when price breaks above a stored high, suggesting bullish momentum or a new support level.
Bearish BOS: A red line appears when price breaks below a stored low, indicating bearish momentum or a new resistance level.
Use these lines as potential entry/exit zones, support/resistance, or to confirm higher timeframe structure.
Combine with Strategy:
Pair with trend tools (e.g., moving averages) to filter breakouts in the trend direction.
Use with volume or order flow analysis to validate institutional participation.
Apply on lower timeframes for scalping or higher timeframes for swing trading.
Alerts
Set alerts for "Bullish BOS Confirmed" or "Bearish BOS Confirmed" to be notified of breakouts in real-time.
Originality
EBL stands out by blending pattern recognition (two-candle setups), dynamic confirmation (multi-bar validation), and adaptive visualization (lines with buffer zones). While many indicators mark static levels or rely on lagging averages, EBL focuses on real-time structural shifts with a configurable framework, making it both precise and adaptable. Its use of ATR for filtering and buffer management ensures it scales across instruments and volatilities, unlike fixed-value approaches.
Best Practices
Test on a demo account to tune settings for your market (e.g., forex, stocks, crypto).
Use on timeframes aligned with your trading style (e.g., 1-minute for scalping, 1-hour for day trading).
Watch for confluence with other key levels (e.g., Fibonacci, pivot points) to increase confidence.
Open-source Skript
Ganz im Sinne von TradingView hat dieser Autor sein/ihr Script als Open-Source veröffentlicht. Auf diese Weise können nun auch andere Trader das Script rezensieren und die Funktionalität überprüfen. Vielen Dank an den Autor! Sie können das Script kostenlos verwenden, aber eine Wiederveröffentlichung des Codes unterliegt unseren Hausregeln.
Haftungsausschluss
Die Informationen und Veröffentlichungen sind nicht als Finanz-, Anlage-, Handels- oder andere Arten von Ratschlägen oder Empfehlungen gedacht, die von TradingView bereitgestellt oder gebilligt werden, und stellen diese nicht dar. Lesen Sie mehr in den Nutzungsbedingungen.