PROTECTED SOURCE SCRIPT
MM-Burj Khalifa Indicator
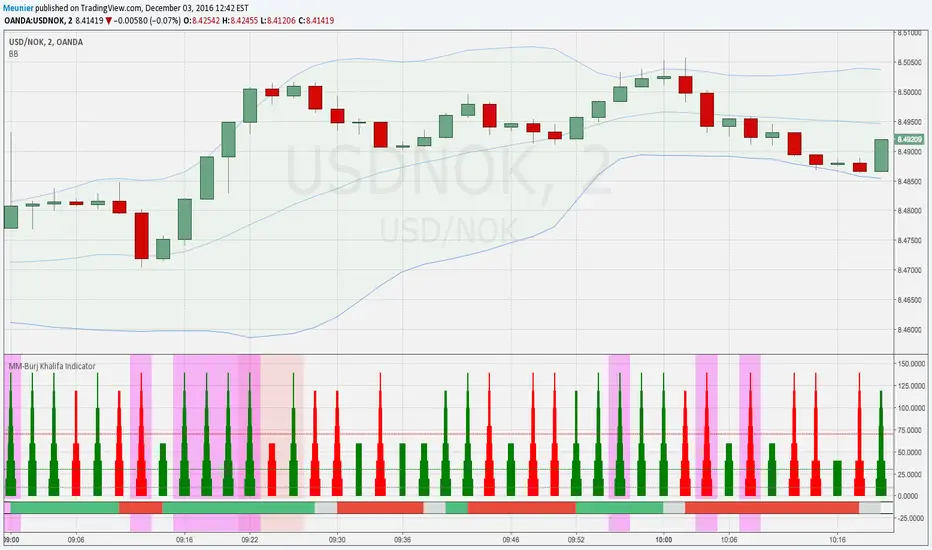
This indicator uses several signals to visualize a "perfect candle" to enter a trade.
It colors the background to identify the zones of interest (multiple configurable high or low RSI zones). Underlying is a trendbar with the current MACD direction. It's possible to tweak the indicator with a lot of options in the settings section (e.g. for which period you want a rising DM+-signal, etc.)
The indicator is using signals of:
--MACD
--RSI
--PVT
--ATR
--AD and DMI+/DMI-
When all 7 criterias are met it highlights the candle.
It also creates different colums with different height and width, so that you can see which signal is OK and which is maybe missing. When all signals are on GO you'll see a Burj-Khalifa-like figure. If not all signals are on GO you'see crippled versions.
To be clear:
it's not intended to detect trends or supertrends or reversals. It's purpose it's just to decide if this current candle is really going in the right direction. It doesn't prevent upcoming reversals in the opposite direction.
The Burj-Khalifa indicator could help to confirm the entry point of an trade which was already planned.
I'll come up with a more detailed documentation.
Geschütztes Skript
Dieses Script ist als Closed-Source veröffentlicht. Sie können es kostenlos und ohne Einschränkungen verwenden – erfahren Sie hier mehr.
Haftungsausschluss
Die Informationen und Veröffentlichungen sind nicht als Finanz-, Anlage-, Handels- oder andere Arten von Ratschlägen oder Empfehlungen gedacht, die von TradingView bereitgestellt oder gebilligt werden, und stellen diese nicht dar. Lesen Sie mehr in den Nutzungsbedingungen.