PROTECTED SOURCE SCRIPT
High/Low Percentage Difference
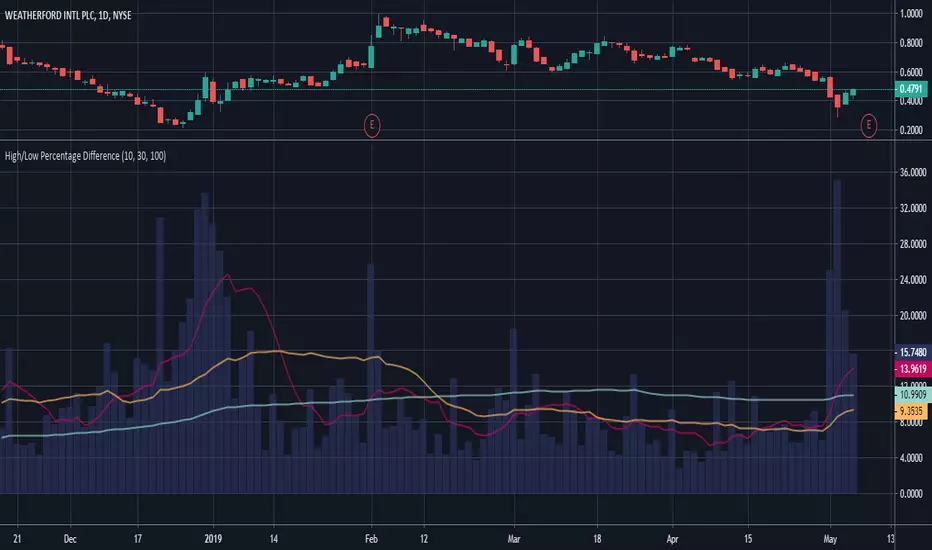
This chart shows simple moving averages of the differences in the high and low prices across the time frame you choose.
I use this when researching to see if the investment vehicle meets my criteria for volatility within the time-frame I want to invest.
The columns show the percentage difference between the current candle's high and low.
The lines show the SMA of the past 10(red), 30(orange), and 100(blue) candles, but you can edit these to be whatever you'd like.
Geschütztes Skript
Dieses Script ist als Closed-Source veröffentlicht. Sie können es kostenlos und ohne Einschränkungen verwenden – erfahren Sie hier mehr.
Haftungsausschluss
Die Informationen und Veröffentlichungen sind nicht als Finanz-, Anlage-, Handels- oder andere Arten von Ratschlägen oder Empfehlungen gedacht, die von TradingView bereitgestellt oder gebilligt werden, und stellen diese nicht dar. Lesen Sie mehr in den Nutzungsbedingungen.